1478
The clinical value of SWI at 5.0 T ultra‑high field MRI in HCC with Venous System Tumor Thrombosis1Radiology, The First Affiliated Hospital of USTC(Anhui Provincial Hospital), Hefei, China, 2The First Affiliated Hospital of USTC(Anhui Provincial Hospital), Hefei, China
Synopsis
Keywords: Liver, Cancer
Motivation: Looking for an economical and convenient magnetic resonance imaging technique to detect whether hepatocellular carcinoma is complicated with venous tumor thrombi.
Goal(s): Using a 5.0T ultra-high field MRI imaging sequence to detect the presence of cancer thrombi in HCC patients without the use of contrast agents.
Approach: Statistical analysis of the accuracy of magnetic sensitivity weighted imaging (SWI) in the diagnosis of cancer thrombi using enhanced scanning as the diagnostic criteria.
Results: SWI has high diagnostic accuracy for cancer thrombi without the use of contrast agents.
Impact: Whether HCC with thrombi is crucial for determining clinical treatment plans. Some patients may not be able to use contrast agents, and the cost of contrast agents is high. SWI can effectively display tumor thrombi, and can reduce patient costs.
Introduction
To investigate the diagnostic value of Susceptibility Weighted Imaging (SWI) for Hepatocellular Carcinoma (HCC) with venous thrombosis (including portal vein, inferior vena cava, and hepatic vein) using 5.0T ultra-high field dynamic contrast-enhanced Magnetic Resonance Imaging(MRI) as the diagnostic standard.Methods
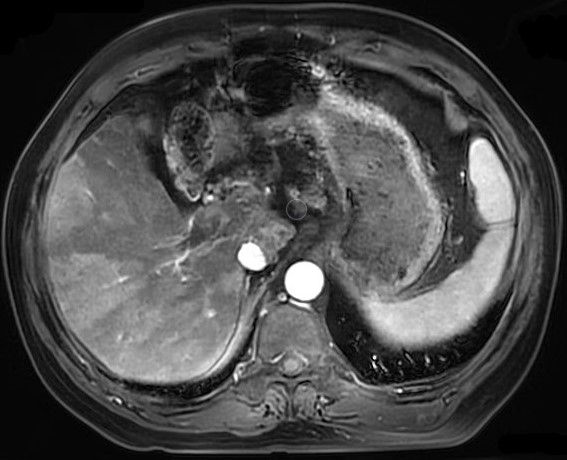
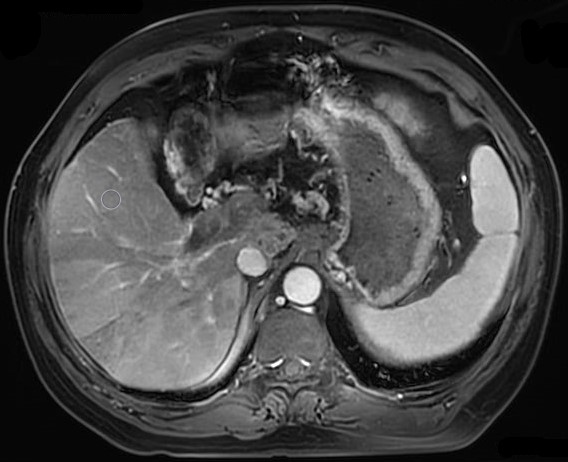
This study collected a total of 95 patients from the First Affiliated Hospital of China University of Science and Technology (Anhui Provincial Hospital) from May to July 2023 who met MRI diagnostic criteria for HCC. All patients underwent 5.0 T ultra high field liver specific contrast enhanced MRI, including SWI. The diagnostic criteria for venous cancer thrombi as follows: enhanced, dilation of the lumen, and adjacent intrahepatic lesions. Two radiologists analyzed SWI images and diagnosed whether there was a venous system tumor thrombus. The consistency of the diagnostic results was tested using the intra group correlation coefficient (ICC). Analyze the sensitivity, specificity, and accuracy of SWI in the diagnosis of venous system tumor thrombi, and conduct diagnostic consistency testing with enhanced scanning images.Results
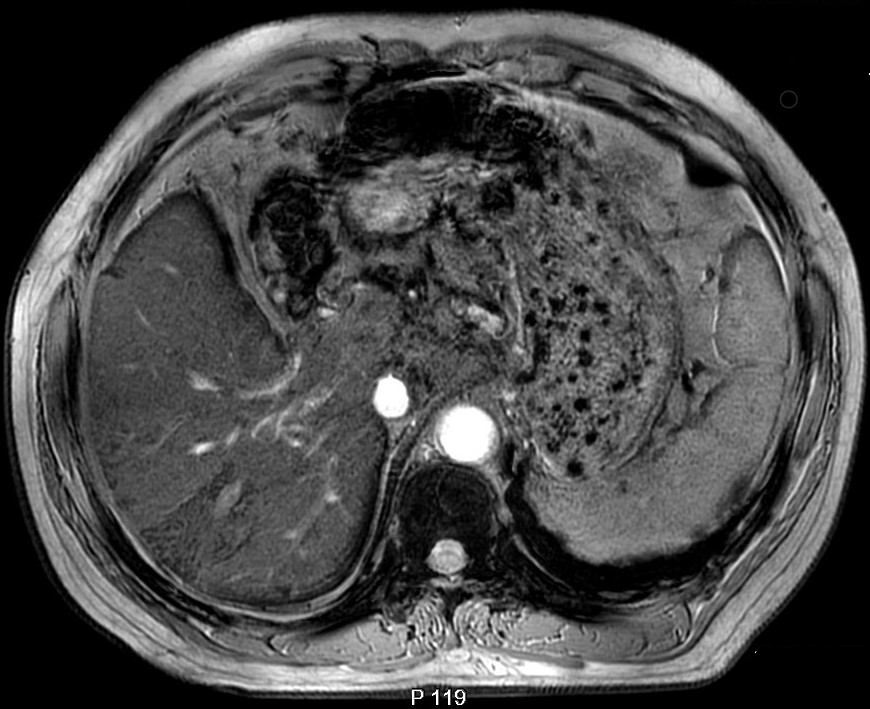
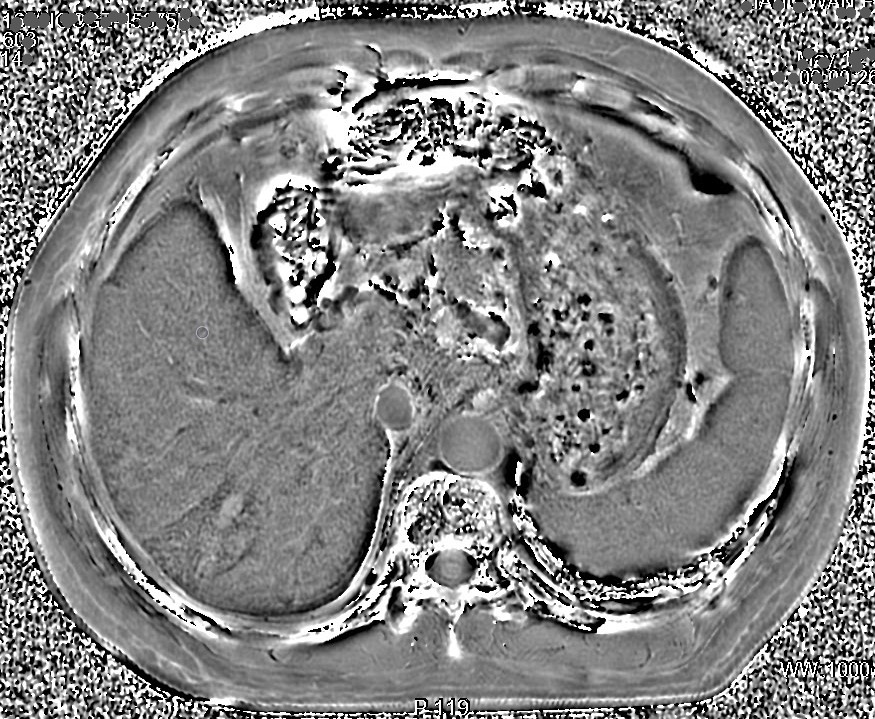
A total of 95 cases (79 males and 16 females, aged 29 to 82 (58.42 ± 9.43) years) were diagnosed with HCC by enhanced MRI. Except for 1 case in which the image could not be judged due to respiratory artifacts, the image quality was good in the remaining 94 cases. Two radiologists had good agreement in the diagnosis of HCC with enous system tumor thrombi in SWI, with an ICC value of 0.878. 83 cases were judged by two radiologists to have no venous system tumor thrombus, and 11 cases were combined with venous system tumor thrombus (including 8 cases of portal vein tumor thrombus and 3 cases of tumor thrombus in the inferior vena cava-hepatic vein). The SWI sequence showed portal vein thrombus in 8 cases (1 case was missed because the thrombus was located in the grade 3 branch of the portal vein and the layer thickness of the SWI sequence image was thick; 1 case was misdiagnosed because the intrahepatic lesion compressed the grade 3 branch of the portal vein and there were mild artifacts in the image), and there were 3 cases of thrombus of the inferior vena cava-hepatic vein. The SWI sequence has a sensitivity of 90.9%, specificity of 98.8%, and accuracy of 97.8% in the diagnosis of portal vein/inferior vena cava hepatic vein cancer thrombi. The consistency test showed that it had a good consistency with the portal vein imaging diagnosis of venous system cancer thrombi (k=0.897).Conclusion
The 5.0 T ultra high field MRI SWI sequence has good effect on HCC combined with portal/inferior vena cava-hepatic vein thrombus, with high sensitivity and specificity, and good diagnostic consistency compared with the enhancement scanning. The SWI sequence does not require injection of contrast agents and is not affected by the patient's liver, kidney, or heart function. It is a good supplement to the enhanced scanning for displaying venous cancer thrombi, and is particularly suitable for patients who cannot undergo enhanced CT/MRI scans for various reasons.Acknowledgements
No acknowledgement found.References
1. Chang SX, Li GW, Chen Y, Bao H, Zhou L, Yuan J, Wu DM, Dai YM. Characterizing venous vasculatures of hepatocellular carcinoma using a multi-breath-hold two-dimensional susceptibility weighted imaging. PLoS One, 2013,8(6):e65895.
2. Chen W, DelProposto Z, Liu W, Kassir M, Wang Z, Zhao J, Xie B, Wen Y, Wang J, Hu J. Susceptibility-weighted imaging for the noncontrast evaluation of hepatocellular carcinoma: a prospective study with histopathologic correlation. PLoS One, 2014, 9(5):e98303.
3. Huang C, Xiao X, Guo M, Hu X, Liu C, Wang J, Zhang H, Li X, Cai P. Value of susceptibility-weighted imaging in differentiating benign from malignant portal vein thrombosis. Quant Imaging Med Surg. 2023,13(4):2688-2696.
4. Shah ZK, McKernan MG, Hahn PF, Sahani DV. Enhancing and expansile portal vein thrombosis: value in the diagnosis of hepatocellular carcinoma in patients with multiple hepatic lesions. AJR Am J Roentgenol. 2007, 188(5):1320-3.
5. Gawande R, Jalaeian H, Niendorf E, Olgun D, Krystosek L, Rubin N, Spilseth B. MRI in differentiating malignant versus benign portal vein thrombosis in patients with hepatocellular carcinoma: Value of post contrast imaging with subtraction. Eur J Radiol. 2019,118:88-95.
6. Li M, Dang Z, Ma S, Wang Y, Xu X, Li B, Qian P, Dang Z. A novel prognostic scoring system to predict portal vein tumor thrombosis in patients with hepatitis B virus-associated hepatocellular carcinoma. Am J Transl Res. 2023, 15(7):4600-4609.
Figures