1477
Histogram Analysis of Hepatobiliary Contrast Uptake in Liver Metastases from Pancreatic Ductal Adenocarcinoma for Prognosis Assessment1Radiology, Gifu University, Gifu, Japan, 2Radiology Services, Gifu University Hospital, Gifu, Japan
Synopsis
Keywords: Liver, Liver
Motivation: Liver metastases with contrast uptake on hepatobiliary phase images in patients with pancreatic ductal adenocarcinoma (PDAC) were related to poor prognosis. Prior study focused on visual assessment of the tumor, however, reliable quantitativeness is necessary.
Goal(s): To evaluate the relationship between the gadoxetic acid uptake in liver metastases and overall survival (OS) in patients with PDAC using histogram analysis.
Approach: The best quantitative parameter was analyzed comparable with visual assessment using receiver operating characteristic curve analysis.
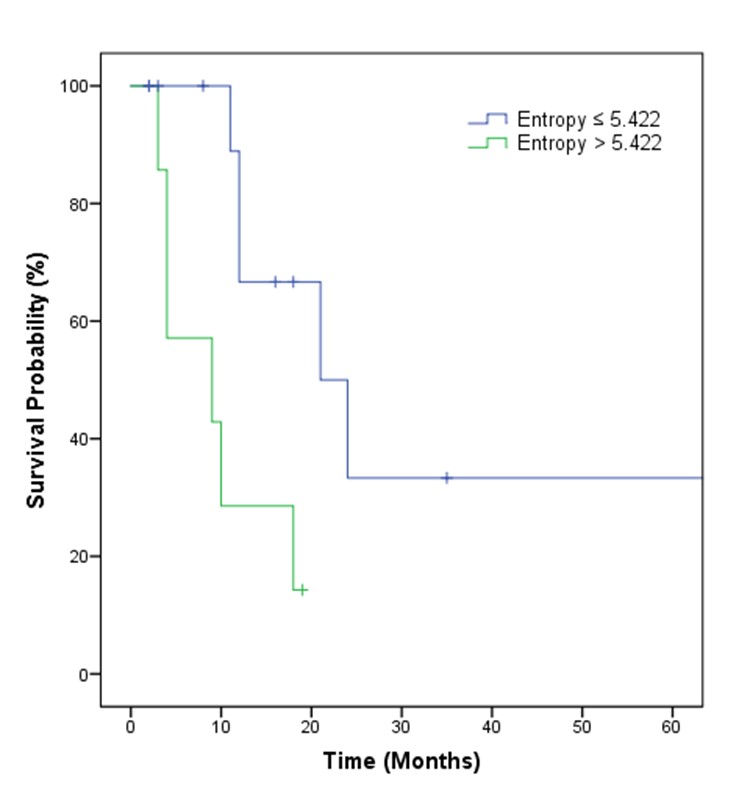
Results: Patients with the entropy of >5.422 in the greatest liver metastasis exhibited lower OS rates than those with ≤5.422 (mean, 9.6 months vs 37.7 months).
Impact: Liver metastases with contrast uptake on hepatobiliary phase images were related to poor prognosis. Entropy on histogram features in the greatest liver metastasis can be a potential quantitative imaging biomarker to predict overall survival in patients with pancreatic ductal adenocarcinoma.
Introduction
Pancreatic ductal adenocarcinoma (PDAC) is the fourth leading cause of cancer-related death in both males and females in the United States1. Majority of the patients present with locally advanced disease or metastases due to aggressive tumor biology which contributes to the poor prognosis. Liver is the most common site of distant metastases in PDAC which has been reported in approximately 80% of patients during the later stages of disease2.Gadoxetic acid-enhanced MRI had a significantly higher sensitivity for detecting liver metastases (92%‒98%)3-5. In principle, non-hepatocyte origin hepatic lesions cannot actively uptake gadoxetic acid; hence, they exhibit hypointensity on hepatobiliary phase (HBP) images. However, various cancer cells can uptake gadoxetic acid6. Recently, several studies have demonstrated the relationship between liver metastases with contrast uptake on HBP images and poor prognosis7,8. Prior study focused on visual assessment of the tumor on HBP images. Therefore, this study aimed to evaluate quantitatively the relationship between the contrast uptake in liver metastases on HBP images and overall survival (OS) in patients with PDAC using the histogram analysis.
Materials and Methods
This retrospective HIPAA-compliant study was approved by our IRB, and written informed consent was waived. Between April 2013 and May 2023, a total of 20 patients (12 men; mean age, 69 years) with pathologically proven PDAC who underwent gadoxetic acid–enhanced MRI and had at least one liver metastasis at presentation of disease were included. All the 20 patients received chemotherapy as neoadjuvant (n = 3), or palliative therapy (n = 17). HBP images were obtained 16 min (range, 15‒25 min) after 0.1 mL/kg of gadoxetic acid using breath-hold three-dimensional fat-suppressed axial T1-weighted imaging (section thickness, 4 mm; slice gap, -2 mm; field of view, 420 × 294 mm; matrix, 320 × 320; slice number, 90 slices). In patients with numerous liver metastases, we counted and evaluated liver metastases up to 10 lesions per each patient. Overall, 112 liver metastases were identified in 20 patients. Among them, 45 lesions were excluded from this study because the tumor size was too small (< 5 mm) to perform image analysis. Pathological confirmation was obtained by US guided biopsy (n = 1), or surgical resection (n = 2). In the remaining 17 patients, confirmation of metastases was obtained based on a combination of typical imaging findings, and follow-up images. For qualitative image analysis, the patterns of HBP contrast uptake in liver metastases were evaluated, and each nodule was classified as homogeneous or heterogeneous hypointense8. During patient-by-patient analysis, patients with only homogeneous hypointense nodules were placed in the homogenous group, whereas patients with only heterogeneous hypointense nodules or both patterns of nodules were placed in the heterogeneous group. For quantitative assessment, maximum diameter, histogram features, and signal-to-noise ratio (SNR) of the liver metastasis, and tumor-to-liver contrast-to-noise ratio (CNR) were evaluated. We analyzed the best quantitative parameter in the greatest liver metastasis compared with qualitative analysis using ROC curve analysis. Kaplan–Meier analysis and log-rank test for univariate analysis and Cox proportional hazards regression for multivariate analysis were conducted to evaluate prognostic factors.Results
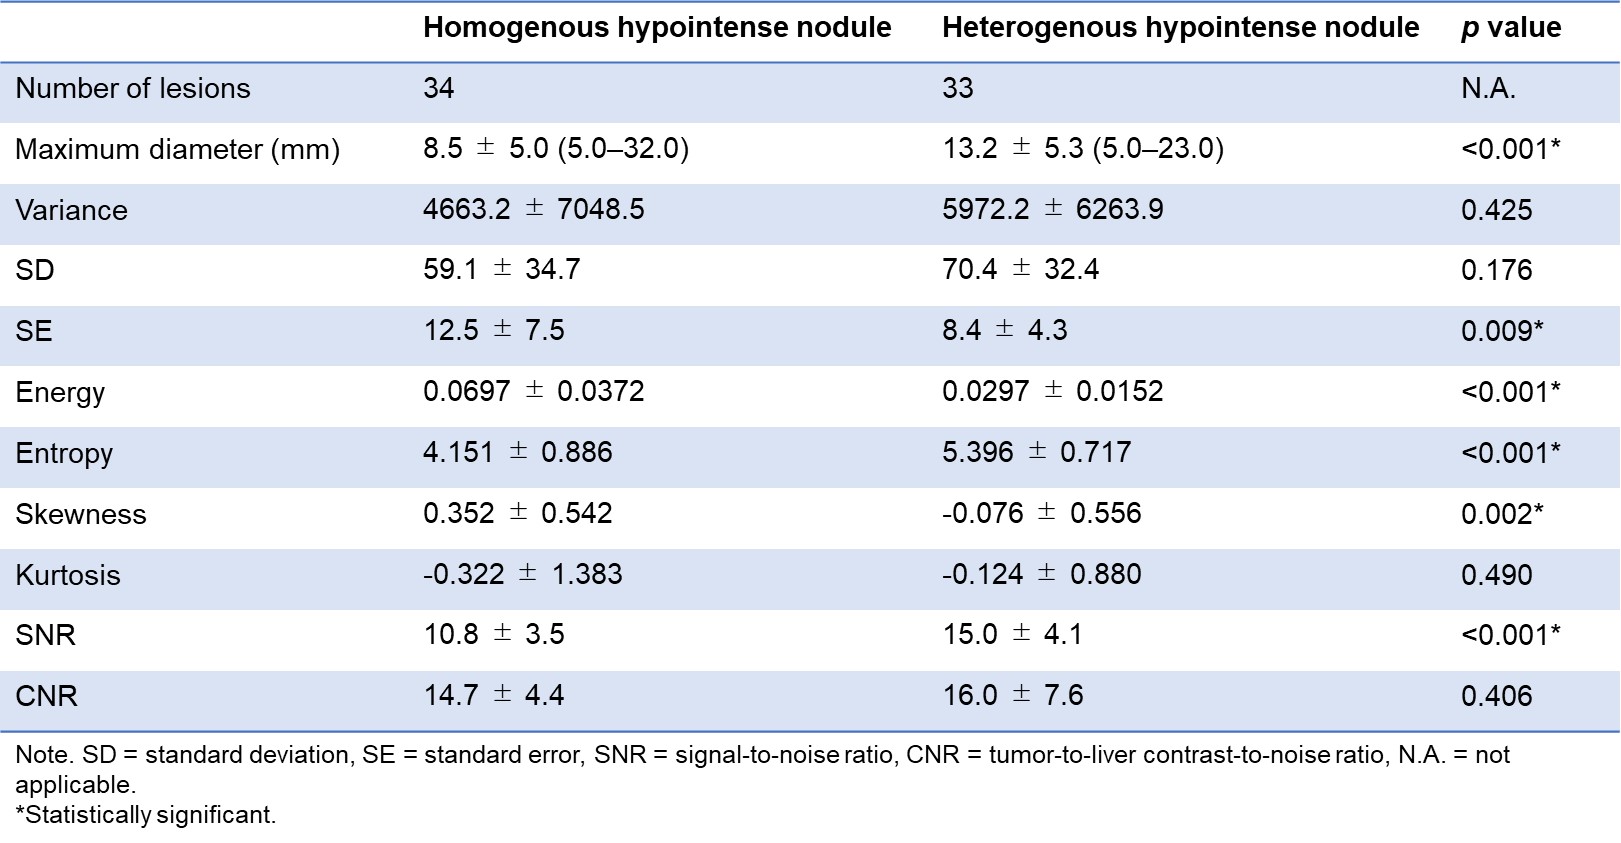
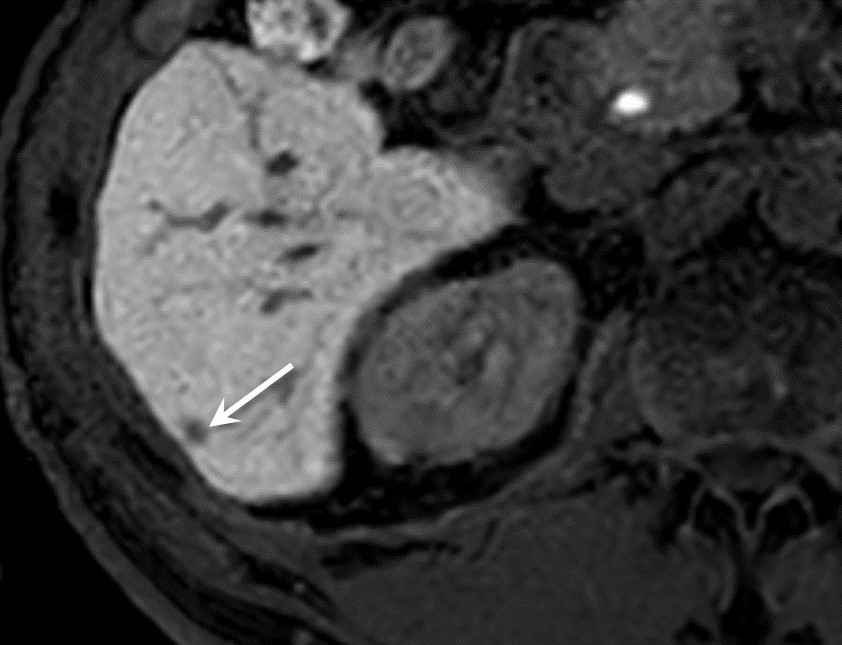
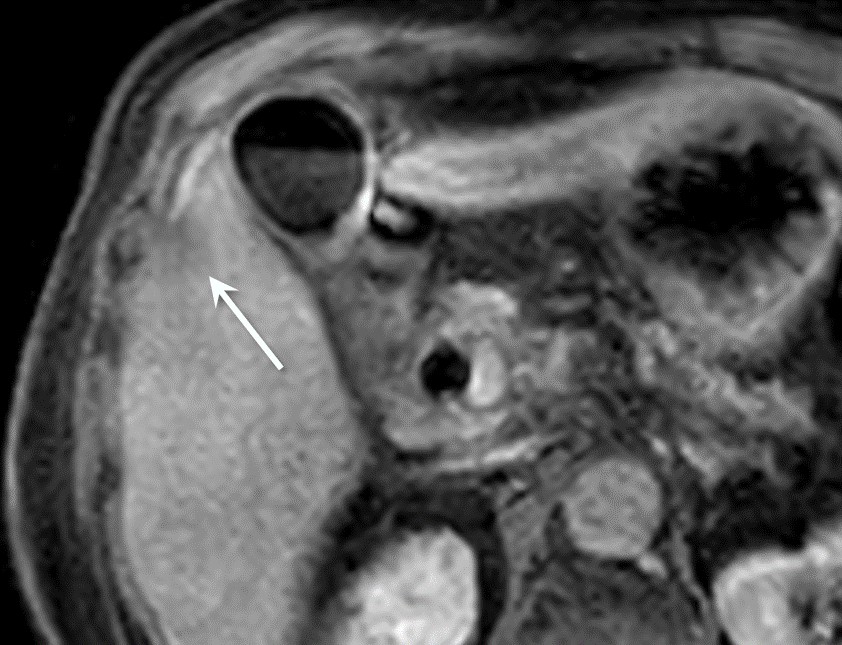
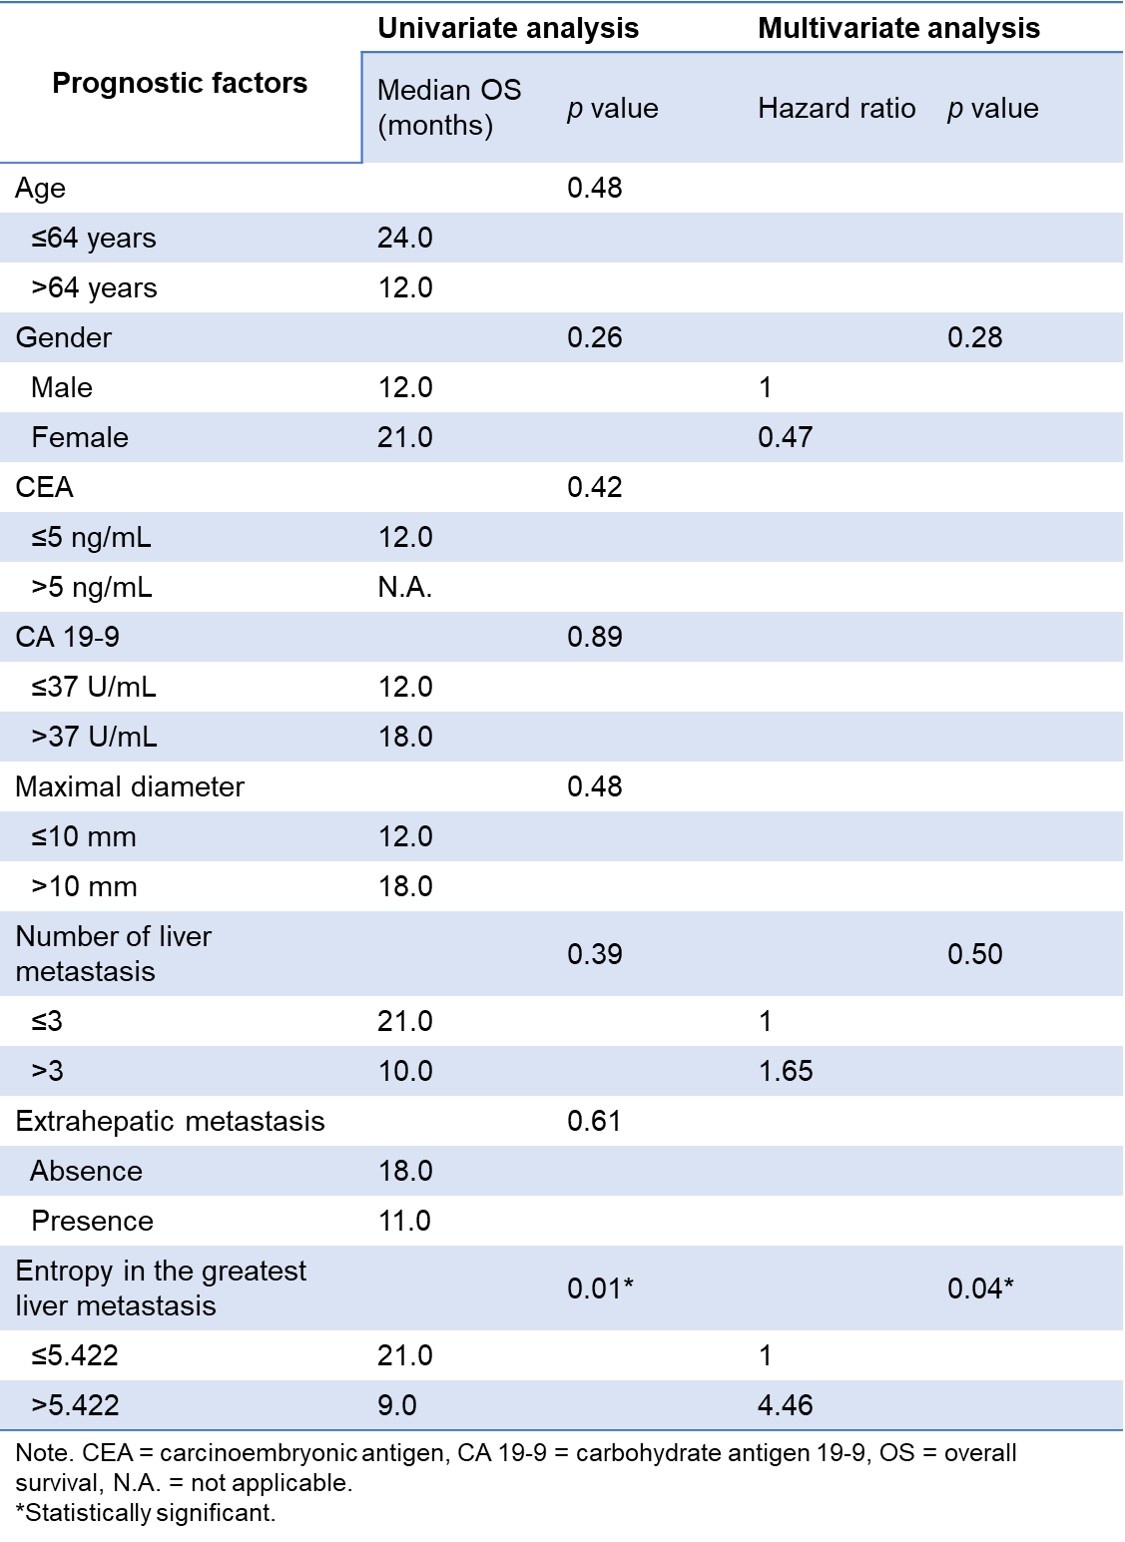
A total of 67 liver metastases were analyzed, among which 33 nodules (49%) demonstrated heterogeneous hypointensity, while 34 nodules (51%) demonstrated homogeneous hypointensity (Table 1). Homogeneous hypointense nodules were encountered in 14 patients (70%; homogeneous group, Fig. 1), heterogeneous in 4 patients (20%), and both patterns co-existed in 2 patients (10%; heterogeneous group, Fig. 2). The heterogeneous group exhibited lower OS rates than the homogeneous group (mean OS, 8.5 months vs 35.0 months; p = 0.011). ROC curve analysis revealed that the best quantitative parameter for the greatest liver metastasis was entropy as histogram features (AUC, 0.869; p = 0.011). Using the cut off value, entropy of >5.422 in the greatest liver metastasis exhibited lower OS rates than that of ≤5.422 (mean OS, 9.6 months vs 37.7 months; p = 0.009) (Table 2 and Fig. 3).Discussion
Our study demonstrated that patients with PDAC who present heterogeneous hypointense liver metastasis on HBP images are associated with lower OS rate than patients with homogeneous hypointense nodules, and these results were comparable with prior study8. In addition, we obtained reliable quantitative parameter to predict prognosis for patients with PDAC and liver metastasis. Entropy is a scientific concept that is most associated with a state of randomness. It is reasonable to assume that entropy represents heterogeneity of the liver metastases with contrast uptake on HBP images.Conclusion
Entropy on histogram features in the greatest liver metastasis on HBP images can be a potential quantitative imaging biomarker to predict OS in patients with PDAC and liver metastasis.Acknowledgements
The authors of this abstract declare no relationships with any companies whose products or services may be related to the subject matter of the article.References
- Siegel RL, Miller KD, Jemal A. Cancer statistics, 2018. CA: a cancer journal for clinicians 2018;68:7-30.
- Iacobuzio-Donahue CA, Fu B, Yachida S, et al. DPC4 gene status of the primary carcinoma correlates with patterns of failure in patients with pancreatic cancer. Journal of clinical oncology : official journal of the American Society of Clinical Oncology 2009;27:1806-13.
- Motosugi U, Ichikawa T, Morisaka H, et al. Detection of pancreatic carcinoma and liver metastases with gadoxetic acid-enhanced MR imaging: comparison with contrast-enhanced multi-detector row CT. Radiology 2011;260:446-53.
- Muhi A, Ichikawa T, Motosugi U, et al. Diagnosis of colorectal hepatic metastases: comparison of contrast-enhanced CT, contrast-enhanced US, superparamagnetic iron oxide-enhanced MRI, and gadoxetic acid-enhanced MRI. Journal of magnetic resonance imaging : JMRI 2011;34:326-35.
- Noda Y, Goshima S, Takai Y, et al. Detection of pancreatic ductal adenocarcinoma and liver metastases: comparison of Gd-EOB-DTPA-enhanced MR imaging vs. extracellular contrast materials. Abdominal radiology 2020;45:2459-68.
- Buxhofer-Ausch V, Secky L, Wlcek K, et al. Tumor-specific expression of organic anion-transporting polypeptides: transporters as novel targets for cancer therapy. Journal of drug delivery 2013;2013:863539.
- Park SH, Kim H, Kim EK, et al. Aberrant expression of OATP1B3 in colorectal cancer liver metastases and its clinical implication on gadoxetic acid-enhanced MRI. Oncotarget 2017;8:71012-23.
- Noda Y, Tochigi T, Baliyan V, Kordbacheh H, Kambadakone A. Hepatobiliary contrast uptake patterns on gadoxetic acid-enhanced MRI in liver metastases from pancreatic ductal adenocarcinoma: can it predict prognosis? European radiology 2021;31:276-82.
Figures