1476
Predicting Interstitial Fluid Pressure and Velocity in Breast Cancer with NAC using DCE-MRI and Pharmacokinetic-Fluid Flow Modeling1Department of Radiology, Memorial Sloan Kettering Cancer Center, New York, NY, United States, 2Medical Physics, Memorial Sloan Kettering Cancer Center, New York, NY, United States, 3Department of Radiology, New York Presbyterian - Weill Cornell Medical Center, New York, NY, United States, 4Department of Pathology and Laboratory Medicine, Memorial Sloan Kettering Cancer Center, New York, NY, United States
Synopsis
Keywords: Breast, Breast
Motivation: Elevated interstitial fluid pressure (IFP) or reduction in velocity (IFV) in breast cancer patients has been shown to contribute to treatment resistance, but its measurement is impractical in clinical practice.
Goal(s): Our goal is to map IFP and IFV from DCE breast MRI and to evaluate its association with treatment response.
Approach: We developed pharmacokinetic-fluid flow models to evaluate its association between IFP, IFV and neoadjuvant chemotherapy (NAC) responses.
Results: We observed small differences in IFP and IVF between NAC treatment cohorts. Initial data based on pre-NAC DCE-breast MRI suggest a potential for early prediction of treatment response of primary tumors.
Impact: Non-invasive pharmacokinetic and computational fluid dynamics modeling in breast DCE-MRI can provide information of tumor IFP and IFV. This approach has the potential to serve as a valuable non-invasive clinical tool for predicting early treatment response.
INTRODUCTION
Malignant tumor tissue develops interstitial hypertension, primarily due to restricted blood supply and impaired lymphatic flow. This results in elevated hydrostatic interstitial fluid pressure (IFP) or change in velocity (IFV) within the tumor compared to normal tissue. The negative pressure gradient between the tumor surface and normal tissue can contribute to treatment resistance and metastatic lymphatic spread1. However, measuring these parameters is impractical in clinical practice. In this study, we have integrated pharmacokinetic and fluid flow models to assess IFP and IFV in breast cancer patients non-invasively using high-resolution dynamic contrast enhanced (DCE) MRI. We computed these parameters in a subgroup of NAC patients and reported their association with treatment response.MATERIALS AND METHODS
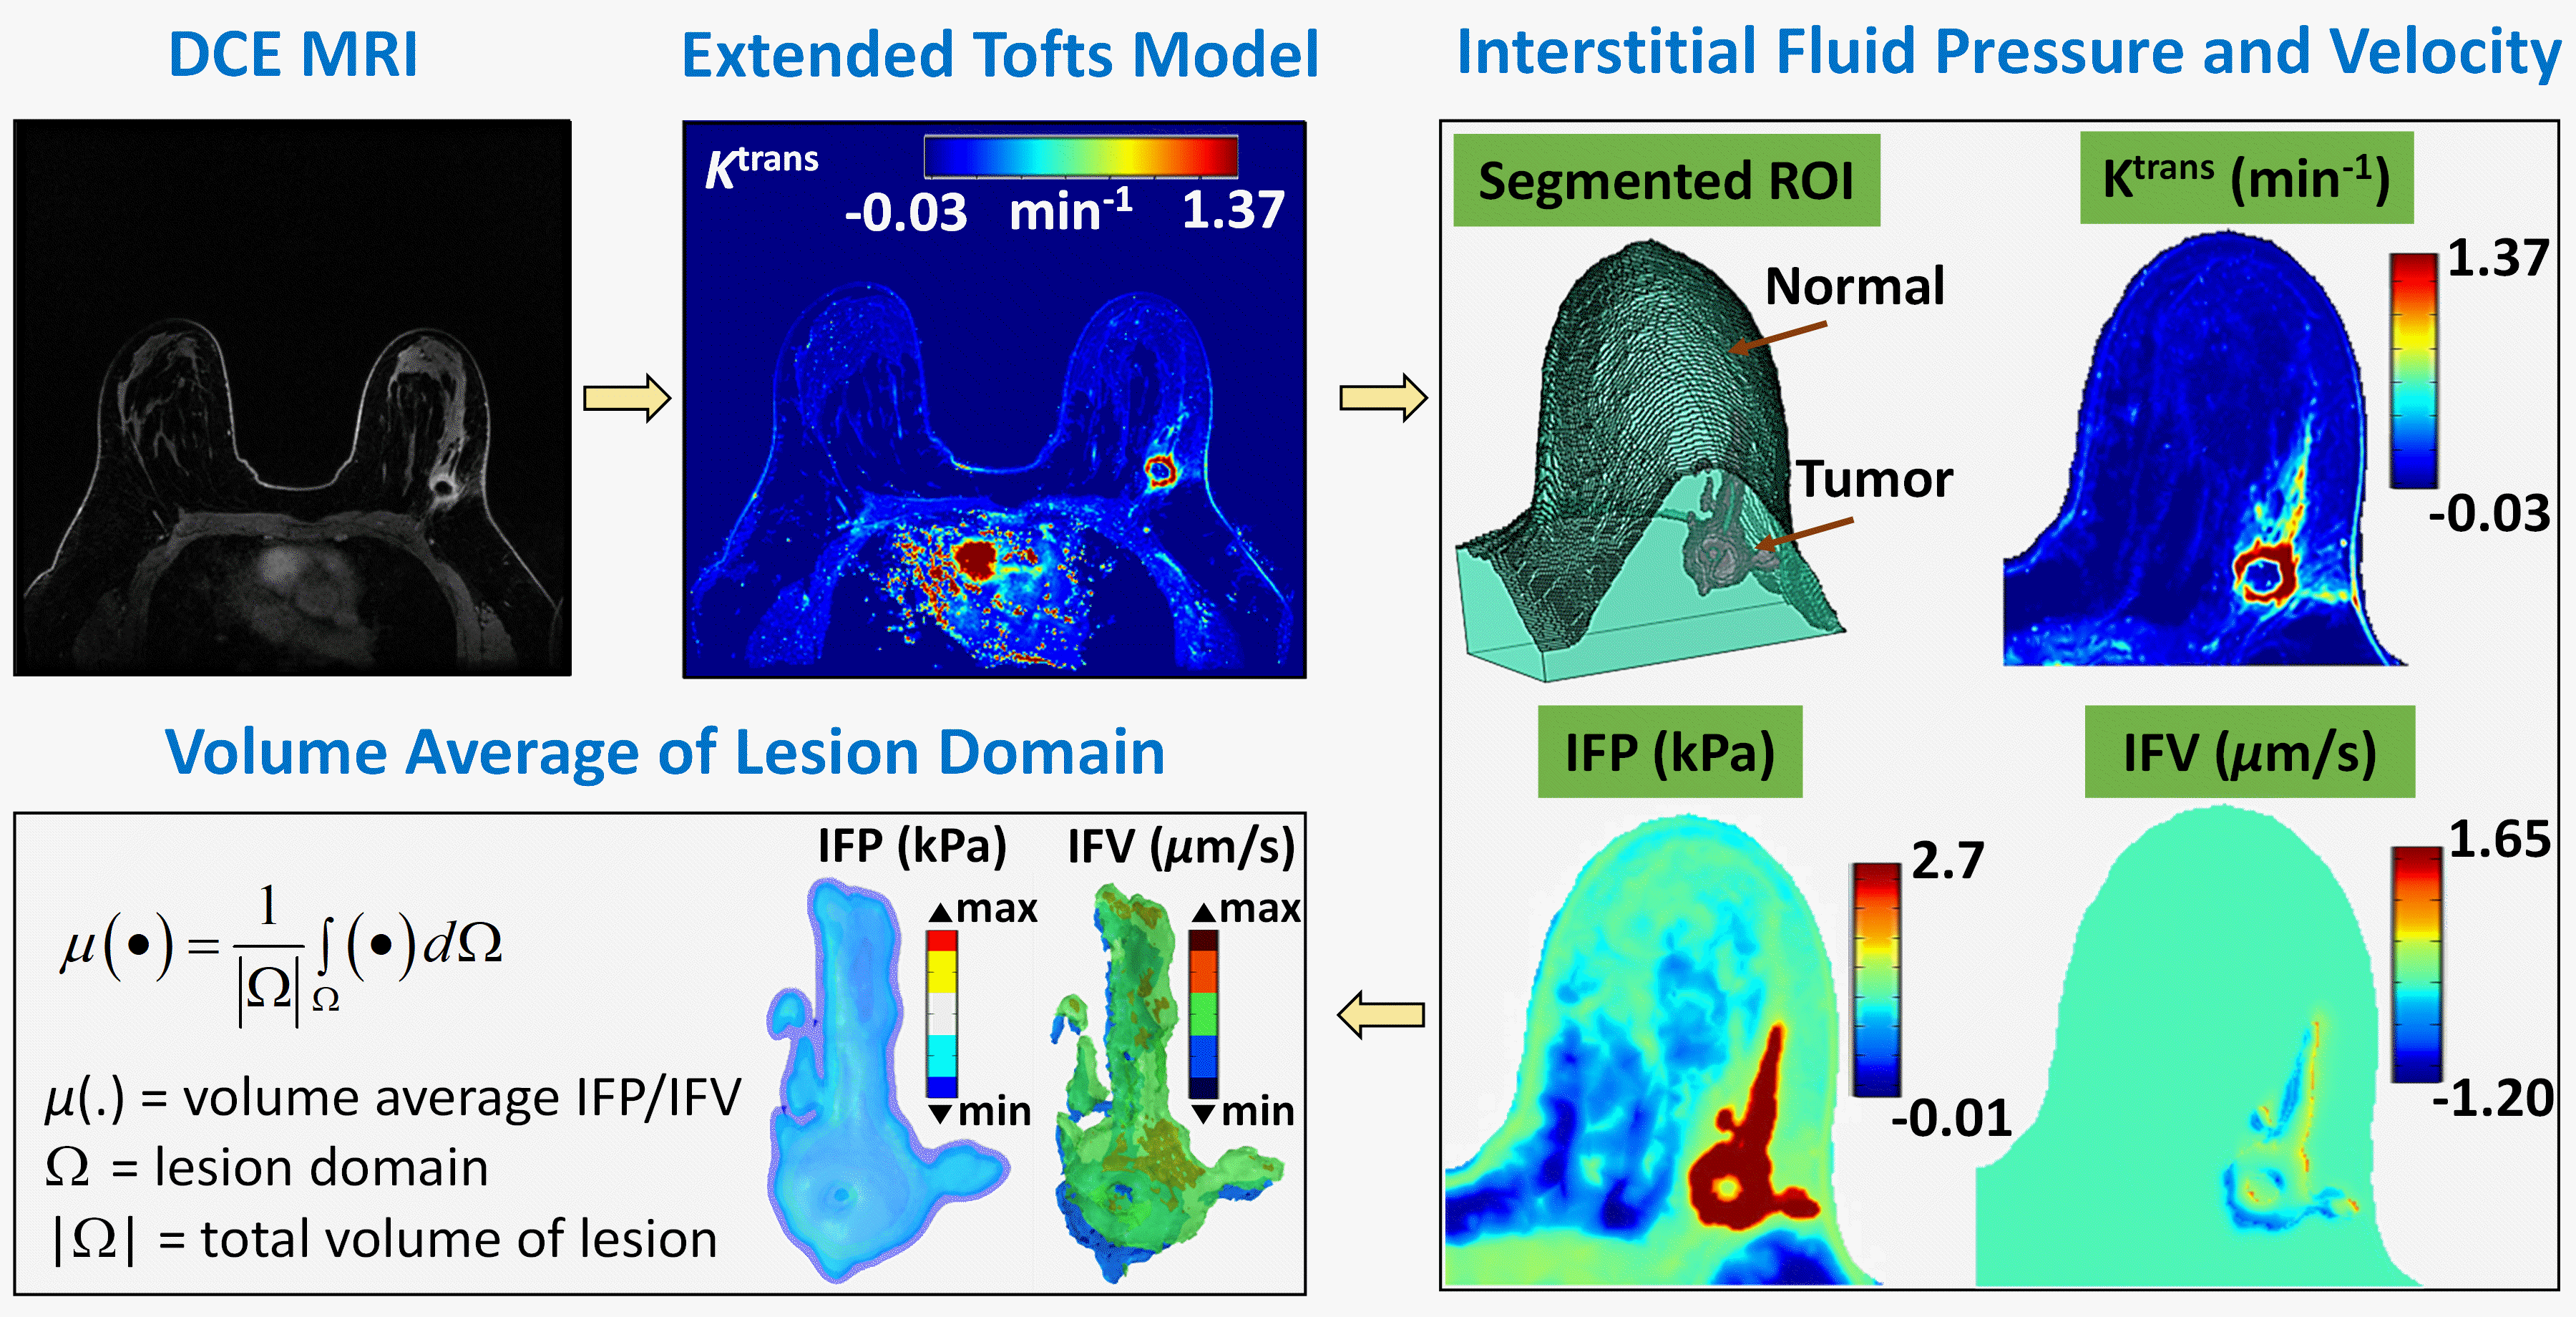
This retrospective study included breast MRI exams of patients (N =15) with recently diagnosed breast cancer who underwent MRI exam prior to NAC. All imaging exams were performed on a 3.0 Tesla system (Discovery 750, GE Medical Systems, Waukesha, WI) and DCE data was acquired using differential sub-sampling with cartesian ordering, before and after the intravenous administration of gadoterate meglumine (0.2 ml/kg). Nine post contrast timepoints were acquired with a total acquisition time of ~5-7 min. A two-compartment pharmacokinetic model, i.e., extended Tofts model (ETM)2, was solved with the aid of a commercial software Olea Sphere®, which computes the microvascular plasma volume transport between intravascular space (IVS) and extravascular extracellular space (EES). When ETM model is applied to DCE MRI (Fig. 1), the change in concentration of contrast agent between IVS and EES of tissue enabled the quantification of the plasma volume transport parameter Ktrans (min-1). Next, tumor and normal tissue volumes were manually segmented on the Ktrans map (using 3D slicer) and their binary masks were converted to a 3D computational domain (i.e., STL file) in MATLAB. At the same time, individual voxel values of Ktrans and associated coordinate information were extracted from the Ktrans maps. Finally, a steady-state fluid flow equation (1) was solved within the 3D computational domain (including tumor and healthy regions) with Ktrans as an input 3-5.$$-\kappa_{H}\triangledown^{2}p_{i}=\left[\frac{K^{trans}}{K_{m}^{trans}}\right]\frac{L_{po}S}{V}\left[p_{v}-p_{i}-\sigma_{T}\left(\pi_{v}-\pi_{i}\right)\right]-\frac{L_{pl}S_{L}}{V}\left (p_{i}-p_{L}\right)\,\,\mathbf{and}\,\,\,u_{i}=-\kappa_{H}\triangledown p_{i}\,\,\,\,\,\,\,\,\,\,\,\,(1)$$
where, $$$K^{_{m}^{trans}}$$$ is the mean tumor value, pi is interstitial fluid pressure, ui = interstitial fluid velocity, $$$\kappa_{H}$$$ is hydraulic conductivity, Lpo is vessel permeability, S/V is microvascular surface area per unit volume, σT is average osmotic reflection coefficient for plasma, πi is osmotic pressure in interstitial space, πv is osmotic pressure in microvasculature, pL is lymphatic pressure, pv is microvascular pressure, and LplSL/V is lymphatic filtration coefficient. The nominal parameters of Eq (1) for tumor and healthy region are assumed from literature 3-5. Solving Eq (1) in the 3D domain with (a) no flux or pressure gradient condition external to the normal domain and (b) continuous pressure and flow rate condition at the interface between the tumor and the normal tissue led to pi (IFP) and ui (IFV) maps. Finally, volume averages of the Ktrans, IFP and IFV were extracted over each lesion for statistical comparison (Fig. 1). Ktrans, IFP and IFV values between the pathologic complete response (pCR) and no-pCR subgroups were compared using the non-parametric Kruskal–Wallis test.
RESULTS
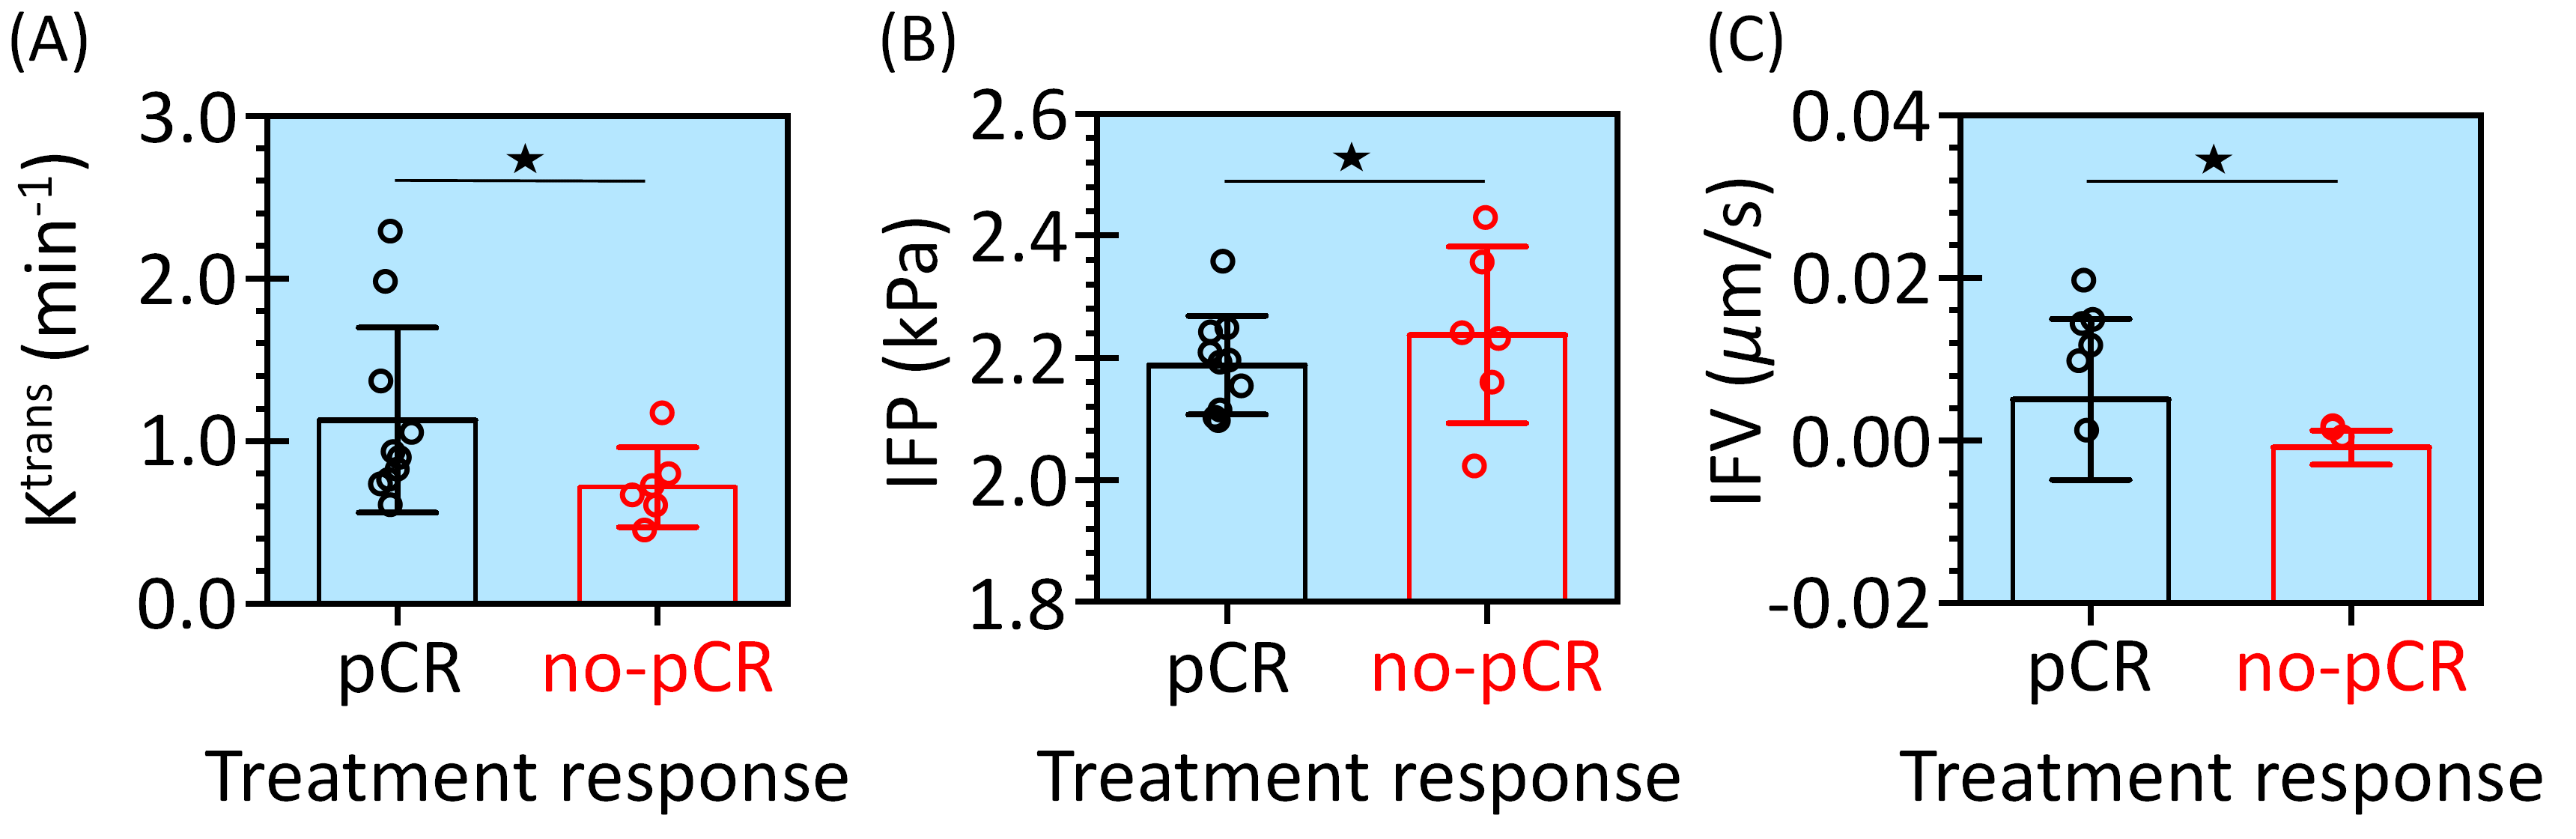
We successfully generated Ktrans, IFP and IFV maps for all 15 patients. Of these, 6 patients had no-pCR and 9 patients had pCR. We observed a higher inter-subject mean value of tumor IFP for no-pCR group compared to the pCR group. Conversely, we observed higher values for tumor Ktrans and IFV in the pCR group compared to the no-pCR group (Fig. 2). However, this difference was not significant (p > 0.05) due to small population size.DISCUSSION
We presented a study to non-invasively map IFP and IFV on breast MR images in patients with recently diagnosed cancer. Although our small dataset precluded statistically significant results, we observed a trend towards higher IFP and lower IFV in the no-PCR subgroup. This makes physiological sense since high IFP and low IFV may hinder the transport of chemotherapy agents to the tumor, thereby mitigating their therapeutic effect. More work is needed with larger sample sizes to determine if IFP and IFV may serve as valuable biomarkers of treatment response and tumor aggression.CONCLUSION
Our non-invasive pharmacokinetic and flow modeling of breast MRI quantifies tumor IFP and IFV and could serve as a tool for prediction of early treatment response and tumor aggressiveness.Acknowledgements
This study is supported in part through the NIH/NCI Cancer Center Support Grant P30 CA008748.References
- Hompland, T, Ellingsen, C, Øvrebø, KM, et al. Interstitial fluid pressure and associated lymph node metastasis revealed in tumors by dynamic contrast-enhanced MRI. Cancer Res. 2012; 72 (19): 4899-4908.
- Tofts, PS, Brix, G, Buckley, DL, et al. Estimating kinetic parameters from dynamic contrast‐enhanced T1‐weighted MRI of a diffusable tracer: standardized quantities and symbols. Journal of Magnetic Resonance Imaging. 1999; 10 (3): 223-232.
- Jain, RK, Baxter, LT. Mechanisms of heterogeneous distribution of monoclonal antibodies and other macromolecules in tumors: significance of elevated interstitial pressure. Cancer Research. 1988; 48 (24): 7022-7032.
- Soltani, M, Chen, P. Numerical modeling of fluid flow in solid tumors. PloS one. 2011; 6 (6): e20344.
- LoCastro, E, Paudyal, R, Mazaheri, Y, et al. Computational modeling of interstitial fluid pressure and velocity in head and neck cancer based on dynamic contrast-enhanced magnetic resonance imaging: feasibility analysis. Tomography. 2020; 6 (2): 129-138.
Figures