1475
Quantitative Breast Background Parenchymal Enhancement: Improved Effect Size when Expressed as Contrast Agent Concentration1Radiology, New York University Grossman School of Medicine, New York, NY, United States, 2Neurology, New York University Grossman School of Medicine, New York, NY, United States, 3Radiology, Weil Cornell Medicine, New York, NY, United States
Synopsis
Keywords: Software Tools, Breast, background parenchymal enhancement
Motivation: Background parenchymal enhancement (BPE) is linked to cancer treatment outcomes. Unfortunately field strength, acquisition parameters, etc, influence BPE. More reliable methodology is needed.
Goal(s): We tested a novel BPE measure as contrast concentration to differentiate patient groups. Test1: pathologically complete response after neo-adjuvant therapy vs incomplete response. Test 2: pre- vs post-menopause.
Approach: From a large public imaging archive we randomly selected 32 exams each for Tests 1-2 to compare effect sizes for signal and concentration-based BPE.
Results: For both tests, group effects measured using Cohen-d were 2X larger for concentration-based BPE. BPE robustness is improved by converting MR signal to contrast concentration
Impact: Background parenchymal enhancement (BPE) is linked to cancer treatment outcomes. Unfortunately field strength, acquisition parameters, etc, influence conventionally acquired BPE. We propose and validate, using two independent datasets, a more reliable BPE methodology based on quantitative measurement of contrast concentration.
Introduction
Breast fibroglandular tissue (FGT) enhances at variable rates, leading to an important clinical measure termed background parenchymal enhancement (BPE). High BPE is linked to greater breast cancer risk and inferior treatment outcomes. Radiologist agreement for BPE qualitative evaluation is moderate1. A more reliable measure is based on quantitative workflows that include segmenting FGT and measuring signal differences or signal ratios between post- and pre-injection images. These methods were recently reviewed2, 3, concluding that a wide variability exists in the quantitative evaluation of BPE and more reliable and comparable methodology is needed. Harmonization can be potentially achieved by converting the change in FGT signal intensity to contrast concentration. We test this hypothesis on two previously reported4,5 clinical and physiological group effects: (1) response to neo-adjuvant chemotherapy; and (2) pre- vs post-menopause.Methods
From NIH TCIA breast cancer MRI dataset (https://nbia.cancerimagingarchive.net, N=922), two stratified subsets of 32 DCE-MRI exams each were randomly selected for two validation studies.PCR Study: included patients with pathologically complete response (PCR) to neo-adjuvant chemotherapy (n=16) compared to incomplete responders (n=16). Each group of 16 was further balanced (50%-50%) on menopausal status.
Menopause Study: included 16 post- vs 16 pre-menopausal patients, regardless of response to therapy.
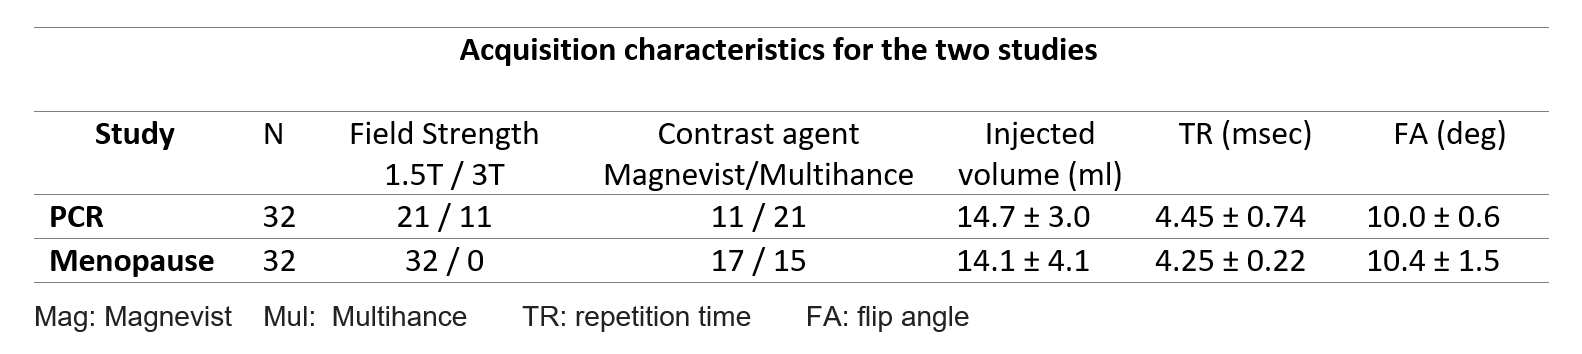
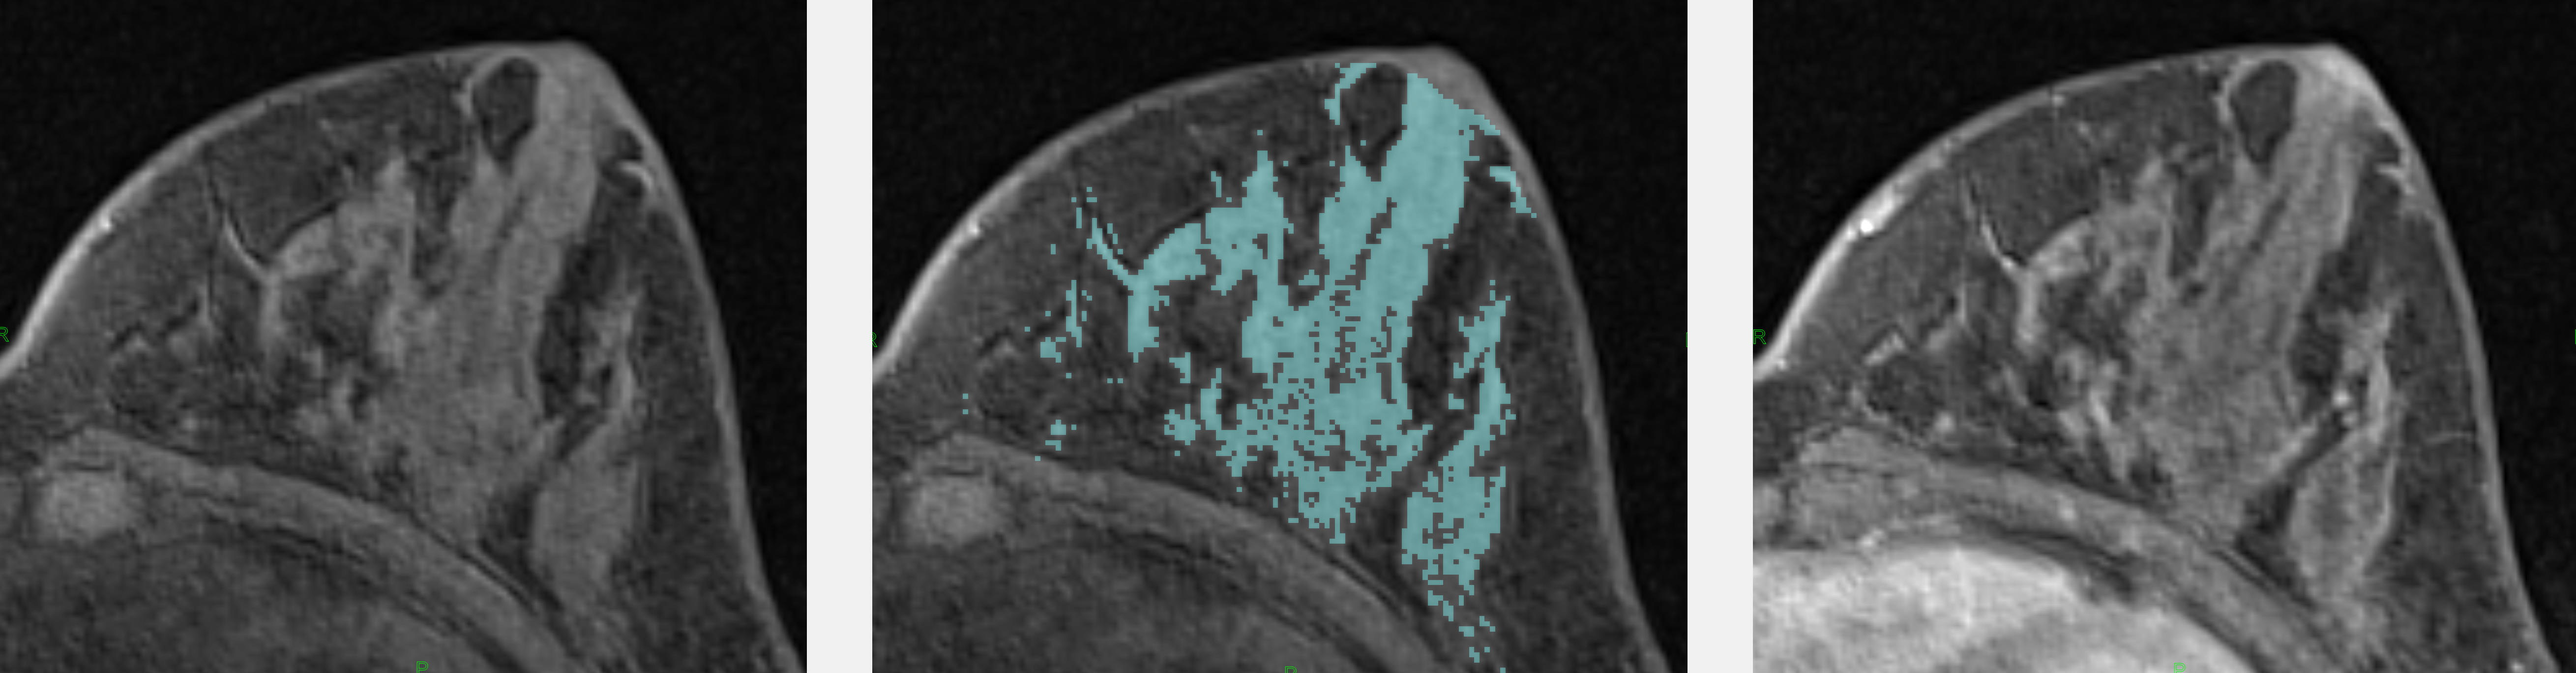
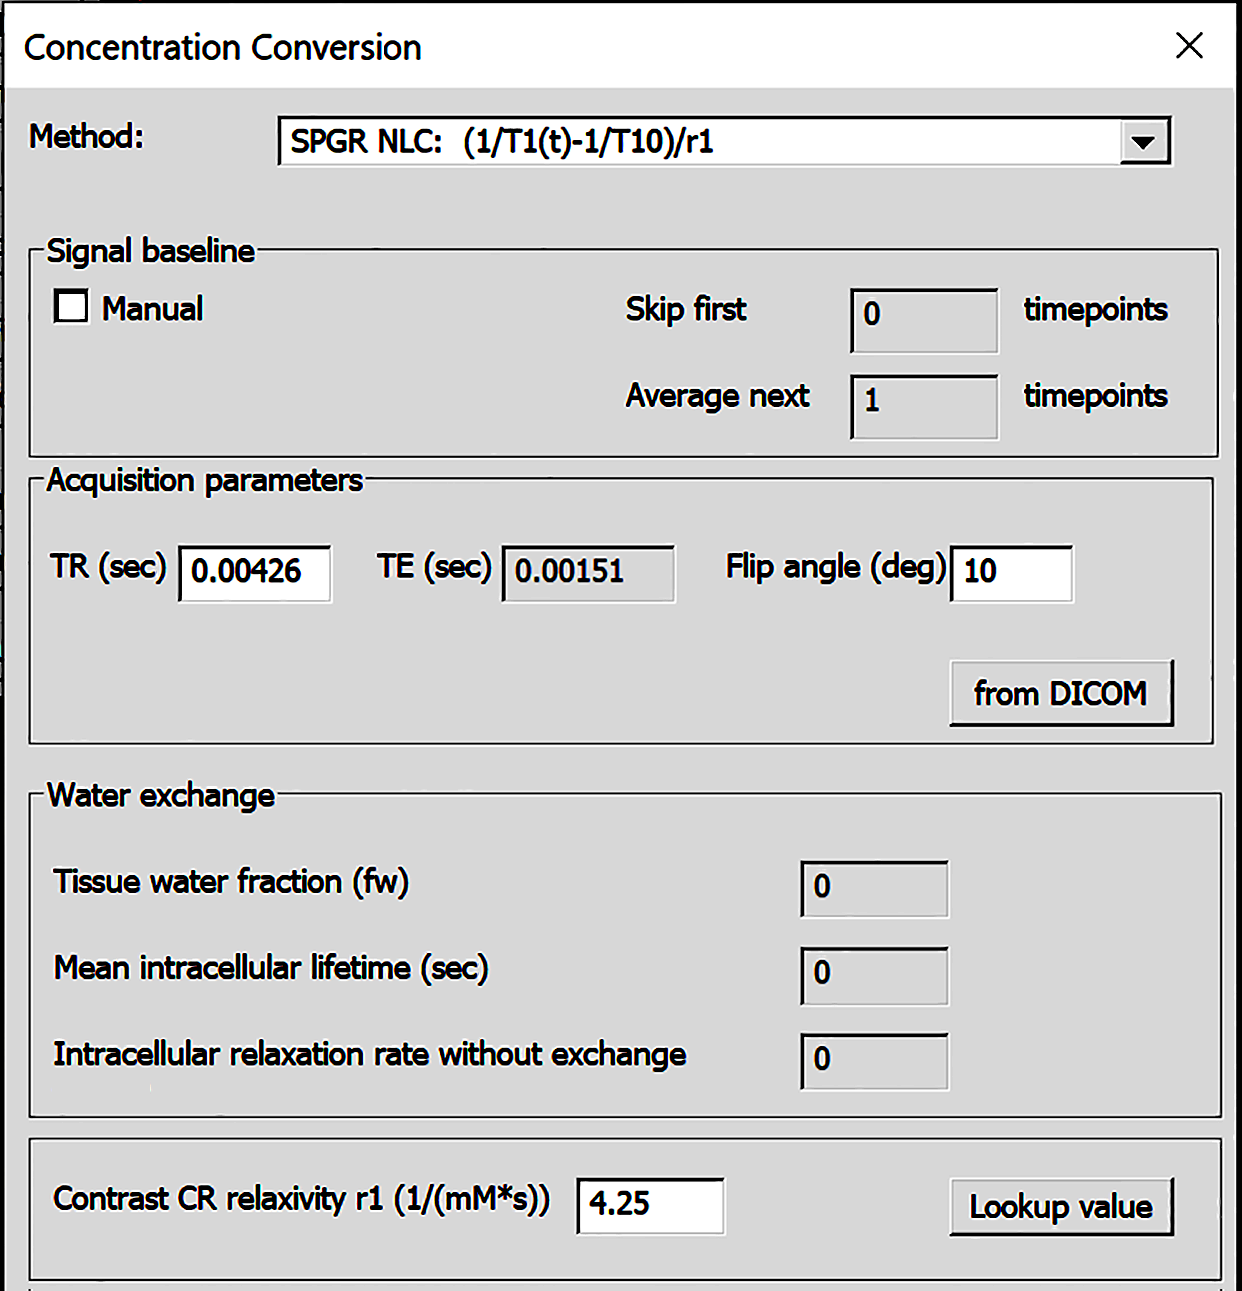
For both studies fat-suppressed, T1-weighted contrast-enhanced images of the contralateral breast were analyzed. MRIs were acquired on a variety of 1.5T or 3T systems and used variable protocols (Fig.1). Whole breast was segmented by excluding skin and nipple, then a bi-Gaussian decomposition provided FGT masks (Fig.2). Conventional signal enhancement BPE was computed as (S1-S0)/S0, from pre-contrast and 90 s post-contrast signal (S0 and S1 respectively). Concentration-based BPE* was derived from nonlinear conversion of signal to concentration of contrast agent using fast exchange limit6-8 . The equation includes specific relaxivity, pre-contrast T1-relaxation of FGT tissue (assumed to be 1136 ms at 1.5T and 1324 ms at 3T), and the parameters (TR, TE, FA) of specific sequence used to acquire breast MRI (Fig.3). Voxel-wise enhancement was then averaged over segmented FGT. Mean enhancement was tested for group effect size using Cohen-d statistic, separately for BPE and BPE*.
Results
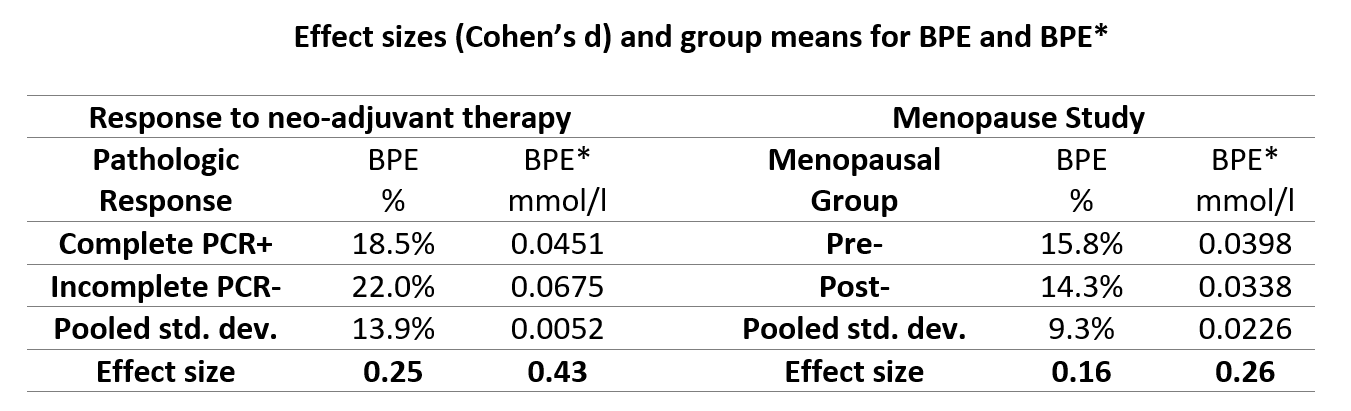
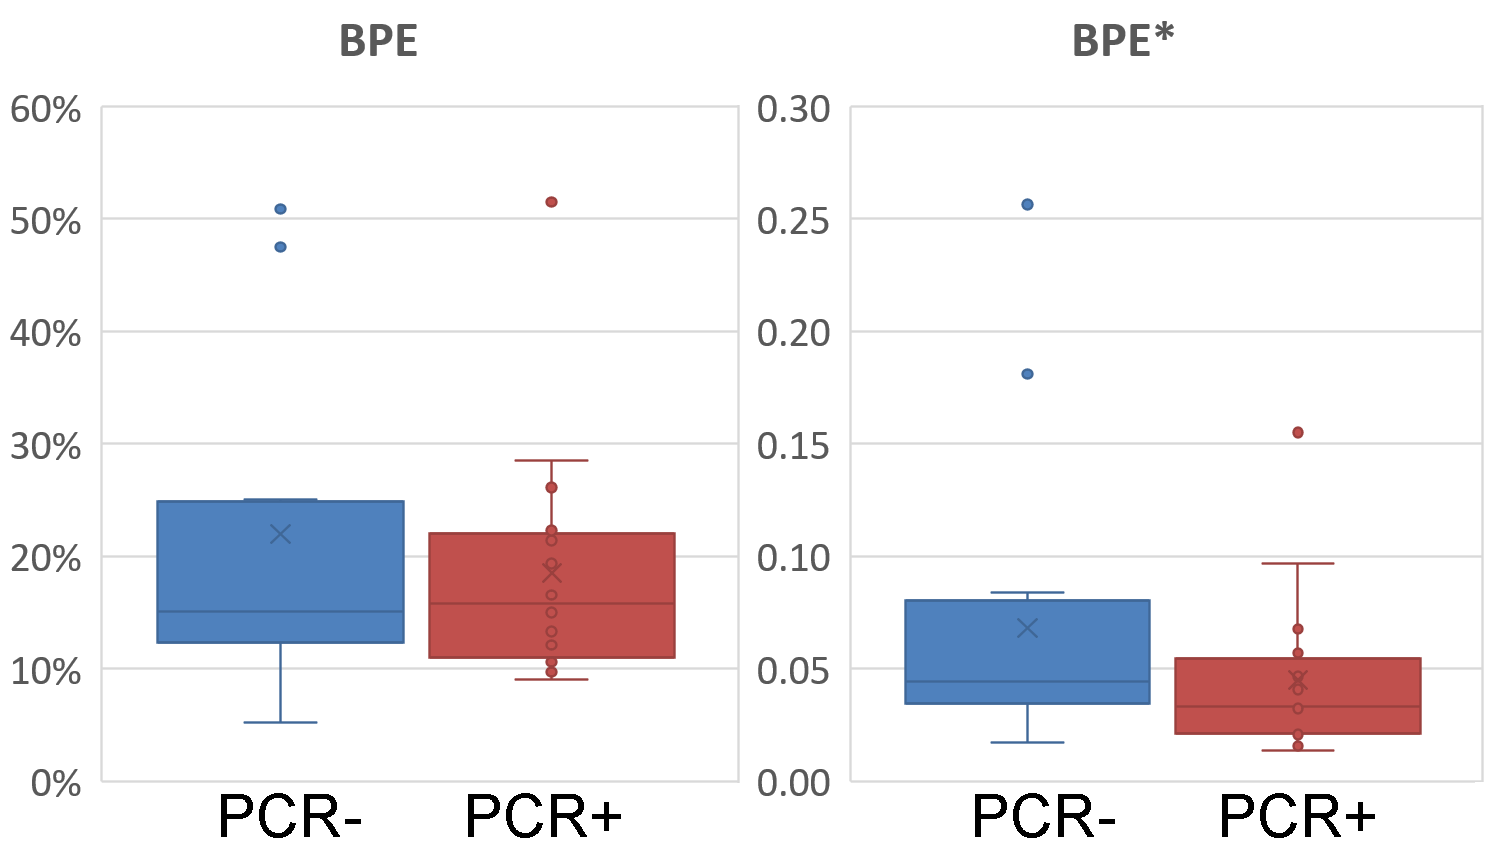
Out of 268 patients undergoing neo-adjuvant therapy, 62 (23%) showed pathologically complete response. For both the PCR and pre-post menopause studies, the group effect sizes were larger for concentration-based BPE* than signal-based BPE. For PCR study the effect size improved from 0.25 to 0.43, or over 70% improvement. A similar improvement was achieved for menopause effect study. Figures 4 and 5 demonstrate superior group separation when using BPE*.Discussion and Conclusions
The differences in field strength, contrast agents and MRI acquisition parameters influence BPE computed as the signal ratio. While standardized breast DCE-MRI acquisition guidelines are helpful in assuring harmonization, we demonstrated that using concentration-based enhancement BPE* in mmol/L improves effect size even when images are acquired at variable settings. Effect size is important for evaluating how efficiently the clinical outcome can be predicted from enhancement measure.Concentration-based approach (measuring enhancement in mmol/L) provides a better distinction of patient groups. The new approach also improves harmonization, making it feasible to pool BPE* results across multisite studies with variable DCE-MRI protocols.
Acknowledgements
This work was supported in part by the NIH/NIBIB U24 EB028980, and was performed under the rubric of the Center for Advanced Imaging Innovation and Research (CAI2R, www.cai2r.net), an NIBIB National Center for Biomedical Imaging and Bioengineering (NIH P41 EB017183).References
1. Pujara AC, Mikheev A, Rusinek H, Gao Y, Chhor C, Pysarenko K, Rallapalli H, Walczyk J, Moccaldi M, Babb JS, Melsaether AN. Comparison between qualitative and quantitative assessment of background parenchymal enhancement on breast MRI. J Magn Reson Imaging. 2018 Jun;47(6):1685-1691. PMID: 29140576.
2. Bignotti B, Calabrese M, Signori A, Tosto S, Valdora F, Tagliafico A, Durando M, Mariscotti G. Background parenchymal enhancement assessment: Inter- and intra-rater reliability across breast MRI sequences. Eur J Radiol. 2019;114:57-61. PMID: 31005177.
3. Liao GJ, Henze Bancroft LC, Strigel RM, Chitalia RD, Kontos D, Moy L, Partridge SC, Rahbar H. Background parenchymal enhancement on breast MRI: A comprehensive review. J Magn Reson Imaging. 2020;51(1):43-61. PMID: 31004391; PMCID: PMC7207072.
4. Karimi Z, Phillips J, Slanetz P, Lotfi P, Dialani V, Karimova J, Mehta T. Factors associated with background parenchymal enhancement on contrast-enhanced mammography. AJR Am J Roentgenol. 2021;216(2):340-348. PMID: 32755162.
5. Amarosa A, McKellop J, Leite APK, Moccaldi M, Clendenen T, Babb J, Zeleniuch-Jacquotte A, Moy L, Kim S, Evaluation of the kinetic properties of background parenchymal enhancement throughout the phases of the menstrual cycle. Radiology 2013; 268(2):356-365.
6. Pujara AC, Mikheev A, Rusinek H, Rallapalli H, Walczyk J, Gao Y, Chhor C, Pysarenko K, Babb JS, Melsaether AN. Clinical applicability and relevance of fibroglandular tissue segmentation on routine T1 weighted breast MRI. Clin Imaging. 2017 Mar-Apr;42:119-125. PMID: 27951458.
7. Wake N, Chandarana H, Rusinek H, Fujimoto K, Moy L, Sodickson DK, Kim SG. Accuracy and precision of quantitative DCE-MRI parameters: How should one estimate contrast concentration? Magn Reson Imaging. 2018 Oct;52:16-23. PMID: 29777820; PMCID: PMC6102067.
8. Rakow-Penner R, Daniel B, Yu H, Sawyer-Glover A, Glover GH. Relaxation times of breast tissue at 1.5T and 3T measured using IDEAL. J Magn Reson Imaging. 2006 Jan;23(1):87-91. PMID: 16315211.
Figures