1474
The relationship of intracellular sodium fraction and pharmacokinetics in breast cancer1Radiology, University of Cambridge, Cambridge, United Kingdom, 2Mohn Medical Imaging and Visualization Centre (MMIV), Haukeland University Hospital, Bergen, Norway, 3Institute of Sport, Department of Sport and Exercise Science, Manchester Metropolitan University, Manchester, United Kingdom, 4Biology, University of York, York, United Kingdom, 5York Biomedical Research Institute, University of York, York, United Kingdom
Synopsis
Keywords: Breast, Cancer, sodium, breast, inversion recovery, DCE-MRI
Motivation: Breast cancer MRI has high sensitivity but has an unmet need for increased specificity. Sodium MRI has the potential to improve tumor characterisation and thus treatments.
Goal(s): To determine whether there is a relationship between tissue permeability by correlating intracellular sodium fraction with pharmacokinetic parameters.
Approach: Conventional DCE-MRI parameters were acquired as well as intracellular sodium fraction maps (= inversion recovery sodium / total sodium concentration) in 17 breast cancer lesions (grade 1:n=3; grade 2: n=9; grade 3:n=7).
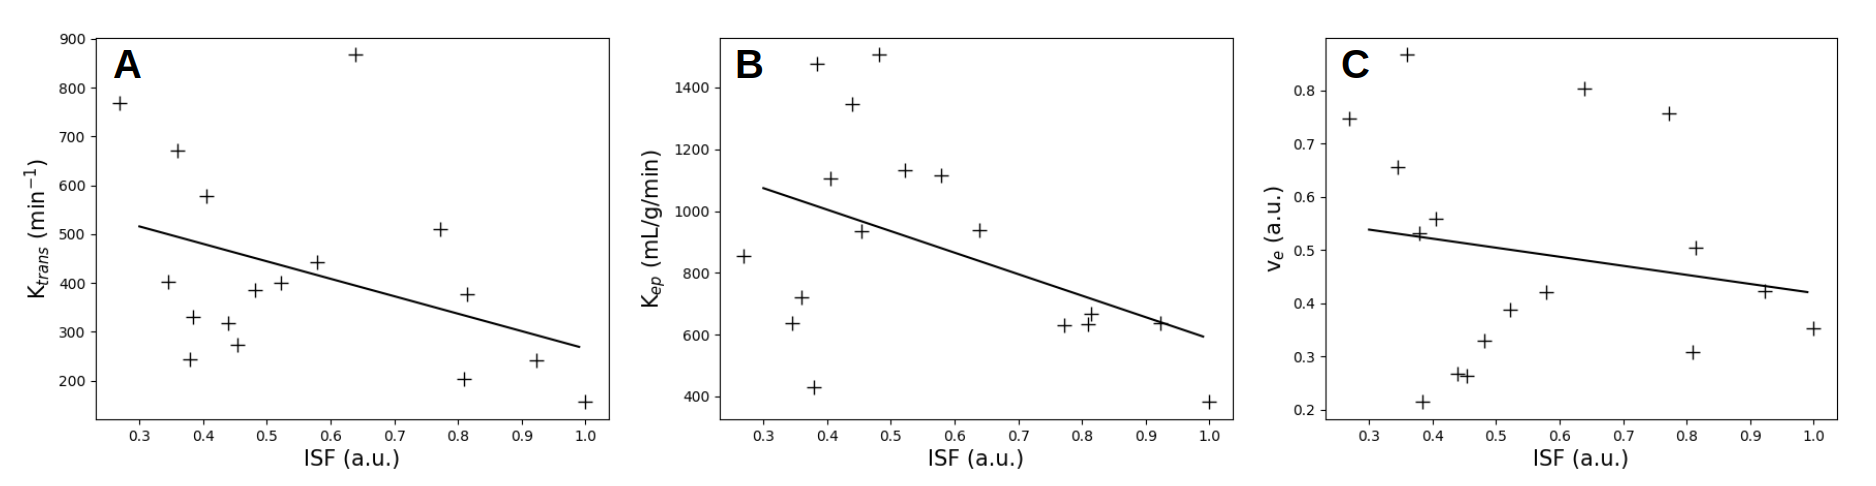
Results: The fraction of intracellular sodium to total sodium concentration had significant correlations (p-values <0.11) with Ktrans and kep, and with cancer grade.
Impact: Breast cancer imaging has an unmet need to differentiate ductal carcinoma from benign and invasive lesions. Sodium MRI can provide intra- and extra-cellular sodium measurements, which may improve lesion differentiation by using endogenous contrast.
Introduction
Dynamic contrast enhanced (DCE) MRI is the gold standard for breast cancer MRI detection, which has a >95% sensitivity to invasive cancer [1]. DCE-MRI is sensitive to the increased tumor vascularity associated with cancer [2], using gadolinium chelates for contrast enhancement. Gadolinium chelates are generally regarded as safe for patients without nephrogenic diseases [3], but may result in long term gadolinium deposition in the bones and brain [4]. Despite its sensitivity, DCE-MRI is insufficient for discerning between ductal carcinoma from benign and invasive lesions and new contrast mechanisms are needed [5].Sodium MRI has the potential to be a specific biomarker for cancer staging, due to their increased intracellular sodium caused by dysfunctional Na+/K+-pumps. Sodium also increases due to higher extracellular fluid associated with inflammation [6-9]. Sodium MRI is also attractive for its ability to monitoring sodium channel altering therapies [10]. Sodium is endogenous and therefore does not require any intravenous injection, making it safer than intravenous gadolinium administration. Furthermore, inversion recovery (IR) pulses can attenuate extracellular sodium signal, providing a method to discriminate intra- and extra-cellular sodium for potentially increasing cancer diagnosis specificity [11].
Methods
Over 30 breast cancer patients were imaged with a sodium and a standard clinical protocol on a 3 T system (MR750, GE Healthcare, Waukesha, WI) using a dual-tuned bilateral 23Na/1H breast coil (4-channel sodium T/R, 16-channel proton receive; Rapid Biomedical, Rimpar, Germany. This preliminary analysis presents data from 17 lesions. Participants were imaged with informed consent and the approval of the local ethics board.23Na-MRI protocol: Sodium MRI was performed using a 3D cones trajectory with TR/TE = 100/0.46 ms, flip angle = 90°, voxel-size = 3x3x6 mm3, field-of-view = 360 mm3, averages = 4, interleaves = 1402, total scan time = 9 m 21 s, which images were considered as the total sodium concentration (TSC). Intracellular-weighted (IW) images were obtained with a fluid-attenuating inversion recovery pulse. The IW acquisition matched the TSC acquisition, but with an inversion pulse using TI = 30 ms, and TR = 250 ms, and averages = 2. Intracellular sodium fraction (ISF) is defined as the IW signal intensity divided by the TSC intensity.
1H-MRI protocol: DCE proton images were acquired using a 3D fast spoiled gradient echo sequence with TR/TE = 7.1/3.8 ms, voxel size = 0.6×0.6×1.4 mm3, field-of-view = 350 mm, flip angle = 12°, encoding factor = 2.5. Pharmacokinetic analysis of the DCE-MRI series was performed in MIStar (Apollo Medical Imaging, Melbourne, Australia) using the extended Tofts’ model [12] to calculate the contrast influx rate constant, Ktrans; efflux-rate constant, kep; extravascular-extracellular volume fraction, ve; and plasma volume fraction, vp.
Analysis: Three-dimensional regions-of-interest (ROIs) were drawn by a radiologist with >4 years experience on the contrast-enhanced images using Osirix DICOM Viewer (v.11.0.4, Pixmeo SARL, Bernex, Switzerland). The ROIs were transposed onto the sodium image after landmark registration was performed by manually selecting >9 matching landmarks on the sodium and DCE images in 3D Slicer [13].
Pearson correlations were used to correlate the relationship between the mean ISF and Ktrans, kep, and ve. A Kruskal-Wallis H-test was performed to compare ISF with cancer grade [14].
Results
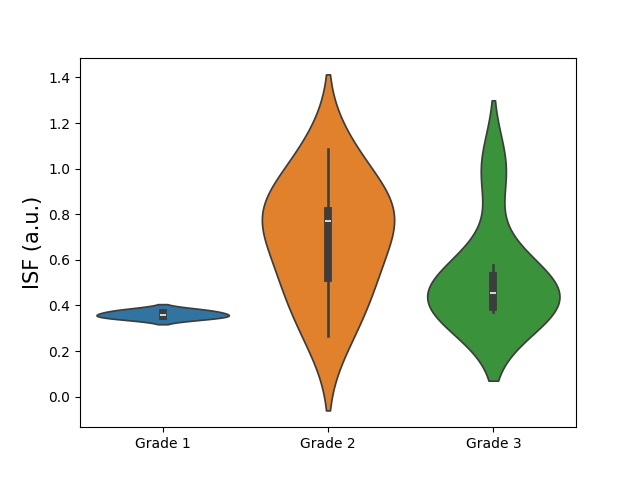
An example DCE image and sodium image are shown in Figure 1. The correlations between ISF and Ktrans, kep, and cancer grades were significant (Figure 2). Mean Ktrans and mean ISF had a Pearson R-value = 0.403, p-value = 0.11; mean kep and mean ISF and had a Pearson R-value = 0.456, p-value = 0.07. ISF population means for grades = 1, 2, and 3 (n=3,9,7) were 0.361±0.014, 0.697±0.240, and 0.529±0.215, respectively, and are shown in Figure 3. The Kruskal-Wallis H-test revealed a significant difference between ISF and cancer grades with chi-2(2) = 6.3 and p = 0.43, and mean rank scores of 3.33, 12.67, and 9.43, respectively.Discussion
We have shown an inverse correlation between ISF and Ktrans, kep. A high Ktrans and kep indicates a high tissue permeability, which is suggestive of malignant tumors. Low ISF also appears to indicate high tissue permeabilities, which would be caused by increased extracellular fluid and correlating high extracellular sodium. The mean ISF was lower in grade 3 lesions than grade 2 lesions; this lower intracellular sodium is an unanticipated but clear result. Grade 1 lesions had a much lower ISF than grades 2 and 3 lesions, which is expected due to their expected lower intracellular sodium.These measurements do not rely on phantom or B1 calibration methods.
Conclusion
Intracellular sodium fraction provides unique molecular information that may be used to differentiate tumor grade and indicate lesion permeability.Acknowledgements
We acknowledge support from the Cancer Research UK grant number (A25922), the CRUK Cambridge Centre, and the NIHR Cambridge Biomedical Research Centre (BRC-1215-20014). The views expressed are those of the authors and not necessarily those of CRUK, the NIHR or the Department of Health and Social Care.References
[1] Huang W, Fisher PR, Dulaimy K, Tudorica LA, O’Hea B, Button TM (2004) Detection of breast malignancy: diagnostic MR protocol for improved specificity. Radiology 232:585–591
[2] Yankeelov, Thomas E., et al. "Integration of quantitative DCE-MRI and ADC mapping to monitor treatment response in human breast cancer: initial results." Magnetic resonance imaging 25.1 (2007): 1-13.
[3] Thomsen, Henrik S., et al. "Nephrogenic systemic fibrosis and gadolinium-based contrast media: updated ESUR Contrast Medium Safety Committee guidelines." European radiology 23 (2013): 307-318.
[4] Murata, Nozomu, et al. "Gadolinium tissue deposition in brain and bone." Magnetic resonance imaging 34.10 (2016): 1359-1365.
[5] Greenwood, Heather I., et al. "Role of breast MRI in the evaluation and detection of DCIS: opportunities and challenges." Journal of Magnetic Resonance Imaging 52.3 (2020): 697-709.
[6] Ouwerkerk, Ronald, et al. "Elevated tissue sodium concentration in malignant breast lesions detected with non-invasive 23 Na MRI." Breast cancer research and treatment 106 (2007): 151-160.
[7] Rakoff-Nahoum, Seth. "Cancer issue: why cancer and inflammation?." The Yale journal of biology and medicine 79.3-4 (2006): 123.
[8] Müller, Dominik N., et al. "Sodium in the microenvironment regulates immune responses and tissue homeostasis." Nature reviews immunology 19.4 (2019): 243-254.
[9] D.N. Muller, N. Wilck, S. Haase, M. Kleinewietfeld, R.A. LinkerSodium in the microenvironment regulates immune responses and tissue homeostasisNat. Rev. Immunol., 19 (4) (2019), pp. 243
[10] Stenkvist, Bengtsson, et al. "Cardiac glycosides and breast cancer." The Lancet 313.8115 (1979): 563.
[11] Stobbe, Robert, and Christian Beaulieu. "In vivo sodium magnetic resonance imaging of the human brain using soft inversion recovery fluid attenuation." Magnetic Resonance in Medicine: An Official Journal of the International Society for Magnetic Resonance in Medicine 54.5 (2005): 1305-1310.
[12] Tofts, Paul S., et al. "Estimating kinetic parameters from dynamic contrast‐enhanced T1‐weighted MRI of a diffusable tracer: standardized quantities and symbols." Journal of Magnetic Resonance Imaging: An Official Journal of the International Society for Magnetic Resonance in Medicine 10.3 (1999): 223-232.
[13] Pieper, Steve, Michael Halle, and Ron Kikinis. "3D Slicer." 2004 2nd IEEE international symposium on biomedical imaging: nano to macro (IEEE Cat No. 04EX821). IEEE, 2004.
[14] Kikinis R, Pieper SD, Vosburgh K (2014) 3D Slicer: a platform for subject-specific image analysis, visualization, and clinical support. Intraoperative Imaging Image-Guided Therapy, Ferenc A. Jolesz, Editor 3(19):277–289 ISBN: 978-1-4614-7656-6 (Print) 978-1-4614-7657-3 (Online)
Figures
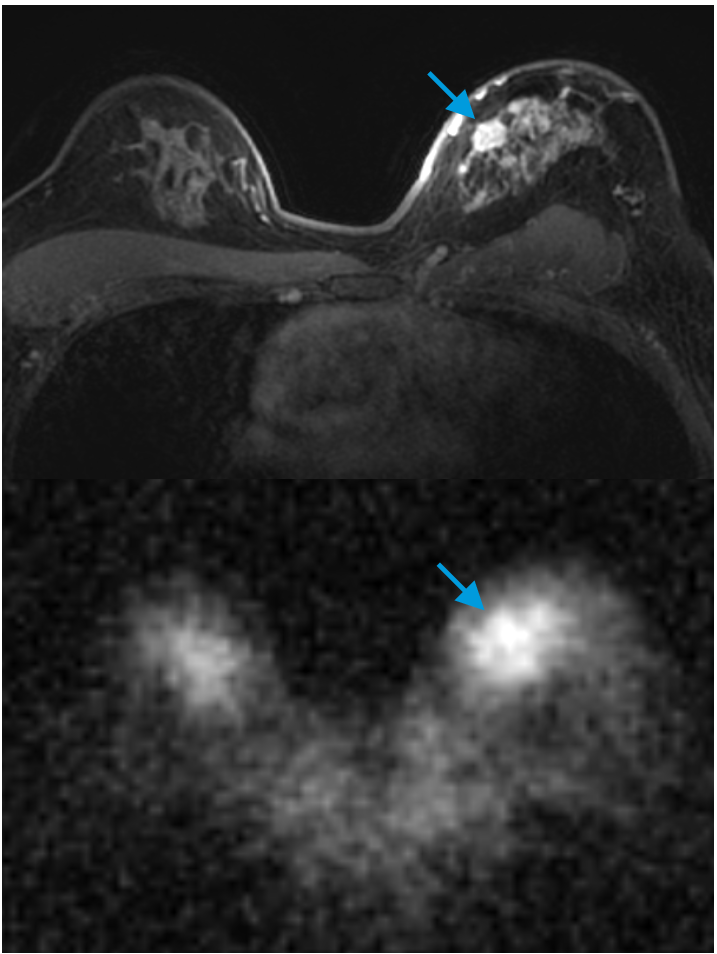
Top: A contrast-enhanced proton MRI is shown, with the lesion indicated by a blue arrow.
Bottom: The same slice showing the total sodium concentration, with the lesion indicated by a blue arrow in the same location.