1473
CEST MR Fingerprinting for In Vivo Bilateral Breast Imaging1Memorial Sloan Kettering Cancer Center, New York, NY, United States
Synopsis
Keywords: Breast, Breast, CEST, CEST-MRF, DRONE
Motivation: To enable quantitative CEST and MT maps in breast tissue for potential tumor characterization.
Goal(s): To explore the feasibility of simultaneously obtaining T1, T2, CEST and MT maps in breast tissue.
Approach: A CEST-MRF pulse sequence was used to measure the amide and semi-solid exchange rate and volume fractions. Quantitative maps were obtained using a neural network trained on physics-derived signals.
Results: The proposed approach yields water T1 and T2 relaxation maps, amide exchange and volume fraction maps, and semi-solid exchange and volume fraction maps in the breast in a scan time of less than 2 minutes.
Impact: Comprehensive quantitative T1, T2, amide CEST and MT bilateral breast imaging in under 2 minutes can improve the detection and characterization of breast cancer and the response to treatment in a clinical setting without the use of a contrast agent.
Introduction
Breast MRI is an increasingly popular method for breast cancer diagnosis. Breast lesions can be difficult to assess with traditional MRI approaches due to the complexity of tissue composition, hence motivating the use of different MRI quantitative methods for tissue characterization [1]. Chemical Exchange Saturation Transfer MRI (CEST) is a molecular imaging technique that utilizes the selective saturation of exchangeable protons to infer tissue parameter like the pH-dependent amide exchange rate. Conventional CEST imaging is only semi-quantitative and suffers from long scan times and technical limitations. CEST MR fingerprinting (CEST-MRF) is a fast and quantitative alternative technique that can provide water relaxation, CEST and MT maps simultaneously [2]. While CEST-MRF has mostly been applied in the brain [2]–[6], its potential for other anatomical sites (e.g. breast) is significant but currently unexplored. Aside from the challenges due to tissue heterogeneity, breast imaging is also complicated by a relatively lower SNR due the simpler (fewer receiver channels) RF coils in comparison to those used in the brain. The aim of this work is to overcome these challenges and demonstrate the feasibility and utility of CEST-MRF for breast imaging.Methods
Data acquisition was performed at 3T (Signa Premier, GE Healthcare, Waukesha, WI) on a healthy female volunteer with informed consent using a 16-channel breast receiver coil. An optimized CEST-MRF pulse sequence was used, and tissue maps were reconstructed using a Deep Reconstruction Network (DRONE) [7]. T1 and T2 relaxation maps, amide exchange and volume fraction maps, and semi-solid exchange and volume fraction maps were simultaneously obtained.1. CEST-MRF Pulse Sequence
The pulse sequence is shown in Figure 1. The magnetization is saturated with a Gaussian-shaped pulse train at the amide resonance frequency (3.5 ppm) [5]. The excited magnetization exchanges with water, and the water signal is read out with an EPI k-space sampling following chemical-shift fat suppression and water excitation. Acquisition parameters included a partial Fourier factor of 6/8, acceleration factor R=2, TE=17ms, matrix size=160×160, FOV=320×320mm2, in-plane resolution 2mm2, and slice thickness=5mm. Saturation pulse train power (B1sat), duration (Tsat), excitation pulse flip angle (FA), and TR were adjusted based on a schedule optimized using the method described in Ref. [4].
2. Tissue Quantification and Network Training
Tissue quantification was performed using a deep reconstruction network (DRONE) [4]. The network was trained on a physics-derived dataset of signal magnetizations generated by sampling 110,000 entries from the tissue parameter ranges listed in Figure 2. A fraction of the data (10%) was used for validation with the remainder used for training. The network was trained for 500 epochs using the ADAM optimizer [9] with a learning rate of 10-4. Gaussian noise (zero mean, 1% SD) was added during training to promote robust learning. A threshold-based T2 mask was applied to remove the signal from the lipid-suppressed voxels. Regions-of-interest (ROI) were manually drawn in the pectoralis muscle and the fibroglandular tissues in each breast to calculate mean ± standard deviation (SD) tissue values.
Results
The acquisition was performed in 1.5 minutes. The quantitative breast tissue maps are shown in Figure 3. Quantification required 1 second. Figure 4 shows the mean ±standard deviation (SD) values for the ROIs drawn.Discussion
Because it is non-invasive and non-ionizing, MRI is increasingly used for breast cancer screening and tumor characterization. Although conventional CEST imaging in the breast has been reported in the literature, the maps obtained were only semi-quantitative and required long scan times at high magnetic field strengths (7T) [8], [9]. Quantitative mapping of T1 and T2 relaxation in breast tissue using MRF has also been reported [10]. The T1 values obtained in this study were similar to those reported in Ref. [10] for the fibroglandular tissue although the T2 was higher which may be due to partial volume effects due to imperfect segmentation. To our knowledge, this work is the first demonstration of quantitative CEST-MRF imaging in the breast.Conclusion
This study demonstrates the feasibility of rapid bilateral CEST-MRF imaging in breast tissue. This can be beneficial for characterization of breast tissue lesions. Future work will focus on validation in a larger cohort, improved segmentation and application in pathological cases.Acknowledgements
This work was supported by NIH/NCI grants P30-CA008748 and R37-CA262662.References
[1] K. Kinkel and N. M. Hylton, “Challenges to interpretation of breast MRI,” Journal of Magnetic Resonance Imaging: An Official Journal of the International Society for Magnetic Resonance in Medicine, vol. 13, no. 6, pp. 821–829, 2001.
[2] O. Cohen, S. Huang, M. T. McMahon, M. S. Rosen, and C. T. Farrar, “Rapid and quantitative chemical exchange saturation transfer (CEST) imaging with magnetic resonance fingerprinting (MRF),” Magnetic resonance in medicine, vol. 80, no. 6, pp. 2449–2463, 2018.
[3] O. Cohen et al., “CEST MR fingerprinting (CEST-MRF) for brain tumor quantification using EPI readout and deep learning reconstruction,” Magnetic Resonance in Medicine, vol. 89, no. 1, pp. 233–249, 2023.
[4] O. Cohen and R. Otazo, “Global Deep Learning Optimization of CEST MR Fingerprinting (CEST-MRF) Acquisition Schedule,” NMR in Biomedicine, p. e4954, 2023.
[5] O. Perlman, K. Herz, M. Zaiss, O. Cohen, M. S. Rosen, and C. T. Farrar, “CEST MR-Fingerprinting: practical considerations and insights for acquisition schedule design and improved reconstruction,” Magnetic resonance in medicine, vol. 83, no. 2, pp. 462–478, 2020.
[6] O. Perlman et al., “Quantitative imaging of apoptosis following oncolytic virotherapy by magnetic resonance fingerprinting aided by deep learning,” Nature biomedical engineering, vol. 6, no. 5, pp. 648–657, 2022.
[7] O. Cohen, B. Zhu, and M. S. Rosen, “MR fingerprinting deep reconstruction network (DRONE),” Magnetic resonance in medicine, vol. 80, no. 3, pp. 885–894, 2018.
[8] L. Loi et al., “Relaxation-compensated CEST (chemical exchange saturation transfer) imaging in breast cancer diagnostics at 7T,” European Journal of Radiology, vol. 129, p. 109068, 2020.
[9] O. Zaric et al., “7T CEST MRI: A potential imaging tool for the assessment of tumor grade and cell proliferation in breast cancer,” Magnetic resonance imaging, vol. 59, pp. 77–87, 2019.
[10] Y. Chen et al., “Three-dimensional MR fingerprinting for quantitative breast imaging,” Radiology, vol. 290, no. 1, pp. 33–40, 2019.
Figures
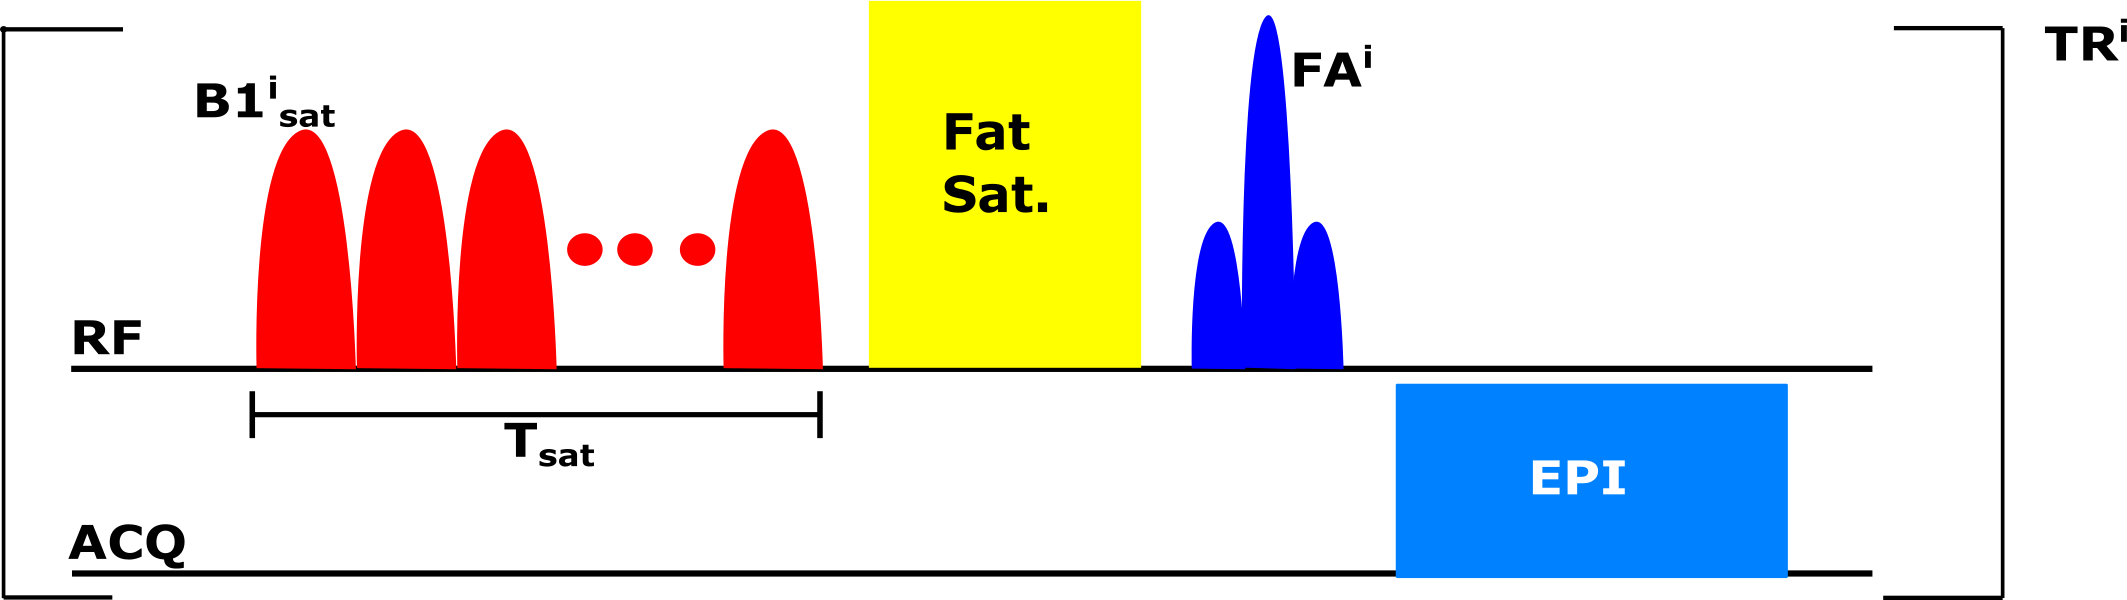
Figure 1: The CEST-MRF pulse sequence. A saturation pulse train saturates the amide protons which then exchange with the water. A chemical shift selective fat saturation module is followed by excitation of the water magnetization and readout with an EPI k-space sampling. All acquisition parameters were set according to the optimized schedule.
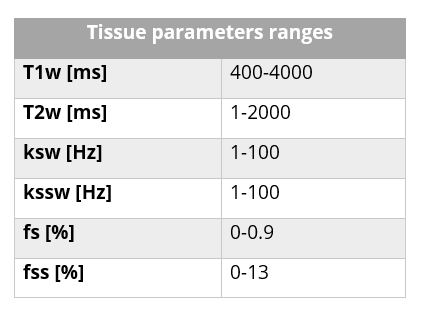
Figure 2: Acquisition and tissue parameter ranges used in the schedule optimization. The tissue parameters are the following: T1w=water T1 relaxation, T2w=water T2 relaxation, ksw=glutamate exchange rate, kssw=semi-solid exchange rate, fs=glutamate volume fraction, fss=semi-solid volume fraction.
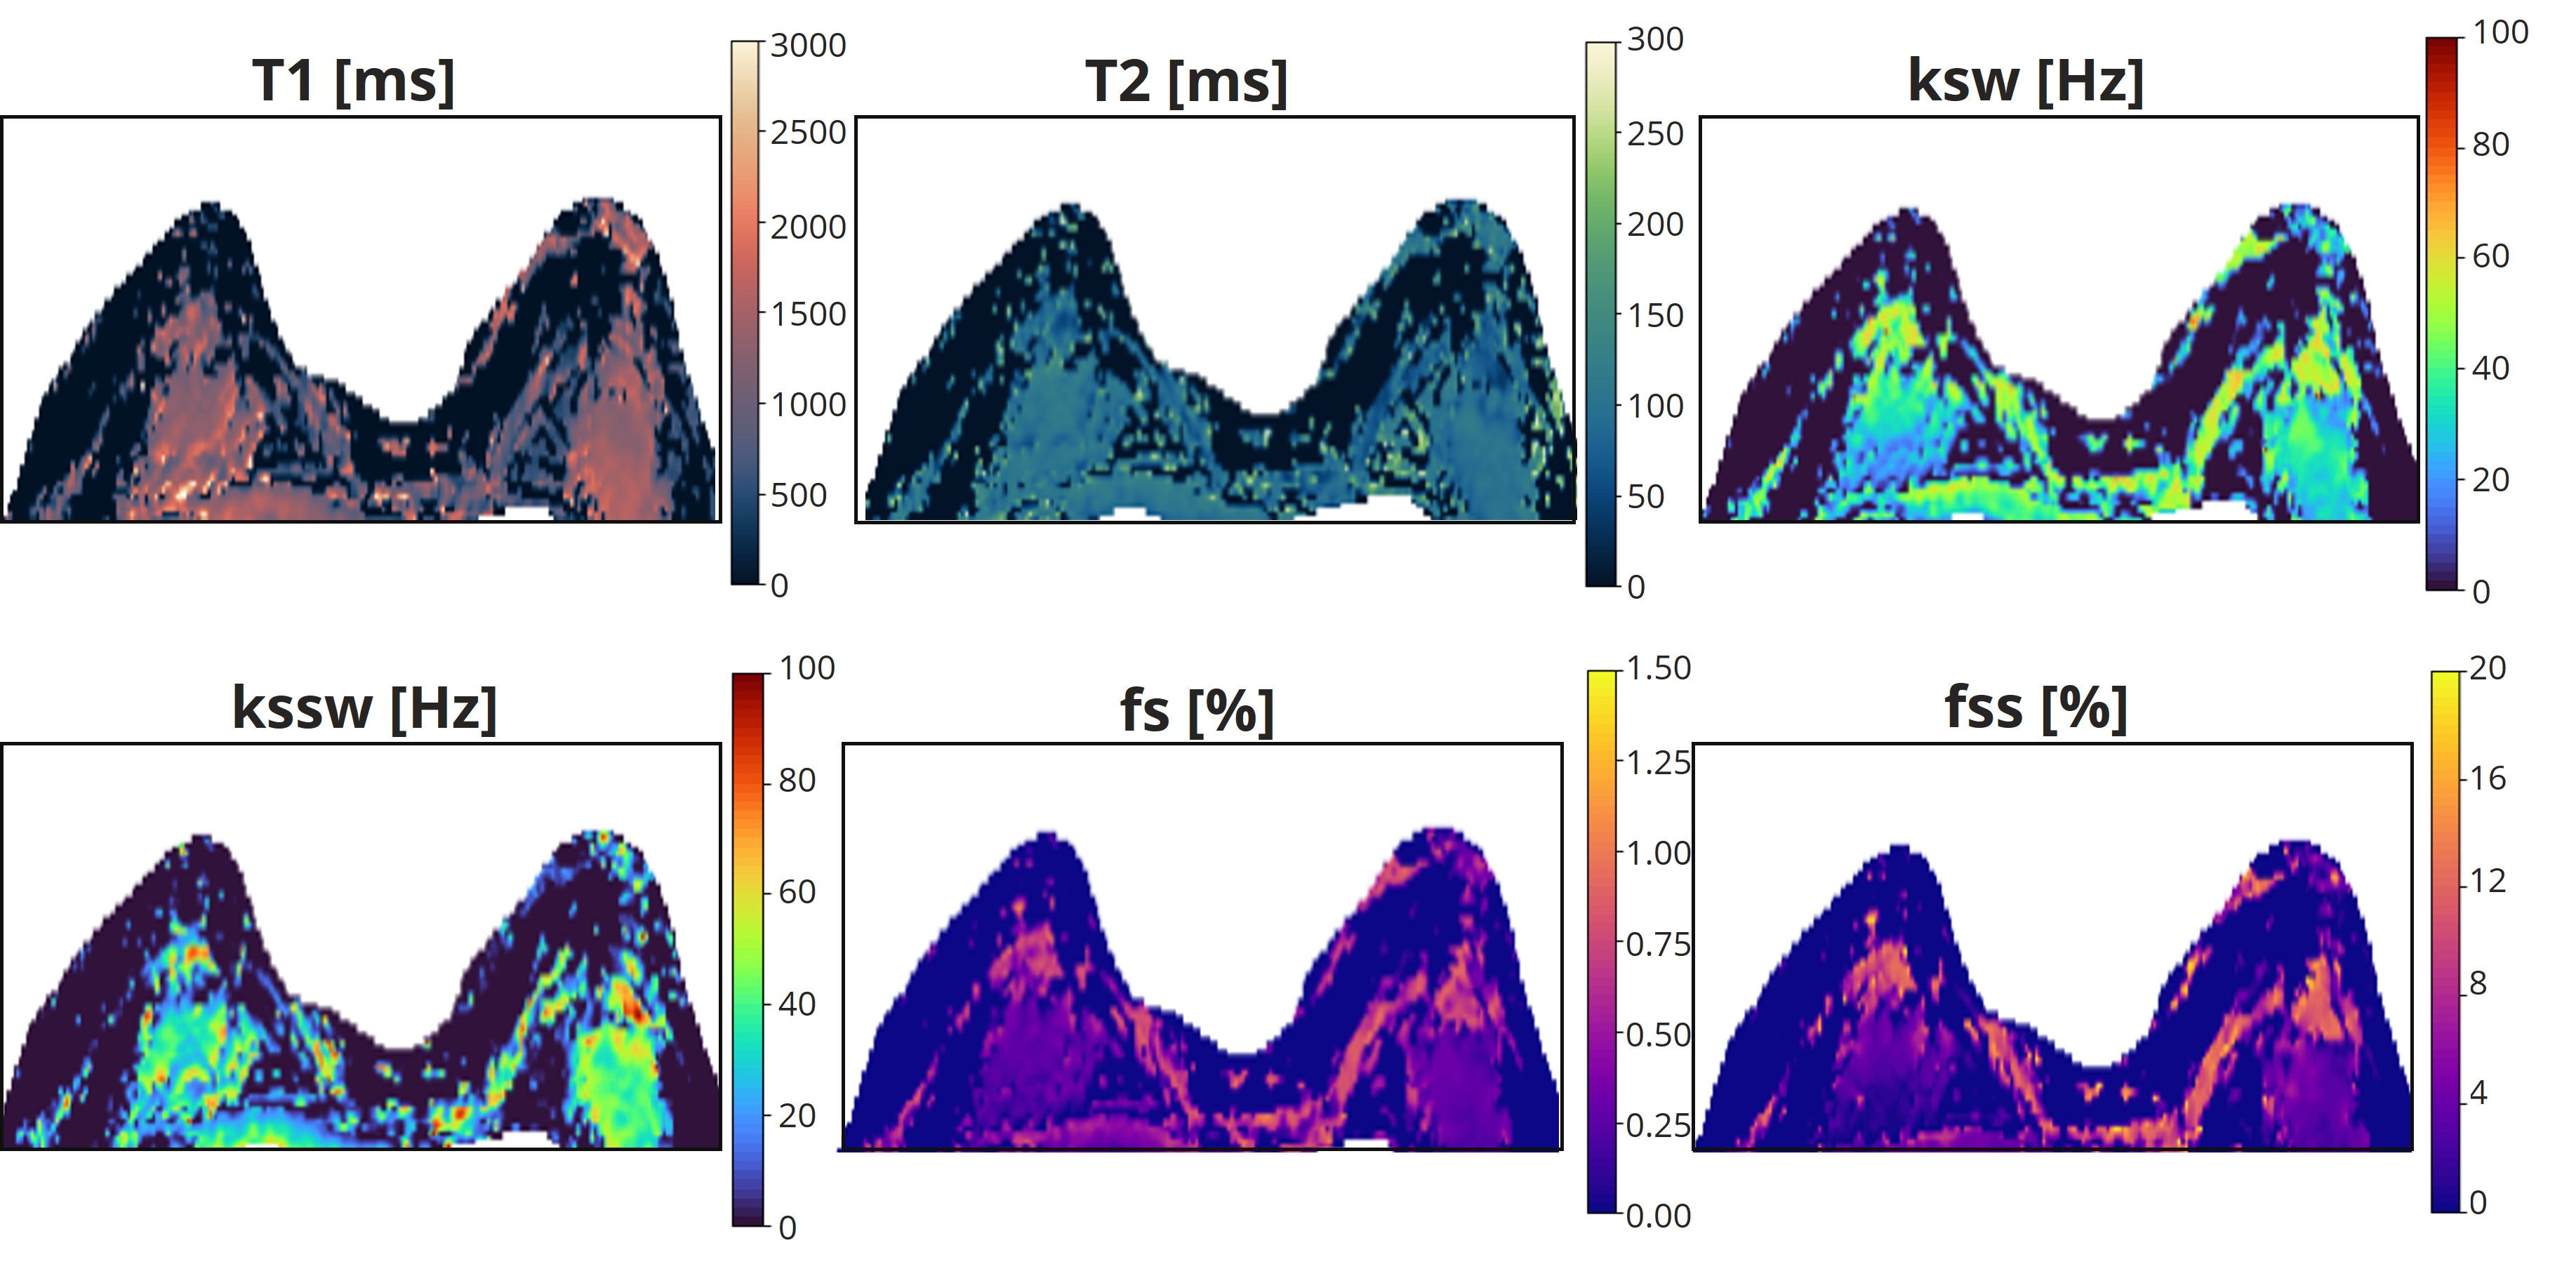
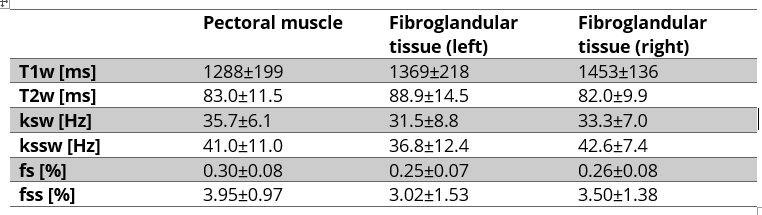
Figure 4: mean ±standard deviation (SD) values calculated within the muscle and fibroglandular ROIs drawn in both breasts.