1469
Differentiation of breast cancer subtypes using amide proton transfer-weighted imaging and DWI: the correlation with biological status1The Affiliated Cancer Hospital of Zhengzhou University & Henan Cancer Hospital, Zhengzhou, China, 2Philips healthcare, Beijing, China
Synopsis
Keywords: fMRI Analysis, Breast, Cancer
Motivation: APTWI and DWI had still some controversies between their parameters and some biological status.
Goal(s): To assess the value of amide proton transfer-weighted imaging (APTWI) and diffusion weighted imaging (DWI) in differentiating biological subtypes and predicting the biological status of breast tumors.
Approach: The Kruskal-Wallis H test and Post-hoc pairwise comparison, Pearson's correlation analysis. Independent samples t-test. Receiver operating characteristic (ROC) analysis.
Results: MTRasym (3.5 ppm) was higher in breast tumours that were TN, ER-, PR-, and high-Ki-67. Compared to DWI, APTWI is more useful in predicting the biological status of breast cancers.
Impact: Compared to DWI, APTWI is more useful in predicting the biological status of breast cancers.
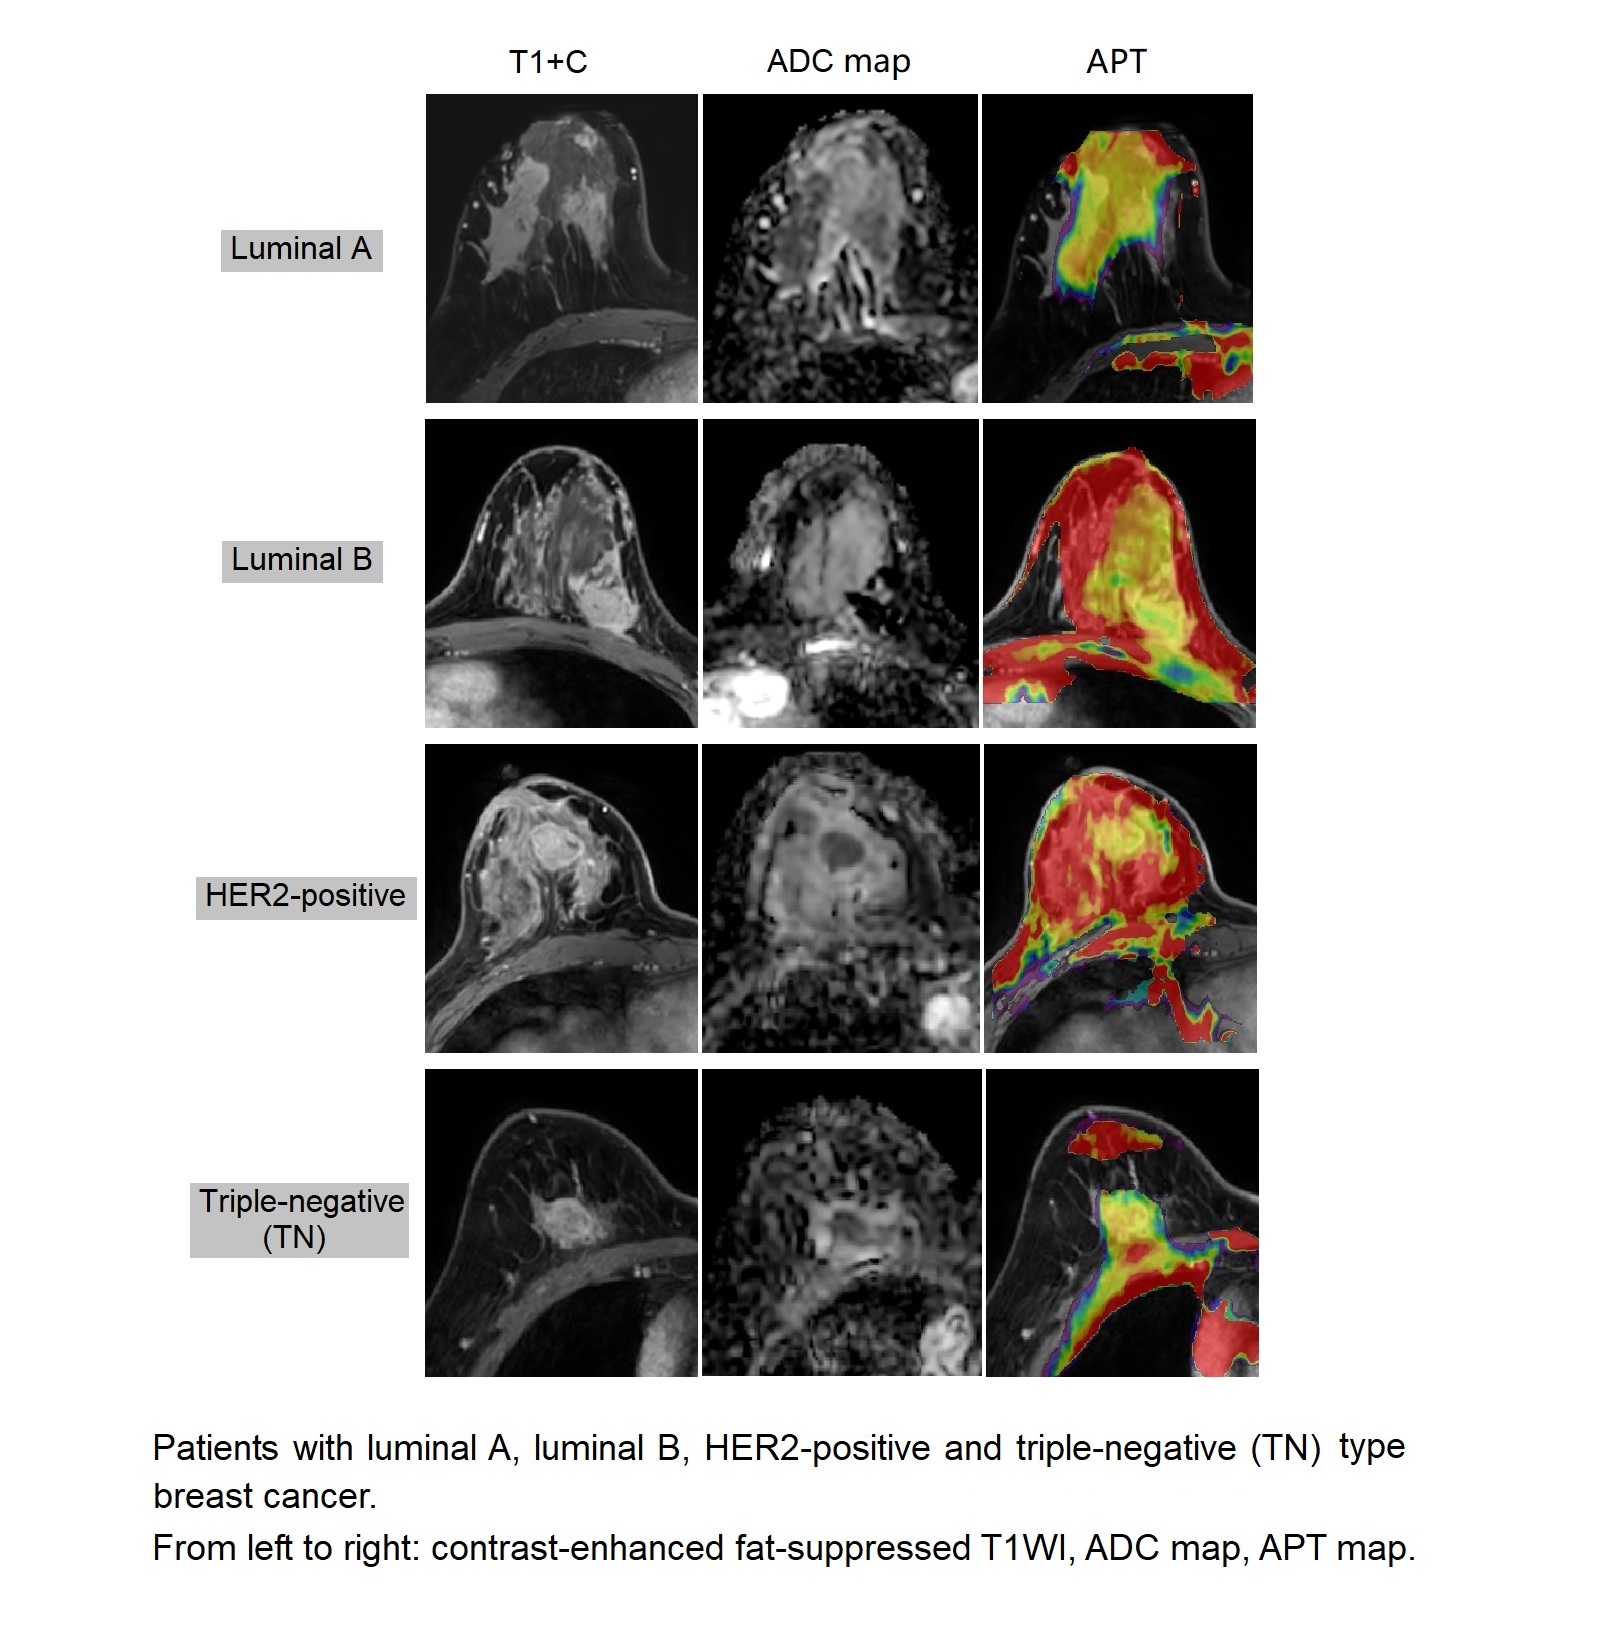
Method: This study included ninety patients (mean age of 50.8 years; range of 30–76 years) with histopathologically confirmed invasive ductal carcinomas of no less than 2 cm in diameter. The patients were further divided into four biological subtypes: luminal A (n = 17), luminal B (n = 53), HER2-enriched (n = 17) and the triple-negative (TN) (n = 22) subtype. On a 3T MR scanner (Ingenia CX, Philips Healthcare), 3D APTWI and DWI were performed within one week before to surgery or biopsy. The magnetization transfer ratio asymmetry [MTRasym (3.5 ppm)] and ADC values in lesion were measured by two experienced radiologists. Intra-class correlation coefficient (ICC) was used to assess inter-observer agreement. The Kruskal-Wallis H test and Post-hoc pairwise comparison was used to compare the differences among the MR parameters in the four biological subtypes. The relationship between MTRasym (3.5 ppm) and ADC values and the Ki-67 proliferation index was investigated using Pearson's correlation analysis. In addition, patients were also divided into different subtypes based on ER, PR, HER-2, HG, lymph node metastasis, and Ki-67 expression [low-Ki-67(< 30%) and high-Ki-67(≥ 30%)]. Independent samples t-test was used to compare statistical difference in MTRasym (3.5 ppm) and ADC values among every groups. Receiver operating characteristic (ROC) analysis was also conducted with respective area under the curve (AUC) calculated.
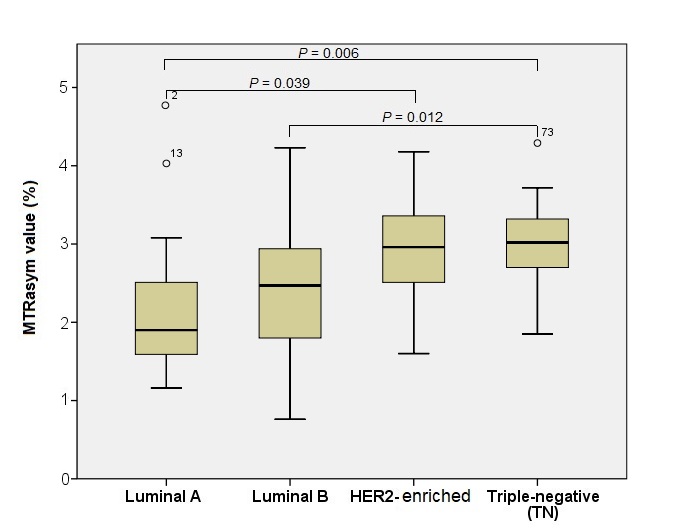
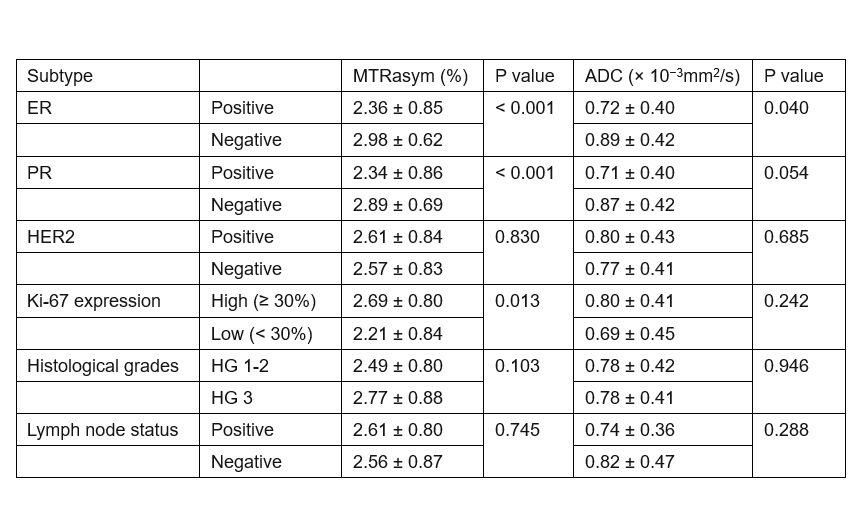
Results: MTRasym (3.5 ppm) and ADC readings showed high inter-observer agreements (ICC = 0.867, 0.892). There were significant differences (P = 0.001) in the MTRasym (3.5 ppm) values in the four biological subtypes. The TN cancers (3.03 ± 0.56%) showed significantly higher MTRasym (3.5 ppm) than the luminal A cancers (2.25 ± 1.00%) and the luminal B cancers (2.39 ± 0.81%) (adjusted P = 0.006, 0.012), and the HER2-enriched (2.93 ± 0.71%) showed significantly higher MTRasym (3.5 ppm) than the luminal A cancers (2.25 ± 1.00%) (adjusted P = 0.039). MTRasym (3.5 ppm) and ADC values had weakly positive correlation with the Ki-67 proliferation index (r = 0.37, P < 0.001, and r = 0.31, P = 0.003). The MTRasym (3.5 ppm) values were significantly higher for ER- and PR- than positive of them (2.98 ± 0.62% vs. 2.36 ± 0.85%, 2.89 ± 0.69% vs. 2.34 ± 0.86%, all P < 0.001), and the MTRasym (3.5 ppm) values were significantly higher for high-Ki-67 than low-Ki-67 cancers (2.69 ± 0.80% vs. 2.21 ± 0.84%, P = 0.013), but no significant difference was found in ADC values between groups. There was no significant difference in the MTRasym (3.5 ppm) and ADC values between different HER2 expression, HG and lymph node status of breast cancers. The AUCs of MTRasym (3.5 ppm) values in differentiating the luminal A and HER2-enriched, luminal A and TN, luminal B and TN, ER+/-, PR+/-, high- and low-Ki-67 cancers were 0.753, 0.801, 0.732, 0.731, 0.710, 0.699, respectively.
Conclusion: MTRasym (3.5 ppm) was higher in breast tumours that were TN, ER-, PR-, and high-Ki-67. Compared to DWI, APTWI is more useful in predicting the biological status of breast cancers.
Acknowledgements
No acknowledgement found.References
1. Iima M, Kataoka M, Kanao S, Onishi N, Kawai M, Ohashi A, Sakaguchi R, Toi M, Togashi K: Intravoxel Incoherent Motion and Quantitative Non-Gaussian Diffusion MR Imaging: Evaluation of the Diagnostic and Prognostic Value of Several Markers of Malignant and Benign Breast Lesions. Radiology 2018, 287(2):432-441.
2. Goldhirsch A, Wood WC, Coates AS, Gelber RD, Thürlimann B, Senn HJ: Strategies for subtypes--dealing with the diversity of breast cancer: highlights of the St. Gallen International Expert Consensus on the Primary Therapy of Early Breast Cancer 2011. Annals of oncology : official journal of the European Society for Medical Oncology 2011, 22(8):1736-1747.
3. Li Y, Chen J, Yang Z, Fan C, Qin Y, Tang C, Yin T, Ai T, Xia L: Contrasts Between Diffusion-Weighted Imaging and Dynamic Contrast-Enhanced MR in Diagnosing Malignancies of Breast Nonmass Enhancement Lesions Based on Morphologic Assessment. Journal of magnetic resonance imaging : JMRI 2023, 58(3):963-974.
4. Sumkin JH, Berg WA, Carter GJ, Bandos AI, Chough DM, Ganott MA, Hakim CM, Kelly AE, Zuley ML, Houshmand G et al: Diagnostic Performance of MRI, Molecular Breast Imaging, and Contrast-enhanced Mammography in Women with Newly Diagnosed Breast Cancer. Radiology 2019, 293(3):531-540.
5. Jahani N, Cohen E, Hsieh MK, Weinstein SP, Pantalone L, Hylton N, Newitt D, Davatzikos C, Kontos D: Prediction of Treatment Response to Neoadjuvant Chemotherapy for Breast Cancer via Early Changes in Tumor Heterogeneity Captured by DCE-MRI Registration. Scientific reports 2019, 9(1):12114.
Figures