1466
Quantitative assessment of breast tumor: comparison of different region of interest for synthetic relaxometry and diffusion measurement1The Second Affiliated Hospital of Xi’an Jiaotong University, Xi 'an, China, 2GE HealthCare MR Research, Beijing, China
Synopsis
Keywords: fMRI Analysis, Breast
Motivation: The lack of guidelines or recommendations for the ROI size of DWI and synthetic MRI.
Goal(s): To investigate the effect of different ROI positioning methods on both ADC and synthetic MRI measurements and to subsequently evaluate the diagnostic performance of differently shaped ROIs.
Approach: Four different ROI positioning methods on ADC and synthetic parameters measurements.
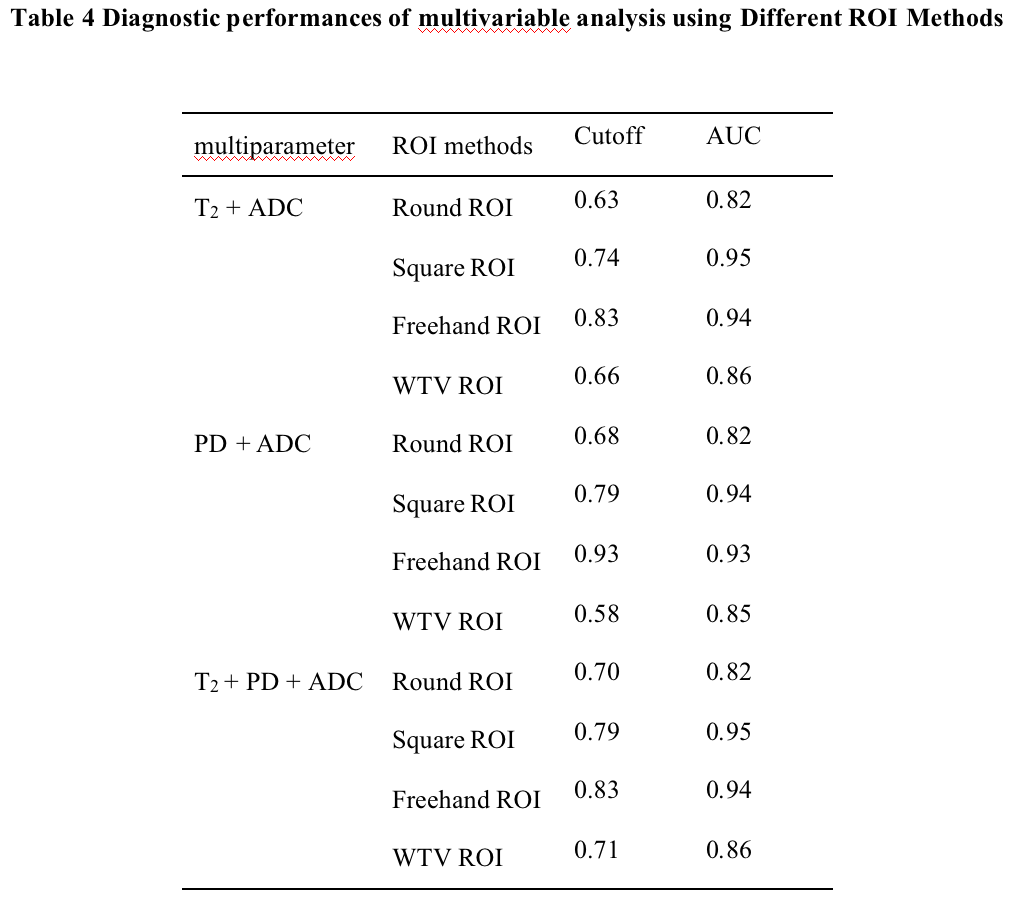
Results: Square ROI showed the optimal AUC followed by freehand ROI. T2 + ADC were more diagnostic than ADC or T2 alone.
Impact: The different ROI positioning methods used had a significant impact on the quantitative measurements and the performance in differentiating benign from malignant breast tumors.
Introduction
Early, accurate diagnosis and differentiation of benign and malignant breast tumors have an important impact on their prognosis and treatment 1, 2. Diffusion-weighted imaging (DWI) is a non-invasive method without the use of contrast agents and can be used as a complementary or alternative technique to DCE 3, 4. The apparent diffusion coefficient (ADC) from DWI has become an established quantitative biomarker for improving the differentiation between benign and malignant breast lesions. However, the best technique for measuring ADC values remains controversial, so the crucial questions are what size and where the ROI(s) should be. Synthetic MRI techniques have been increasingly used in the evaluation of breast lesions to quantify both T1 and T2 relaxation times as well as proton density (PD) image maps 5-7. To date, the lack of guidelines or recommendations for the size of ROIs, along with the lack of standardization of methods for measurement among studies, represent the major limitations of quantitative synthetic MRI. The purpose of this study was to investigate the effect of different ROI positioning methods on both ADC and synthetic MRI measurements in breast tumors and to subsequently evaluate the diagnostic performance of differently shaped ROIs in differentiating benign from malignant breast tumors.Material and Methods
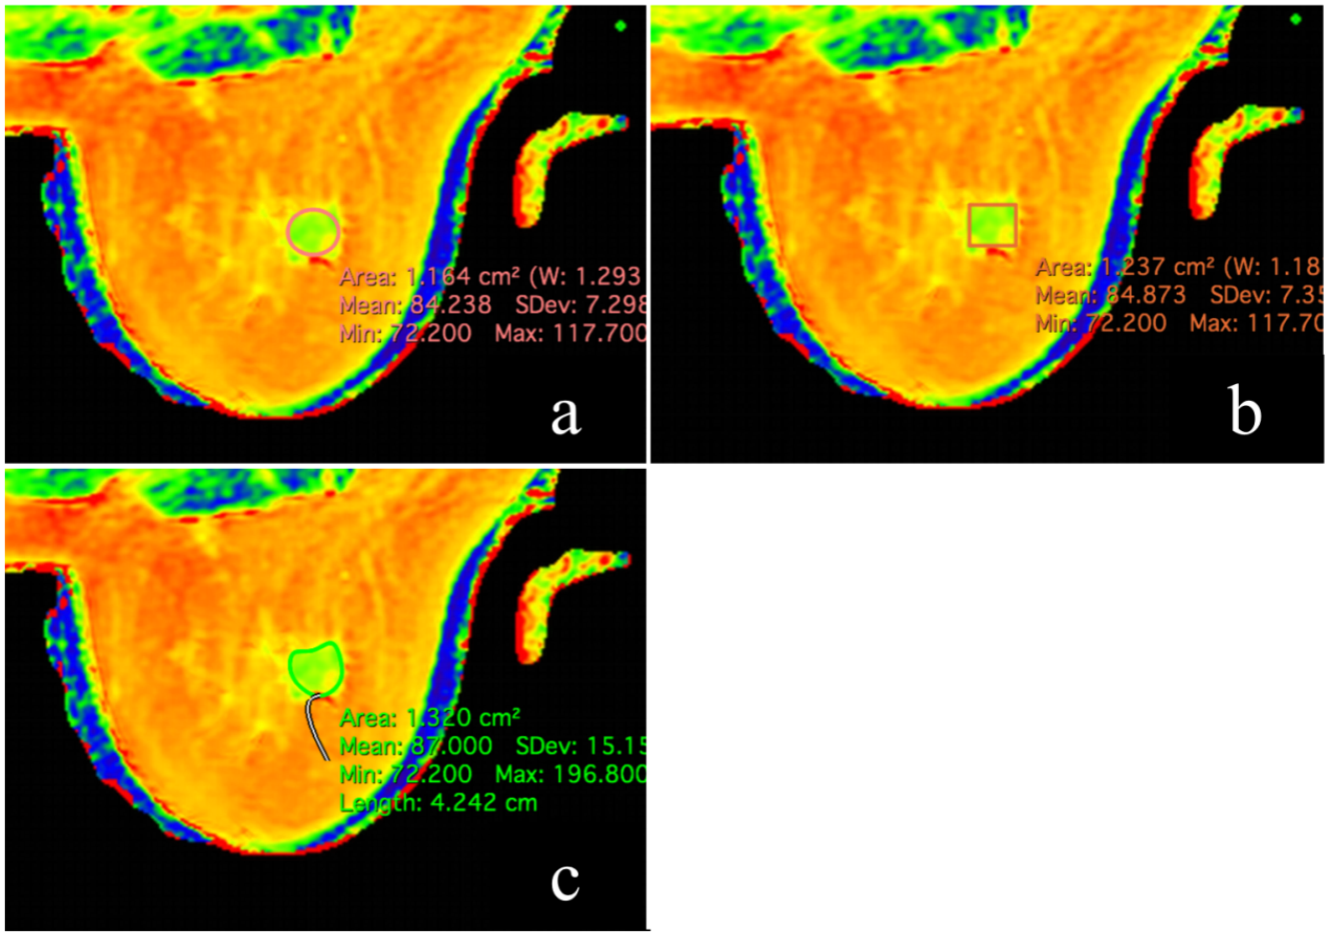
From May 2019 to August 2020, 103 patients with 110 newly diagnosed breast tumors (70 with malignant lesions, 40 with benign lesions) were retrospectively included in our study. All breast lesions were confirmed by biopsy or surgical pathology. The scan sequences included routine axial (AX) T2-weighted and T1-weighted imaging, DWI, DCE, and synthetic MRI (MAGiC). ADC and synthetic measurements were obtained from the ADC map and synthetic maps that contained the largest tumor cross-section, based on four different ROI positioning methods (Figure 1): (a) placing a maximum round ROI; (b) placing a maximum square ROI; (c) placing a tumor contour on a single section (the freehand ROI method); and (d) placing a tumor contour ROI on each section where the tumor appeared (the whole-tumor volume ROI method). Differences in the parameters between benign and malignant lesions were compared with a Wilcoxon test. Quantitative parameters with significant differences between benign and malignant groups were further combined for multiparametric analysis with logistic regression. For all univariable and multiparametric analyses, receiver operating characteristic (ROC) curve analysis was performed to assess the diagnostic performance.Results
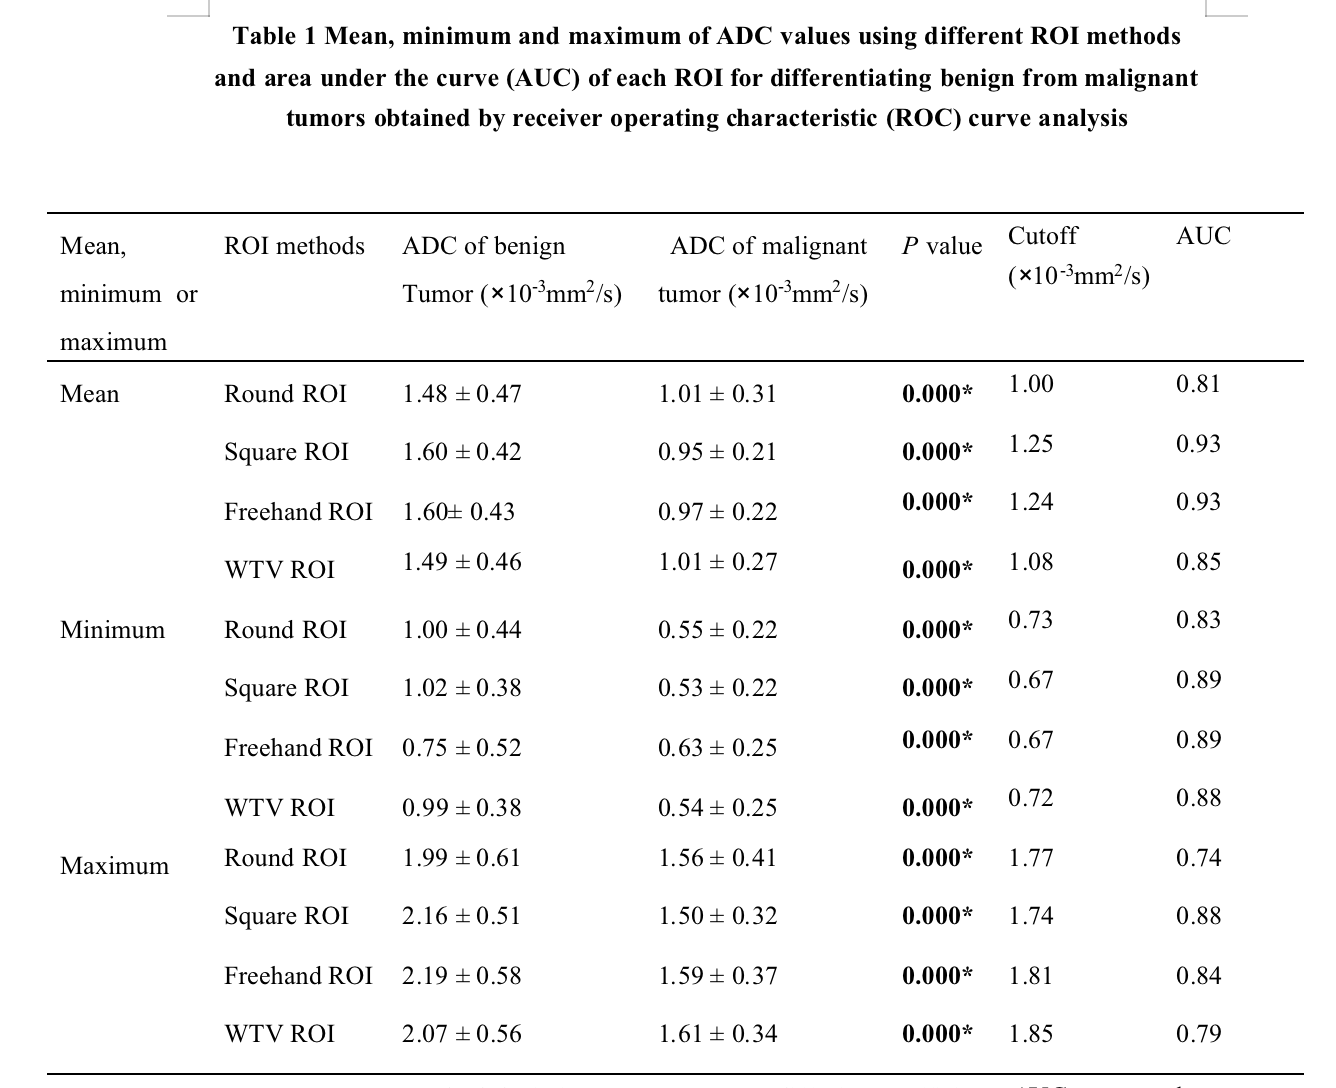
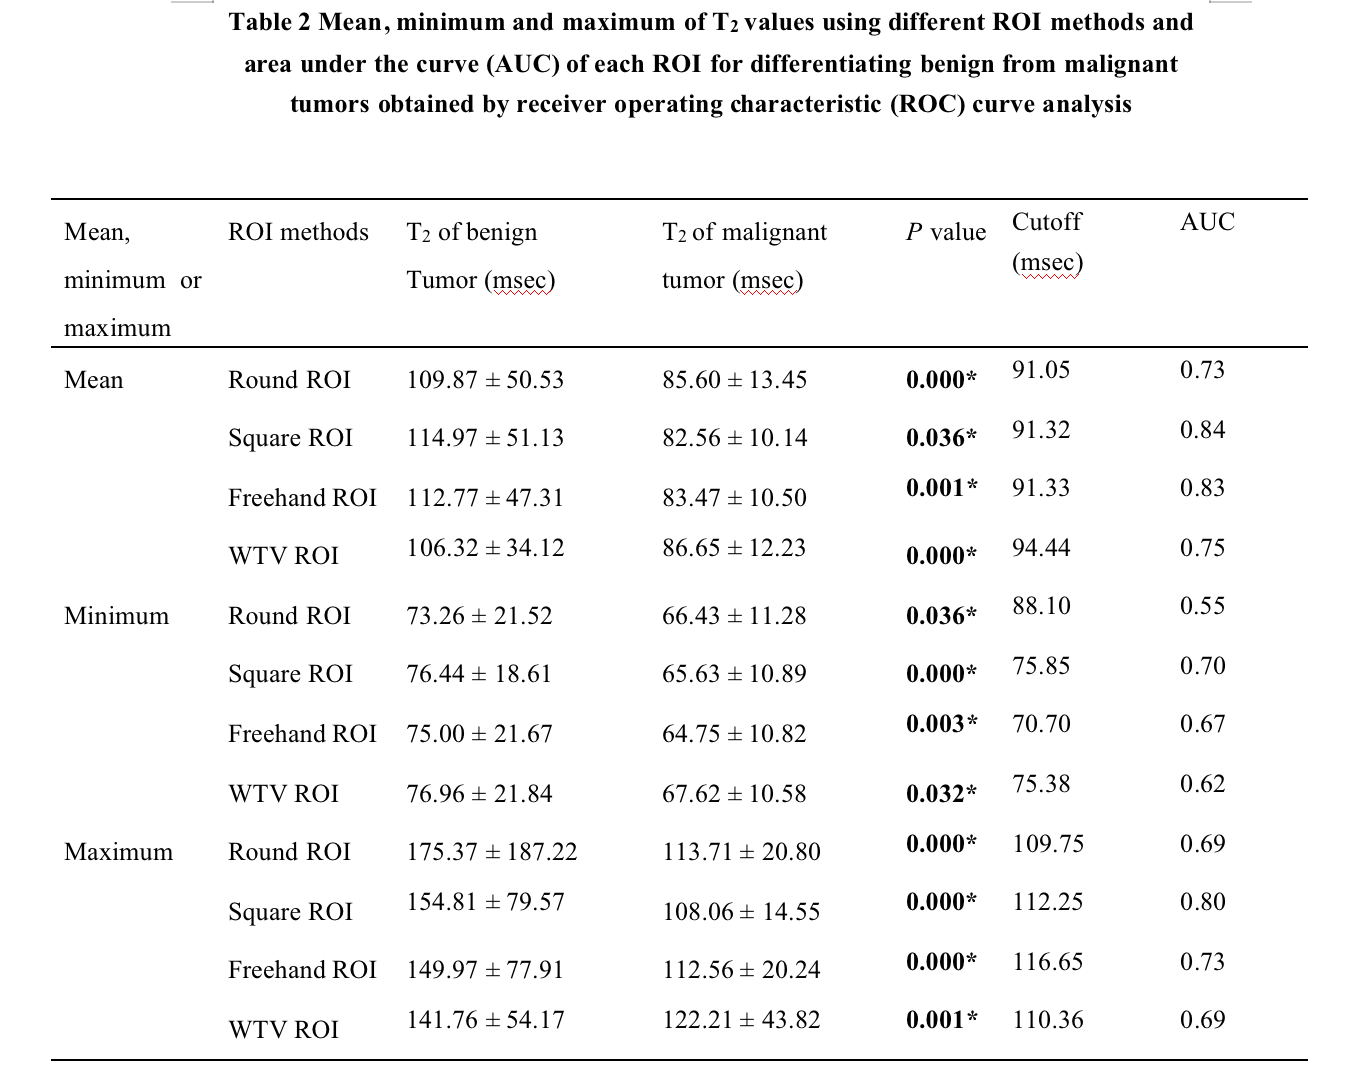
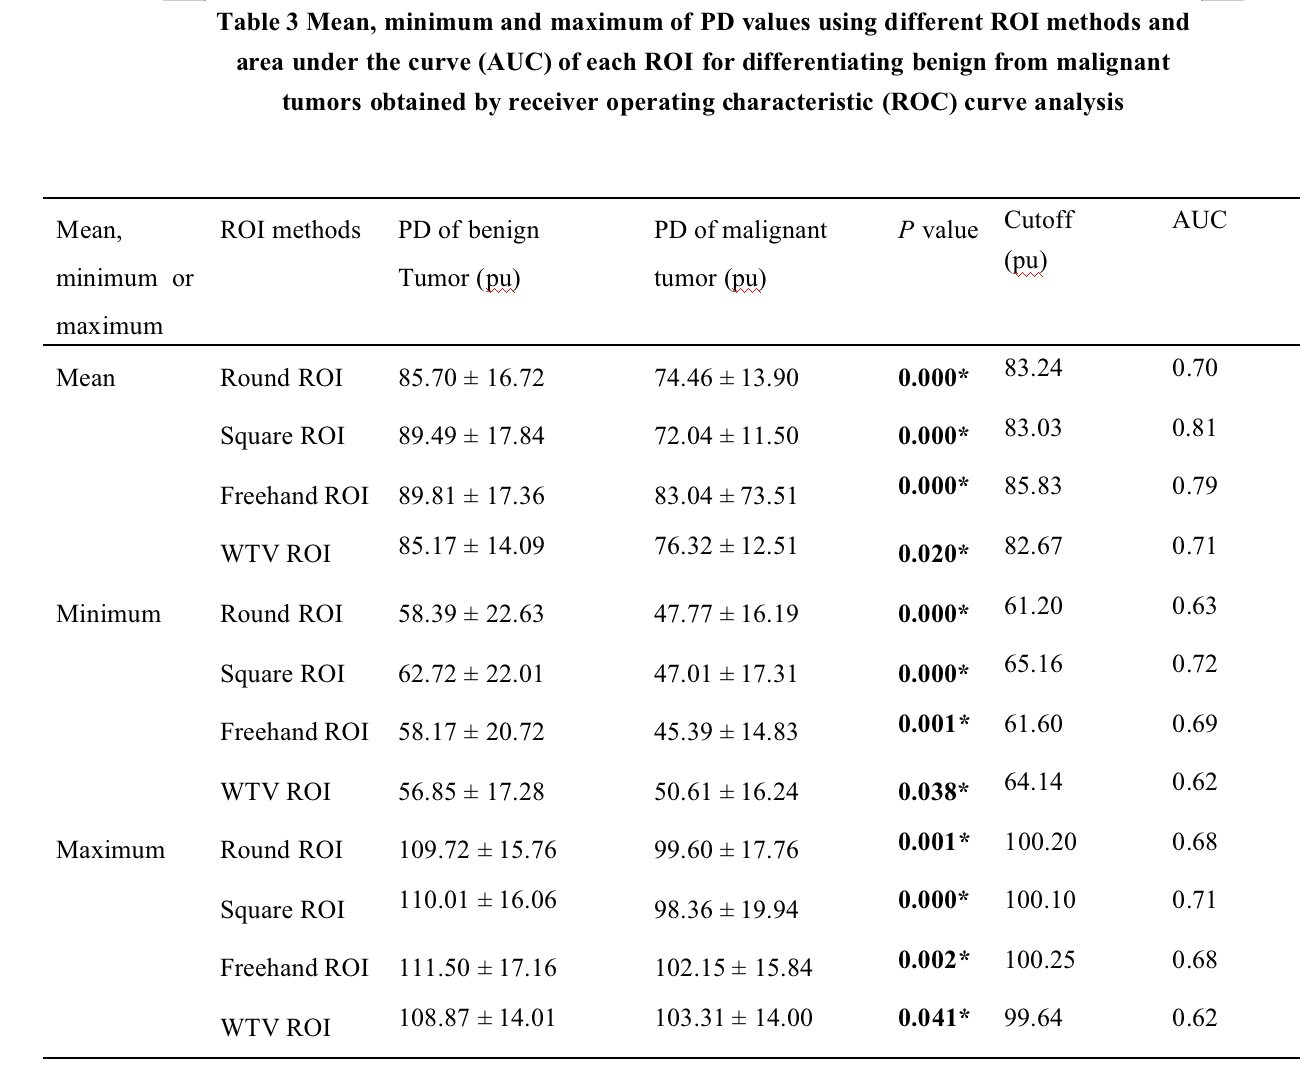
Mean, minimum, and maximum T2, PD, and ADC values are summarized in Table 1-3. The mean, minimum, and maximum T2, PD, and ADC values from all ROIs showed significant differences between benign and malignant tumors (all p < 0.05). Significant differences were observed between square ROI and freehand ROI, square ROI and whole-tumor volume ROI, and freehand ROI and whole-tumor volume ROI of mean T2 for both benign and malignant lesions (p < 0.05). Square ROI showed the optimal AUC with a value (of 0.81~0.93) followed by freehand ROI with a value (of 0.79~0.93). AUC values for the square ROI method were statistically higher than those for the round ROI method (p < 0.05), independent of the mean ADC, T2, or PD values. AUC showed significant differences between ADC and PD values obtained for the same ROI (p < 0.05). For the same ROI method, T2 + ADC and T2 + PD + ADC have the same AUC values (Table 4) and were more diagnostic than ADC or T2 alone.Discussion
Diagnosis of benign and malignant tumors on DWI and synthetic MRI is based on the measurement of ADC, T1, T2, and PD values within the tumor tissue, which are obtained by defining ROIs on their maps. In this study, the impact of different ROI positioning methods on quantitative MR parameters measurements and their diagnostic efficiency were all evaluated, and further compared with the multiparametric strategies. The results demonstrated that square ROI performed best in differentiating between benign and malignant breast lesions. In addition, T2 + ADC had the highest AUC values, which are more statistically diagnostic than ADC or T2 alone, suggesting the importance of T2 in improving the diagnostic performance. Our results indicated that variations in the size and position of ROI did substantially influence tumor ADC measurements, which is in concordance with the results of Bickel et al8. In addition, the diagnostic efficacy of multiple parameters in this study was higher than that of any single parameter, which is consistent with the results of our previous studies5.Conclusion
In conclusion, the different ROI positioning methods used had a significant impact on the quantitative measurements and the performance in differentiating benign from malignant breast tumors.Acknowledgements
No acknowledgement found.References
1.Siegel RL, Miller KD, Fuchs HE, Jemal A. Cancer statistics, 2022. CA Cancer J Clin. 2022 Jan;72(1):7-33.
2.Miller KD, Nogueira L, Devasia T, Mariotto AB, Yabroff KR, Jemal A, Kramer J, Siegel RL. Cancer treatment and survivorship statistics, 2022. CA Cancer J Clin. 2022 Sep;72(5):409-436.
3.Zhang M, Horvat JV, Bernard DB, et al. Multiparametric MRI model with dynamic contrast-enhanced and diffusion-weighted imaging enables breast cancer diagnosis with high accuracy. J Magn Reson Imaging 2019;49:864-874.
4.Partridge SC, Zhang Z, Newitt DC, et al. Diffusion-weighted MRI findings predict pathologic response in neoadjuvant treatment of breast cancer: The ACRIN 6698 Multicenter Trial. Radiology. 2018 Dec;289(3):618-627.
5.Gao W, Zhang S, Guo J, Wei X, Li X, Diao Y, et al. Investigation of synthetic relaxometry and diffusion measures in the differentiation of benign and malignant breast lesions as compared to BI-RADS. J Magn Reson Imaging 2021;53:1118–1127.
6.Gao W, Yang Q, Li X, Chen X, Wei X, Diao Y, Zhang Y, Chen C, Guo B, Wang Y, Lei Z, Zhang S. Synthetic MRI with quantitative mappings for identifying receptor status, proliferation rate, and molecular subtypes of breast cancer. Eur J Radiol. 2022 Mar;148:110168.
7.Krauss W, Gunnarsson M, Nilsson M, Thunberg P. Conventional and synthetic MRI in multiple sclerosis: a comparative study. Eur Radiol 2018;28:1692-1700.
8.Bickel H, Pinker K, Polanec S, et al. Diffusion-weighted imaging of breast lesions: Region-of-interest placement and different ADC parameters influence apparent diffusion coefficient values. Eur Radiol 2017;27:1883-1892.
Figures