1464
Automatically Quantitative Intratumoral Susceptibility Signal In Evaluating The FlOG Staging Of Ovarian Cancer Patients1Department of Radiology, Dalian Municipal Central Hospital, Dalian, China, 2The First Affiliated Hospital of Dalian Medical University, Dalian, China, 3Dalian Medical University, Dalian, China, 4Dalian University of Technology, Dalian, China
Synopsis
Keywords: fMRI Analysis, Quantitative Imaging, ovarian tumor
Motivation: Accurate diagnosis and staging of ovarian cancer play a key role in the selection of treatment plan, surgical method and determination of the circumference
Goal(s): Tumor intratumoral susceptibility signal (ITSS) can reflect the new growth inside the tumor
Vascular and bleeding conditions, ITSS have been widely used in many departments
Although few studies have applied this technique to ovarian cancer
Approach: Automatically quantitative ITSS prediction of clinical FIGO staging of ovarian cancer was performed by using AS (AnatomySketch 1.0) software (Dalian University of Technology)
Results: The automatic quantitative ITSS rate was significantly higher in advanced ovarian cancer than in early ovarian cancer
Impact: Automatic quantitative ITSS is expected to be applied to the study of ovarian tumors and more sites in the future. ITSS can effectively predict FIGO type of ovarian cancer and provide valuable information for making treatment plan and judging prognosis
Introduction
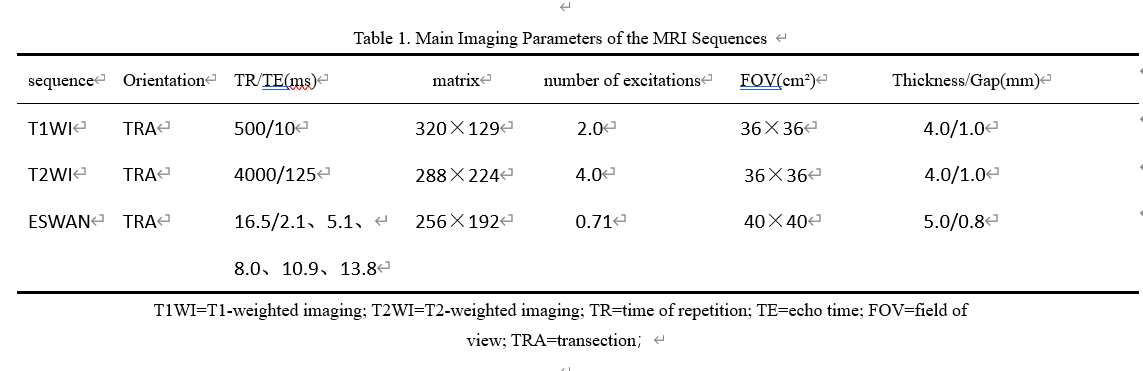
To explore the predictive value of automatic extraction of quantitative intratumor susceptibility signals (ITSS) from enhanced T2* -weighted angiography (ESWAN) sequences for International Federation of Gynecology and Obstetrics (FIGO) staging of ovarian cancer patients.Methods
The data of 38 patients with ovarian cancer who underwent 1.5TMRI scan (including ESWAN sequence) and were confirmed by pathology from January 2015 to November 2020 in the First Affiliated Hospital of Dalian Medical University were retrospectively analyzed. According to FIGO stage, they were divided into early ovarian cancer group (n=19, FIGO stage Ⅰ to Ⅱ) and advanced ovarian cancer group (n=19, FIGO stage Ⅲ to Ⅳ). AnatomySketh software was used by two observers respectively to delineate lesions, the maximum cross-section ratio and volume ratio of ITSS quantitative lesions were automatically obtained. The consistency of the two observers' parameters and the difference between the two groups were compared, and the differential diagnostic efficacy of the different parameters was assessed using receiver operating characteristic (ROC) curves.Results
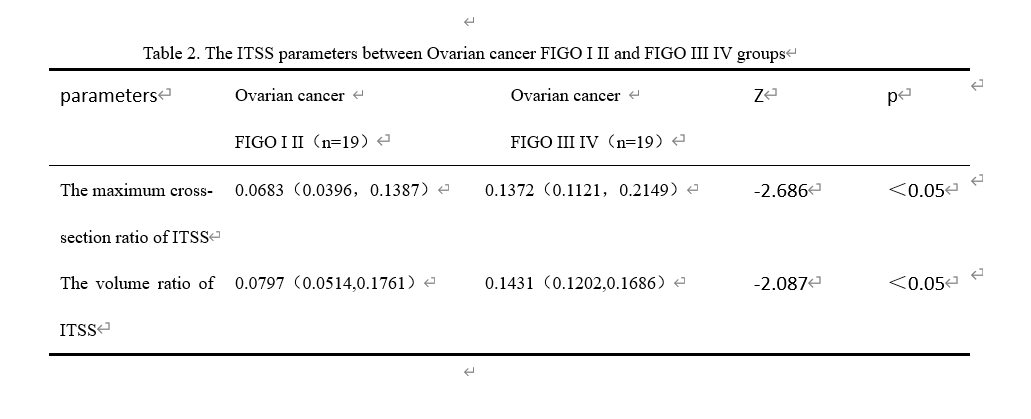
The consistency of parameter values measured by two observers was good (ICC > 0.75). The maximum cross-section ratio of ITSS and the lesion volume ratio of ITSS in the advanced ovarian cancer group were 0.1372 (0.1121,0.2149) and 0.1431 (0.1202,0.1686), respectively, higher than those in the early ovarian cancer group 0.0683 (0.0396,0.1387), 0.0797 (0.0514,0.1761), the difference was statistically significant (Z=-2.686, Z=-2.087, P < 0.05). In the advanced ovarian cancer group, the area under ROC curve of maximum cross-section ratio of ITSS lesions was 0.755, and the sensitivity and specificity were 94.7% and 42.1%, respectively. The area under ROC curve of ITSS lesion volume ratio was 0.698, and the sensitivity and specificity were 94.7% and 36.8%, respectively.Discussion
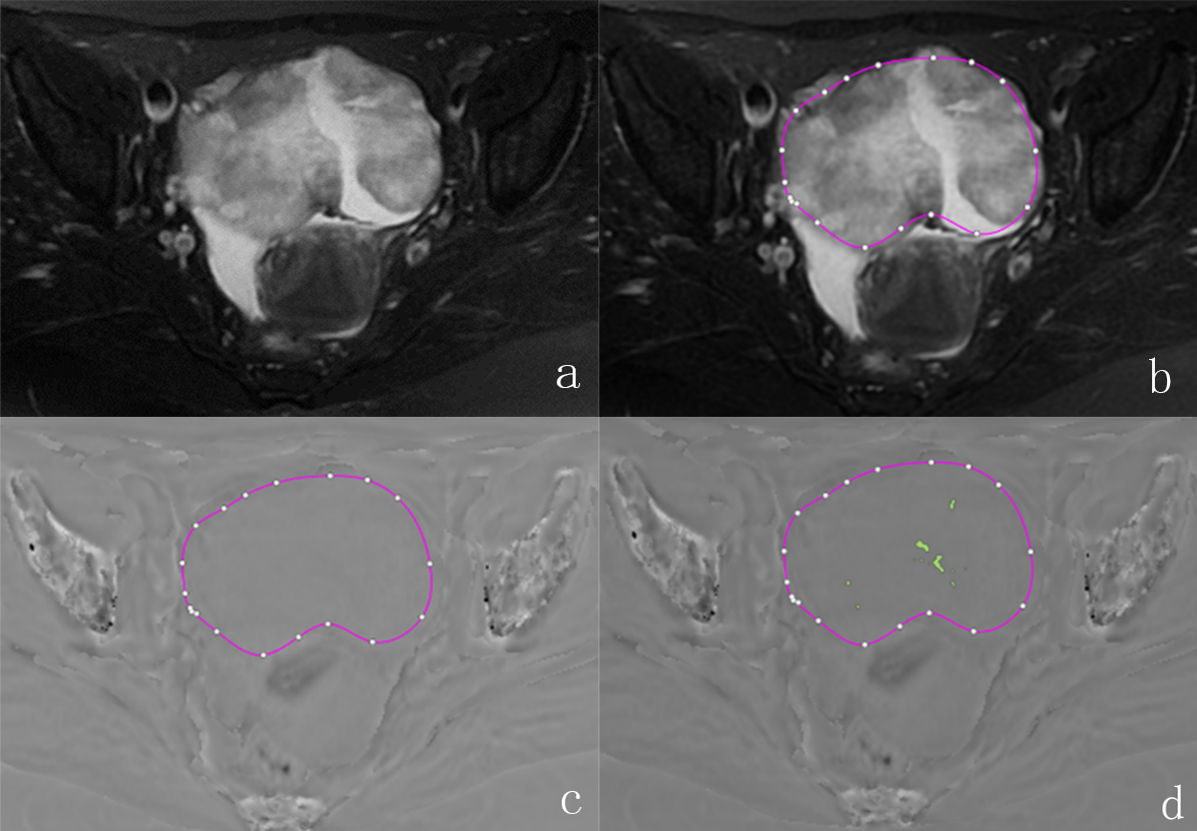
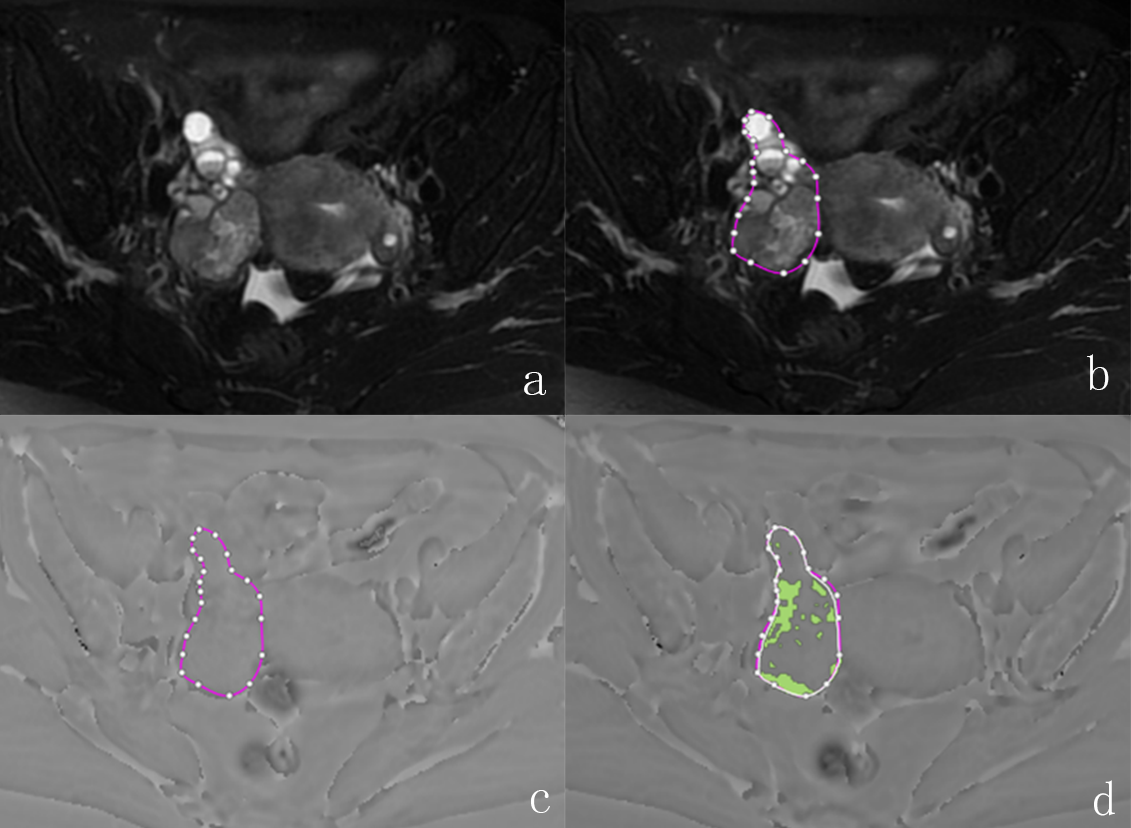
ITSS is a low signal region with continuous dots or thin lines inside the tumor on the phase diagram, and the main source is micro-bleeding and neovascularization inside the lesion [1]. The growth, invasion and metastasis of malignant tumors depend on neovascularization, and the level of angiogenesis is an important indicator to evaluate the aggressiveness of tumors. ITSS is consistent with the density and size of microvessels in the histological samples [2], which is a non-invasive imaging marker that visually displays the proliferation of blood vessels inside tumors .In this study, automatic extraction and quantitative ITSS was used for the first time to predict the FIGO stage of the ovary, overcoming the shortcomings of semi-quantitative method that could not reflect local differences in lesions and was difficult to compare. Moreover, because the blood vessels of malignant tumors are irregular, clustered and not easy to identify, manual ITSS counting is time-consuming, laborious and subjective, so the automatic extraction and quantification of ITSS using AS software is more suitable for clinical work.
The automatic quantitative ITSS method proposed in this study has good efficacy in the identification of FIGO stage of ovarian cancer, and the agreement between two observers is good, which confirms the stability of the method. The ITSS ratio of FIGO stage III and IV ovarian cancer is significantly higher than that of FIGO stage I and II patients. Pathological studies have shown that ovarian cancer tumors with high malignancy have higher microvascular density [3], irregular vascular movement of newborn tumors, increased blood flow resistance, prolonged blood residence time, overutilization of blood oxygen, and increased deoxyhemoglobin. In addition, the tube wall permeability is high, often accompanied by micro-bleeding. Paramagnetic substances such as deoxygenated hemoglobin and its oxidation products cause uneven local magnetic field, shorten T2* time, and generate phase difference between proton frequency shift and surrounding tissues, so that the neovascularization and micro-bleeding are shown as low signal areas on the phase diagram , thus increasing the ITSS ratio.
Conclusion
Automatically quantitative ITSS can effectively predict the clinical stage of ovarian cancer, and it is more convenient to automatically extract and quantify ITSS.Acknowledgements
No acknowledgement found.References
1、 Gaudino S, Marziali G, Pezzullo G, et al. Role of susceptibility-weighted imaging and intratumoral susceptibility signals in grading and differentiating pediatric brain tumors at 1.5 T: a preliminary study[J]. Neuroradiology, 2020, 62(6): 705-713. DOI: 10.1007/s00234-020-02386-z.
2、 Christoforidis GA, Kangarlu A, Abduljalil AM, et al. Susceptibility-based imaging of glioblastoma microvascularity at 8 T: correlation of MR imaging and postmortem pathology[J]. Am J Neuroradiol, 2004, 25(5): 756-760
3、 Sopo M, Anttila M, Muukkonen OT, et al. Microvessels in epithelial ovarian tumors: high microvessel density is a significant feature of malignant ovarian tumors[J]. Anticancer Res, 2020, 40(12): 6923-6931. DOI: 10.21873/ anticanres.14716
Figures