1460
Restriction Spectrum Imaging (RSI) Models for Cervical Cancer1Radiology, University of California San Diego, San Diego, CA, United States, 2Radiology, University of California San Diego, La Jolla, CA, United States, 3University of California San Diego, La Jolla, CA, United States, 4Neurosciences, University of California San Diego, La Jolla, CA, United States, 5Radiation Medicine and Applied Sciences, University of California San Diego, La Jolla, CA, United States, 6Ob/Gyn & Reproductive sciences, University of California San Diego, La Jolla, CA, United States
Synopsis
Keywords: Cancer, Cancer
Motivation: Restriction spectrum imaging (RSI) has demonstrated potential to isolate cervical cancer signal from that of surrounding tissues. Women with post-treatment disease progression wait 3-6 months post treatment to get PET/CT exam to allow for edema/inflammation to subside. Cervical cancer-specific RSI model may allow us to evaluate response-to-treatment earlier.
Goal(s): The goal of this work was to develop an RSI cervical cancer model from a larger cohort of patients.
Approach: We used RSI-derived information from normal cervixes to convert RSI outputs to Z-score maps in cancer patients.
Results: Demonstrated the utility of RSI Z-score maps in differentiating cancers from healthy tissues without exogenous contrast.
Impact: Standard of care evaluation of cervical cancer response-to-treatment is PET/CT 3-6 months post-treatment to allow for edema/inflammation to subside. Cervical cancer-specific RSI model may allow us to evaluate response-to-treatment earlier and better inform patient treatment response without unnecessary delay.
Introduction
Cervical cancer, the fourth most common cancer in women worldwide,1 currently requires a 3 to 6-month waiting period for post-treatment PET-CT assessment.2 Earlier treatment-response evaluation would make it possible to alter treatment for women with poor response to initial therapy.Restriction spectrum imaging (RSI) has demonstrated potential in cervical cancer diagnosis and monitoring.3 We have improved a cervical cancer-specific RSI model by 1) expanding our patient database, 2) using RSI data from healthy cervixes to create Z-score maps in cancer patients, and 3) demonstrating the effectiveness of RSI Z-score maps in distinguishing cancer from healthy tissue without the need for contrast agents.
Methods
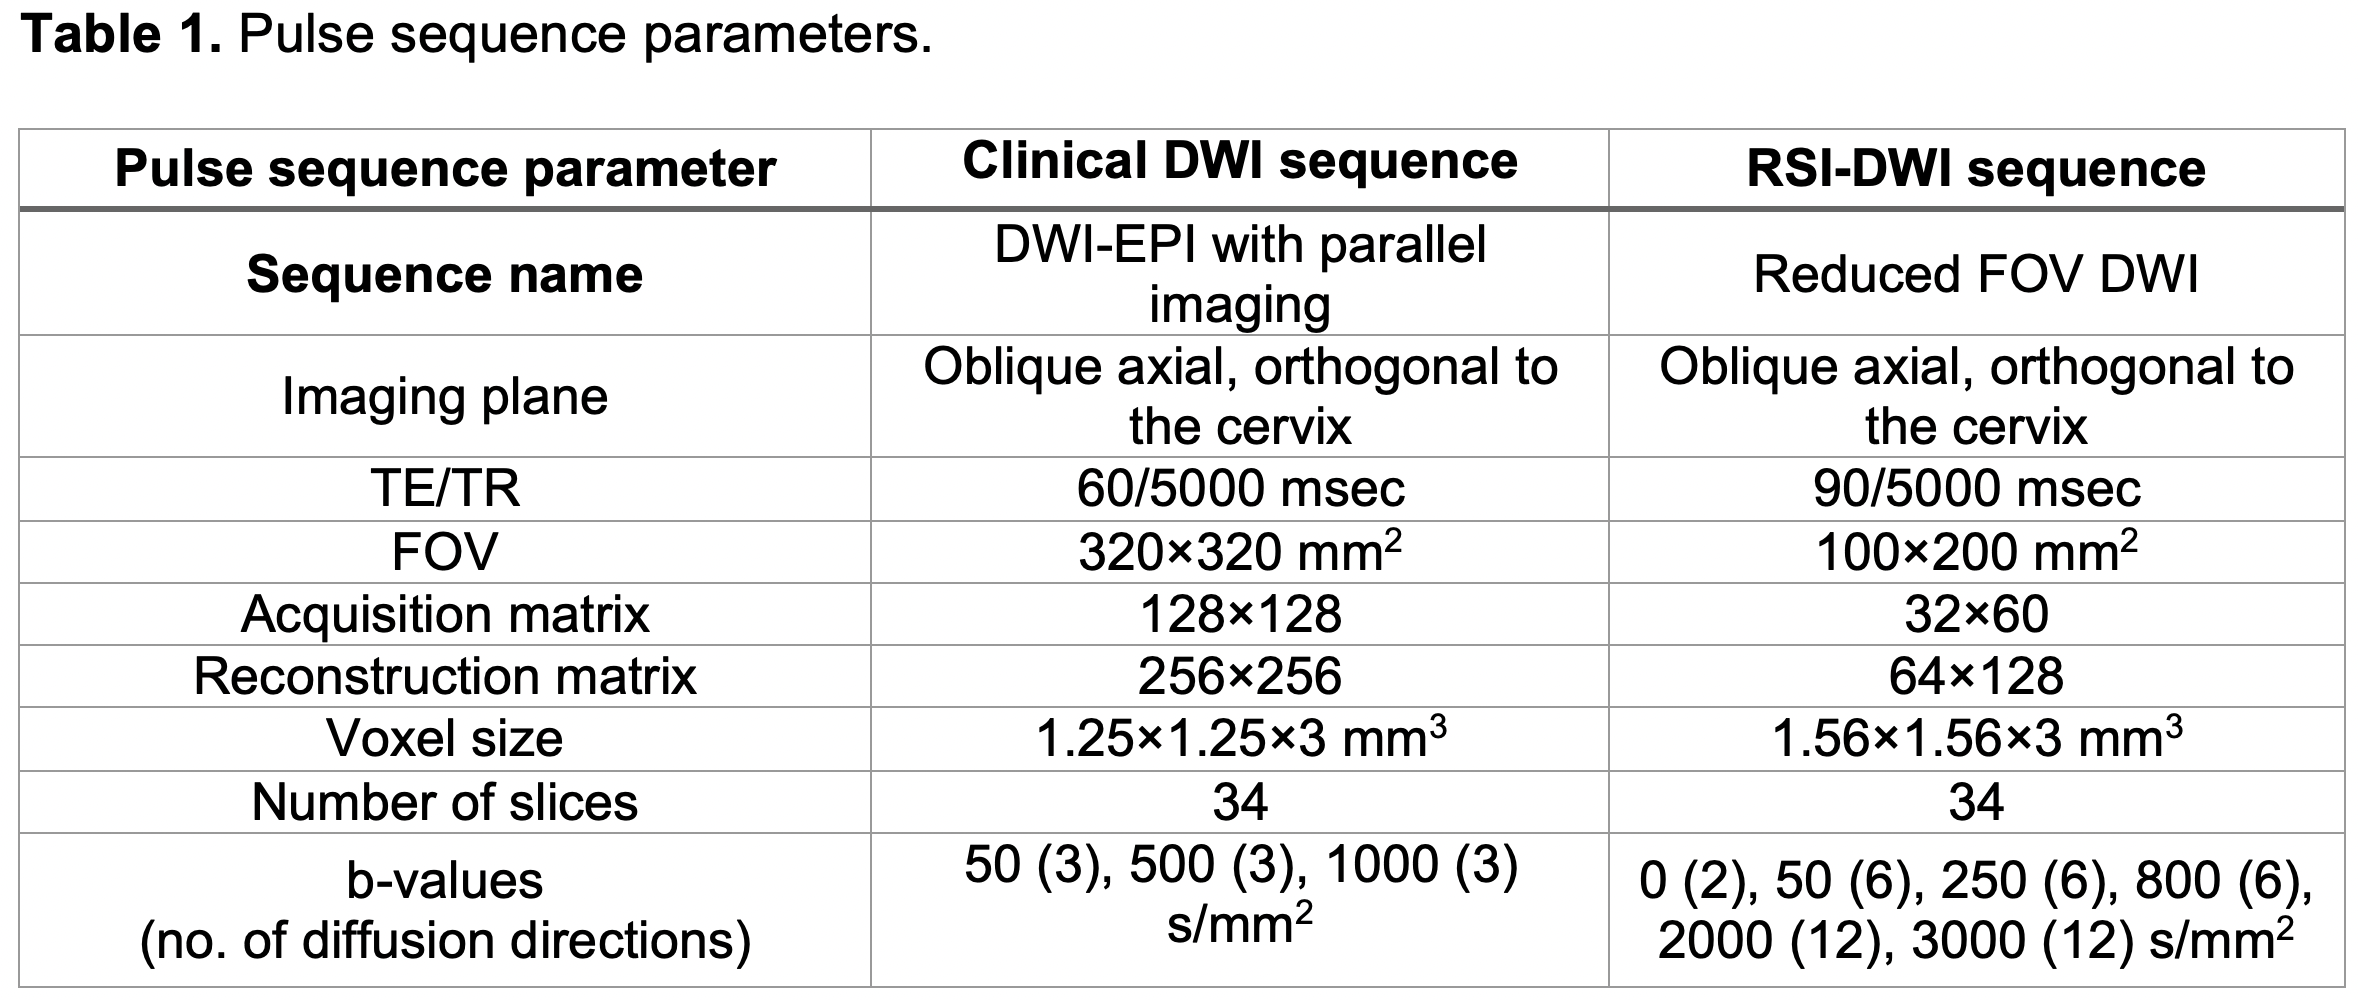
Diagnostic MRI at 3T was performed on 15 cervical cancer patients with confirmed pathology, prior to treatment (average age: 46.5±14.6 years-old) and on 11 healthy volunteers (average age: 43.6±14.8 years-old). DWI pulse sequence parameters are provided in Table 1. These datasets were used convert cancer data to RSI Z-score maps. Additional 11 volunteers (average age: 44.5±12.4 years-old) were included to compare RSI Z-score results in cancer patients with an independent negative control group.Cervix ROIs were drawn on DWI images from healthy controls and cancer ROIs were drawn on images from cancer patients by a fellowship-trained body radiologist. Conventional ADC maps were computed.
In the cervical cancer-specific RSI model, global ADCs are first estimated across all voxels from cancer ROIs using multi-exponential models. Once the fixed ADCs are determined, the signal contributions, Ci,N, are estimated. This approach allows the use of a consistent model across all voxels for comparing signal contributions across water compartments. Additionally, DWI data were noise corrected and averaged across diffusion directions for each b-value. The diffusion signal was then modeled as the linear combination of multiple exponential decays:
$$$S_{diff}(b,N) = S_o\sum_{k=1}^ne^{-b D_{i,N}}= \sum_{k=1}^nC_{i,N}e^{-b D_{i,N}}$$$ (1)
where N is the total number of exponential decays (here 2, 3 or 4), Ci,N are the signal contributions of each exponential component, b are the b-values in s/mm2, and Di,N are the ADCs of each exponential component (D1,N<Di,N).
Signal contribution Ci,N maps of cancer patients were then converted into a Z-score based on the average and standard deviation of healthy volunteers:
$$$Z_{i,N} = \frac{C_{i,N} - \mu_{i,N-healthy}}{\sigma_{i,N-healthy}}$$$ (2)
where and are the mean and standard deviation of the RSI Ci,N (Equation 1) in healthy cervix. RSI Z-maps indicate deviations in RSI signal contribution from healthy tissue.
The relative Bayesian information criterion (BIC) was estimated for all multi-exponential models because it penalizes the number of parameters.4 Lower BIC values indicate improved model fitting. Signal contributions Ci,N and RSI Z-scores were compared between cancerous and healthy cervical tissues for the three RSI models using an unpaired two-tailed t-test, and a Bonferroni correction was used for multiple comparisons.
Results
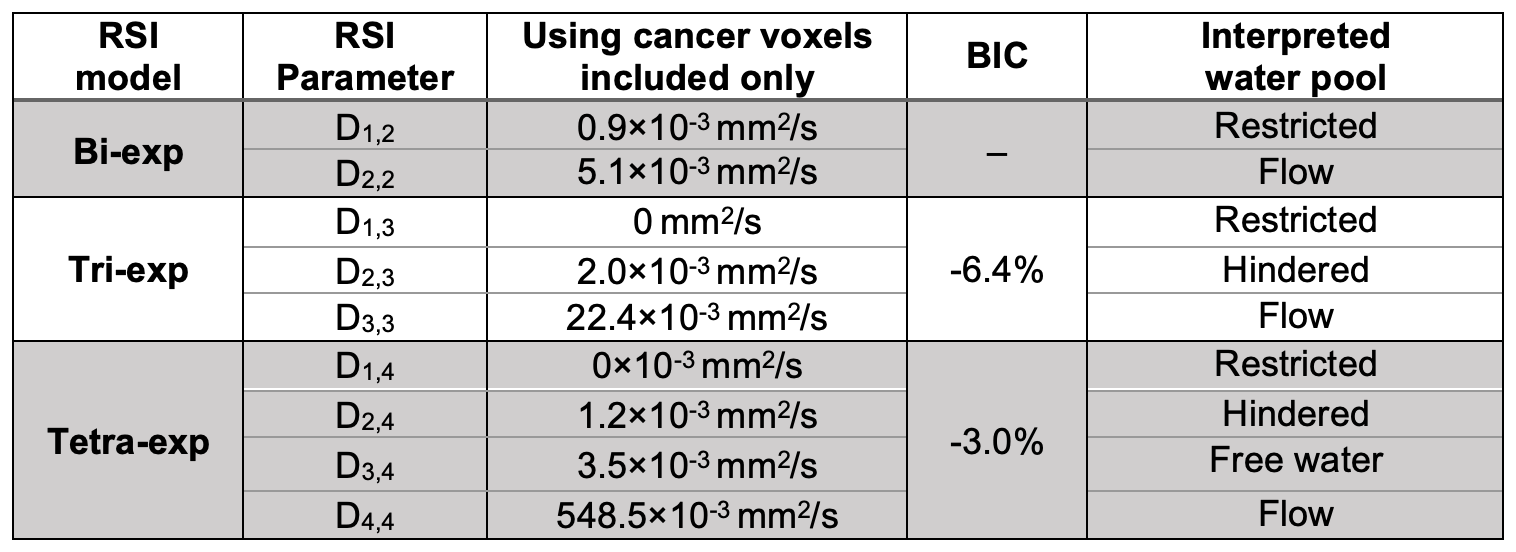
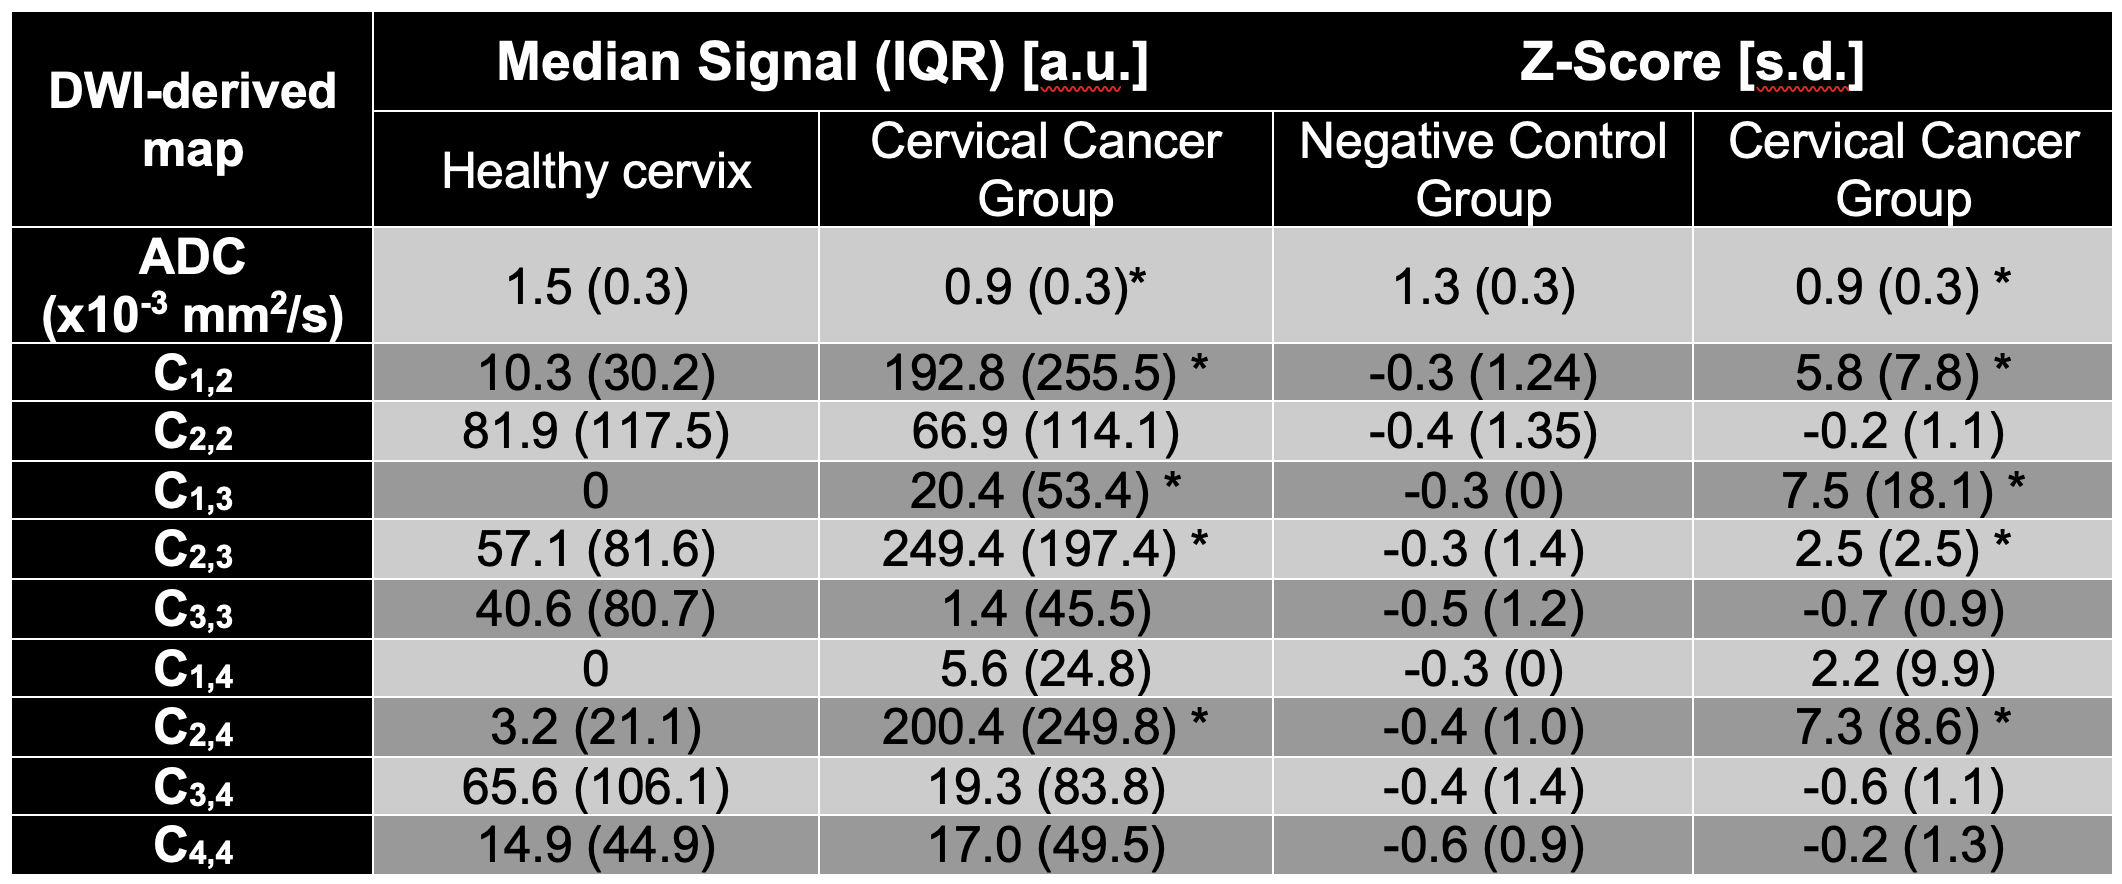
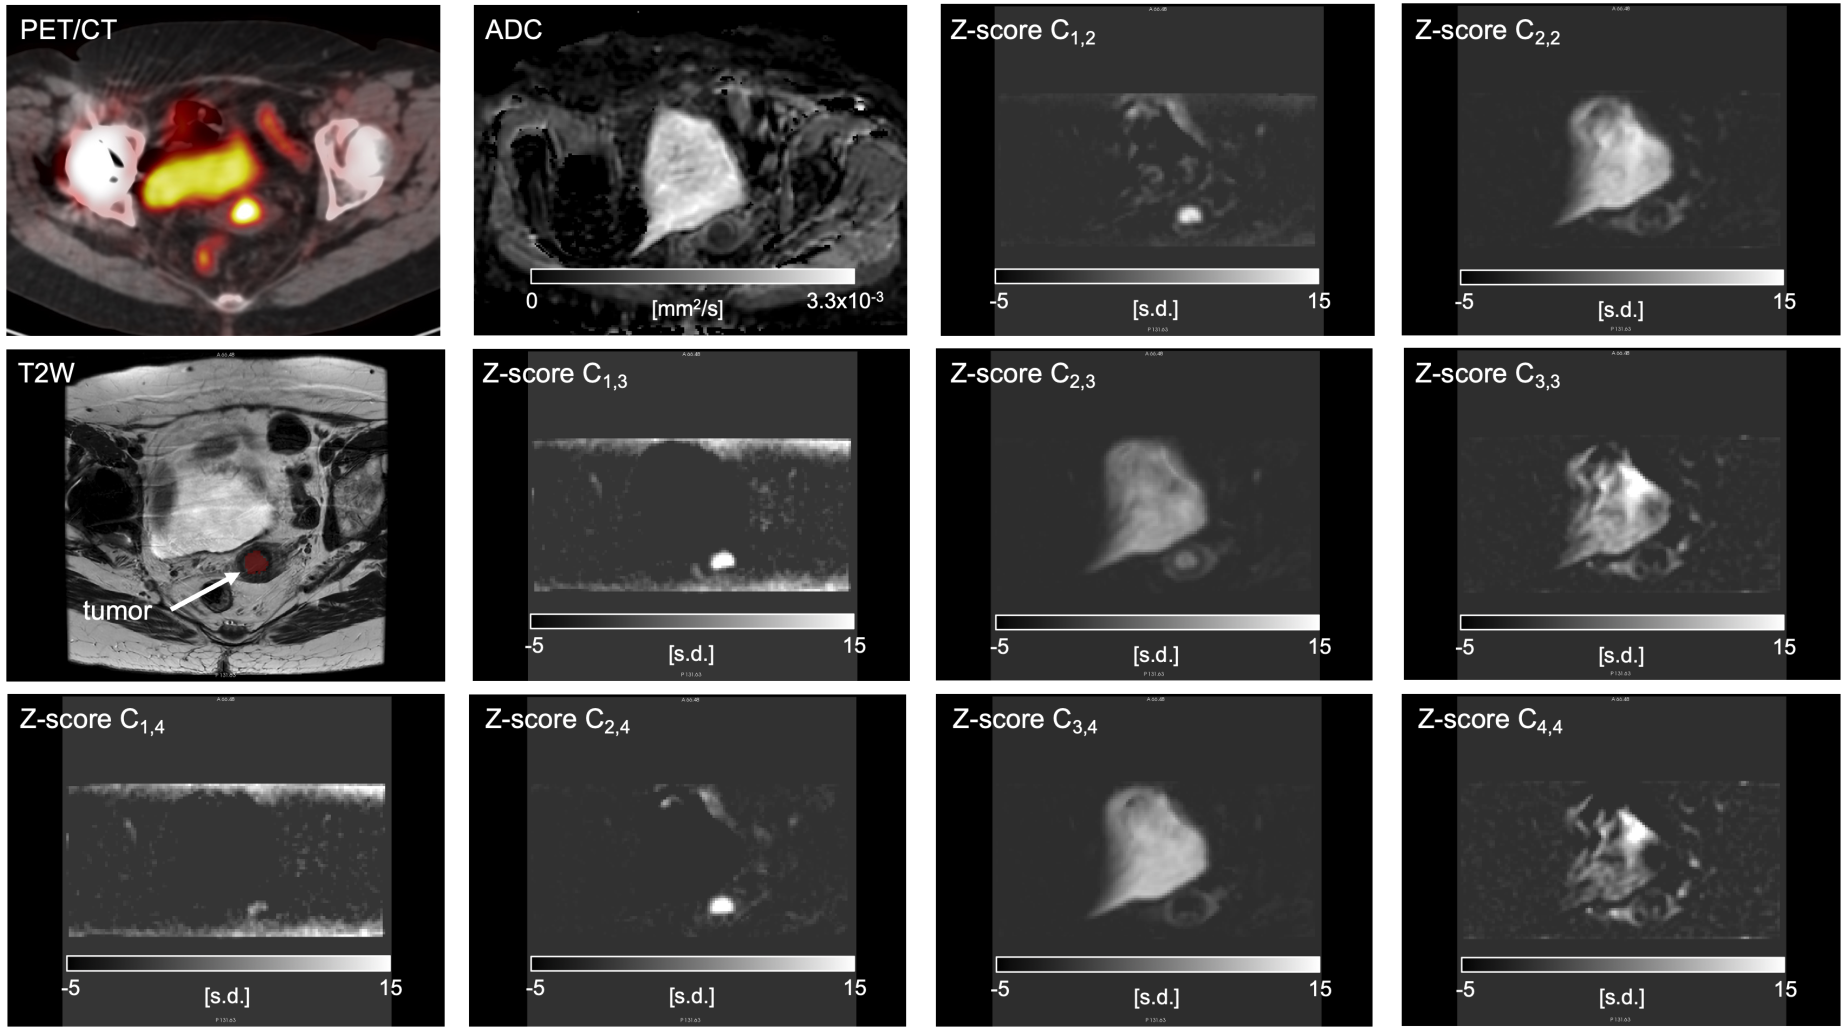
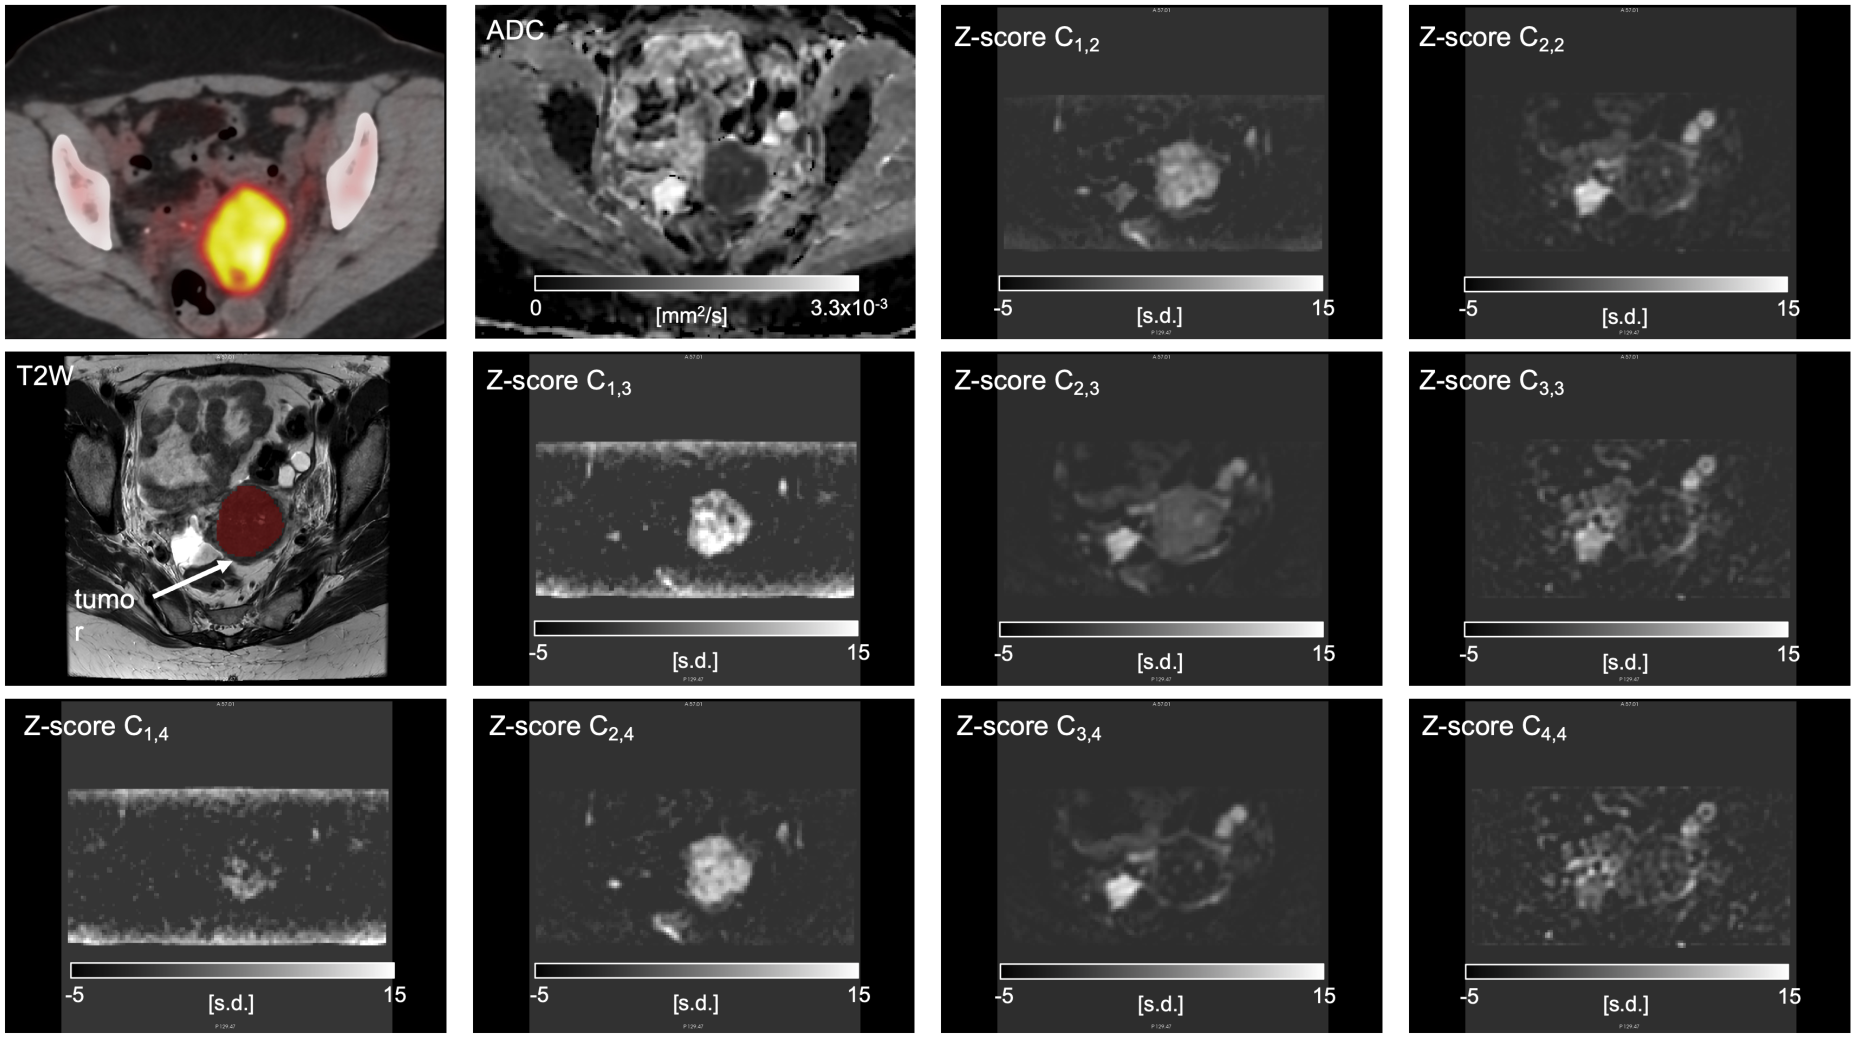
Fixed ADCs and BIC values for each model are shown in Table 2. BIC scores indicate that bi-exponential models are sufficient for describing the diffusion-weighted signal of cervical cancer tissues. However, higher order RSI models remove signal from other tissues increasing tumor conspicuity (Figures 1-2). The RSI signal contribution maps from bi- and tri-exponential models were similar (Figures 1-2). The main difference was that the compartment C3,3 appears to include signals from fast moving fluids (e.g., urine and vascular flow).Conventional ADCs were different between cervical cancers and heathy cervixes. RSI signal contributions C1,2, C1,3, C2,3, and C2,4, were higher (p<0.05) in tumor tissues (Table 3). The compartment C1,3 and C2,4 exhibited the largest difference between cervical cancer and healthy cervixes (Group A). These results were also reflected on the RSI Ci,N Z-score maps of tumors when compared to those from the negative control (Table 3).
Discussion and Conclusions
We demonstrate the potential of cervical cancer-specific RSI models in distinguishing tumors and healthy tissues. Although ADC ROI values were statistically different between groups, RSI models enhanced tumor conspicuity without the need for exogenous contrast in women with cervical cancer ranging from stages IA2 to IIIC1. Future work will include assessing tumor conspicuity and the clinical utility of RSI in cervical cancer evaluation.The RSI compartments associated with restricted and hindered diffusion (i=12) were different between cervical cancer and healthy cervixes. These compartments are attributed to cancer cells, while the faster compartments (i=3 or 4) may originate from tissues with free diffusion and vascular flow.
In future work, we will evaluate the diagnostic value of RSI models in an independent cohort of cancer patients compared to DCE-MRI and PET/MRI and assess the ability of the RSI model to identify post-treatment edema.
Acknowledgements
Supported by NIH R37CA249659 and a research grant from General Electric Healthcare.References
1 Bray, F. et al. Global cancer statistics 2018: GLOBOCAN estimates of incidence and mortality worldwide for 36 cancers in 185 countries. CA Cancer J Clin 68, 394-424 (2018). https://doi.org:10.3322/caac.21492
2 Koh, W. J. et al. Cervical Cancer, Version 3.2019, NCCN Clinical Practice Guidelines in Oncology. J Natl Compr Canc Netw 17, 64-84 (2019). https://doi.org:10.6004/jnccn.2019.0001
3 Yamin, G. et al. Cervical cancer staging and surveillance using Restriction Spectrum Imaging (RSI)-MRI in comparison to PET-CT: Pilot Clinical Application. Proceedings ISMRM 2018.
4 Schwarz, G. Estimating the Dimension of a Model. The Annals of Statistics 6, 461-464 (1978).
Figures