1458
A magnetic resonance imaging-based lymph node regression grading scheme for nasopharyngeal carcinoma after radiotherapy1Sun Yat-sen University Cancer Center, Guangzhou, China, 2Philips Healthcare, Guangzhou, China
Synopsis
Keywords: Treatment Response, Cancer
Motivation: After curative radiotherapy (RT), there is no commonly accepted method to distinguish between patients with residual disease that may eventually cause disease progression and those who are already cured of the disease in nasopharyngeal carcinoma (NPC).
Goal(s): We proposed a four-category MRI-based lymph node regression (MRI-LRG) grading system to investigate its prognostic value for NPC after RT.
Approach: 387 NPC patients were included in this retrospective study. Lymph node regression grade was assessed on MRI based on the areal analysis of RT-induced fibrosis and the residual tumor.
Results: Our results showed that MRI-based LRG was an independent prognostic factor for progression-free survival.
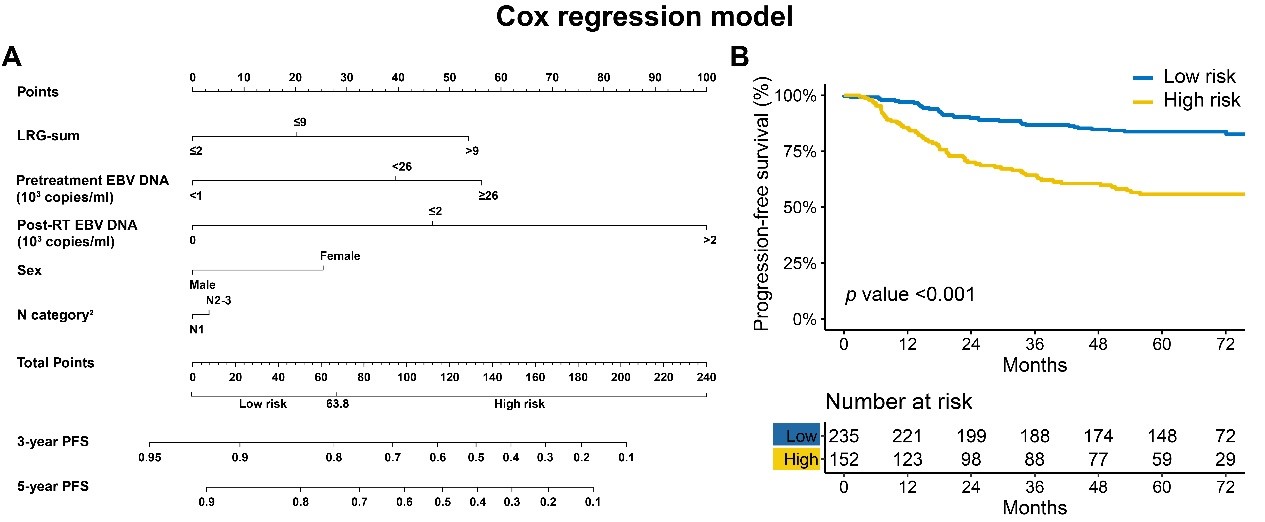
Impact: A nomogram, based on LRG-sum, pretreatment EBV DNA, post-RT EBV DNA, sex and N stage factors, was proved to be useful to facilitate risk stratification in NPC. This approach might help to stratify treatment modalities and develop a more effective tailored surveillance program in patients with NPC.
Introduction
Radiotherapy (RT) is the primary treatment for patients with early-stage nasopharyngeal carcinoma (NPC), and combined chemotherapy is generally considered for patients with advanced-stage disease (1-3). After curative RT, there is no commonly accepted method to distinguish between patients with residual disease that may eventually cause disease progression and those who are already cured of the disease. High-resolution MRI is recommended for LN response assessment after RT (4, 5), however, the relevance of MRI-based LN regression grade (LRG) after RT in predicting clinical outcomes has not been investigated in NPC. This study proposed a four-category MRI-based LRG system and developed a risk model based on MRI-based LRG for stratification of patients with NPC after RT.Patients and Methods
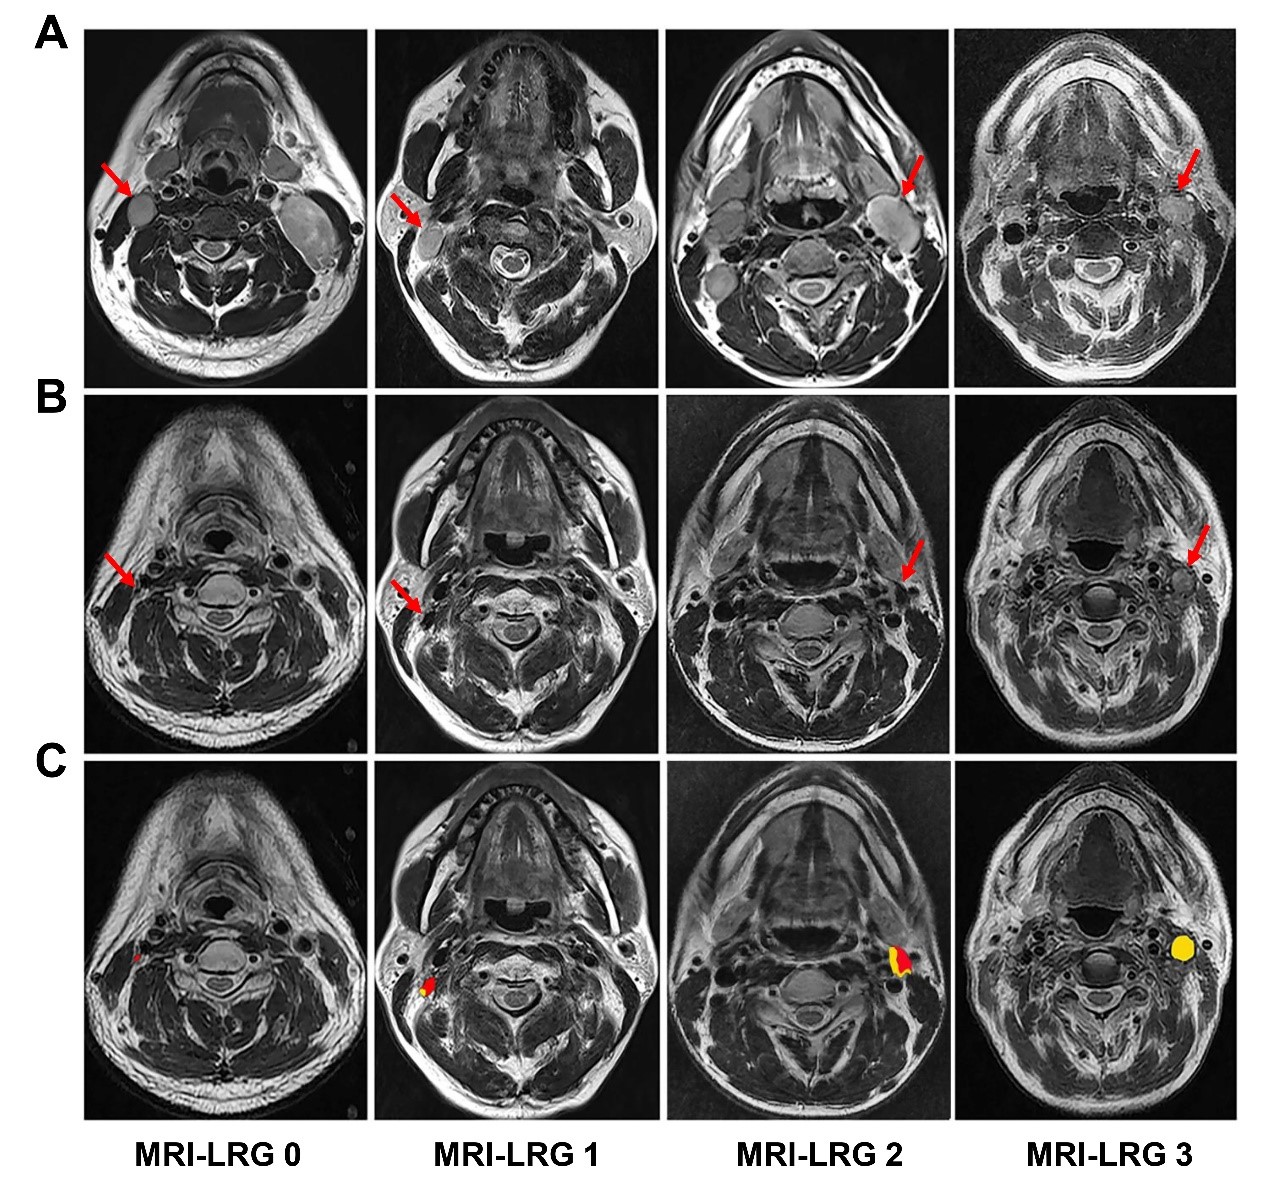
There were 387 newly diagnosed patients with non-distant metastatic NPC from January 2010 to January 2013 included in this retrospective study. Lymph node regression grade (LRG) was assessed on MRI independently by two radiologists. LRG was evaluated 3–4 months after RT on T2-weighted images (T2WI) according to the following criteria: RT-induced LN fibrosis and the residual tumor were outlined on the T2WI using Photoshop software (Adobe Inc. USA). Zones with intermediate or high T2WI signals were considered residual tumors. In contrast, areas with low T2WI signals were considered fibrosis(6). The proportion of residual tumors was assessed as follows: tumor area/(tumor area + fibrosis area) × 100%. Based on our hypothesis, a four-category MRI-LRG system was proposed for the non-invasive assessment of LN response to RT according to previous studies (7). The MRI-LRG categories were defined as follows: MRI-LRG 0 (good response), absence of residual tumor or tumor disappeared entirely; MRI-LRG 1 (moderate response), residual tumor accounts for ≤ 25%; MRI-LRG 2 (minimal response), residual tumor accounts for 25–50%; MRI-LRG 3 (poor response), residual tumor accounts for > 50% (Figure. 1). All radiologically suspected LNs before treatment were assessed, and each LN was scored from 0 to 3 for regression degree according to the MRI-LRG system. Owing to the variability of LN responses observed in patients, the sum score of the MRI-LRG of each counted LN was calculated as the final LRG score (LRG-sum) to assess the LN response for each patient. Univariate analysis was performed to identify significant prognostic factors associated with progression-free survival (PFS). The prognostic factors with p values < 0.05 in the univariate analysis were incorporated into the multivariate Cox regression models to further calculate hazard ratios (HRs) with 95% confidence intervals (CIs) and adjusted p values. The final Cox regression model was developed using a stepwise approach and visualized using a nomogram. Survival curves were plotted using the Kaplan–Meier method and compared using the log-rank test. Statistical tests were conducted using the R package (version 4.0.1). Statistical significance was defined as a two-sided p value < 0.05.Results
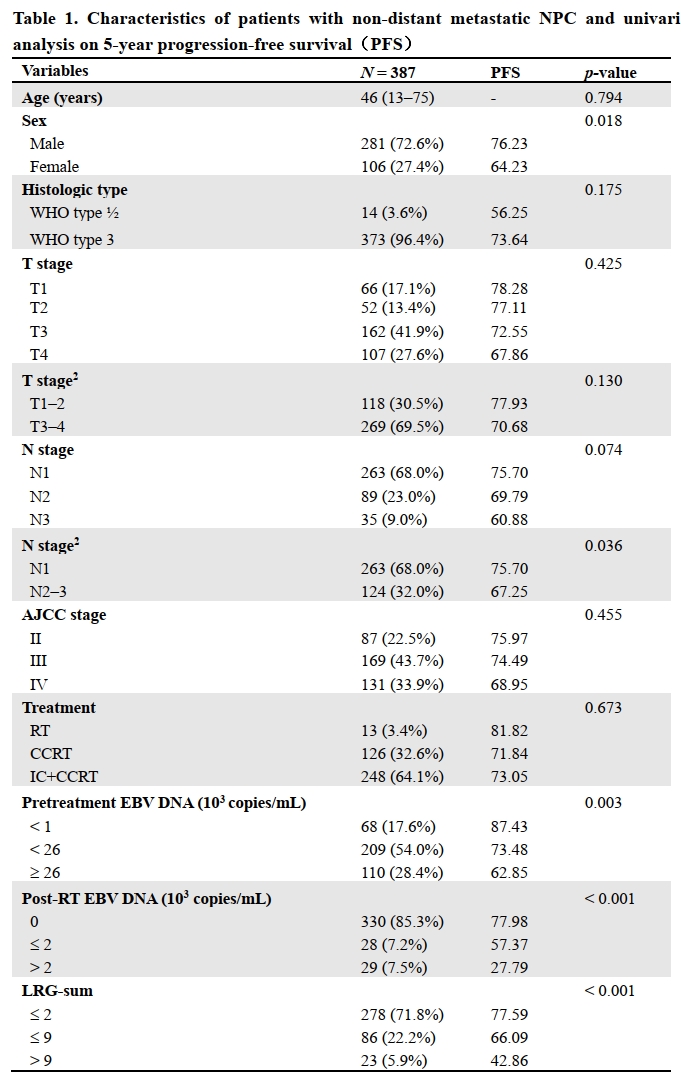
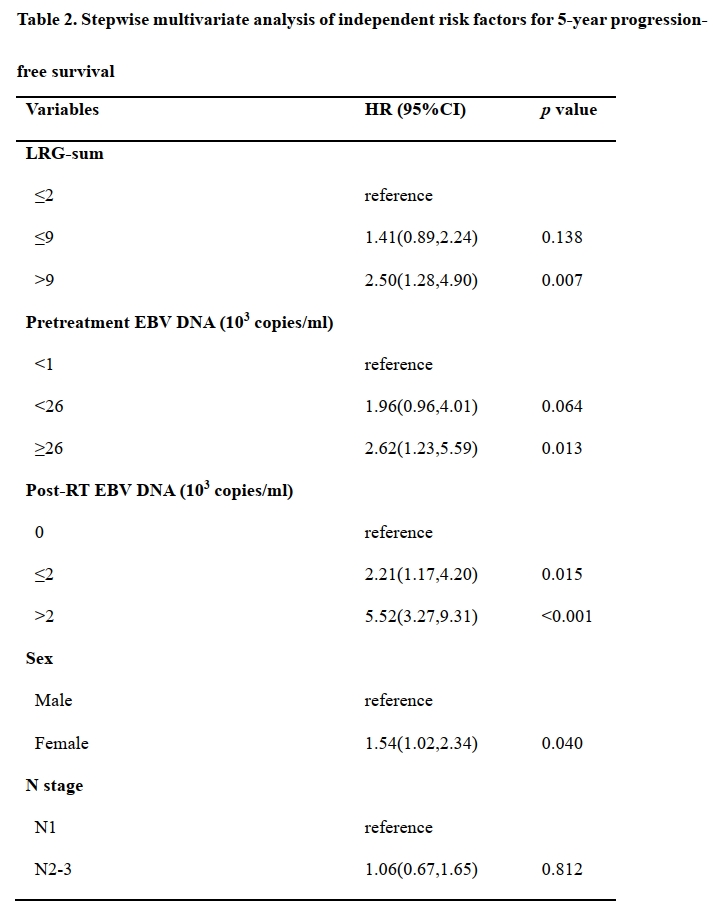
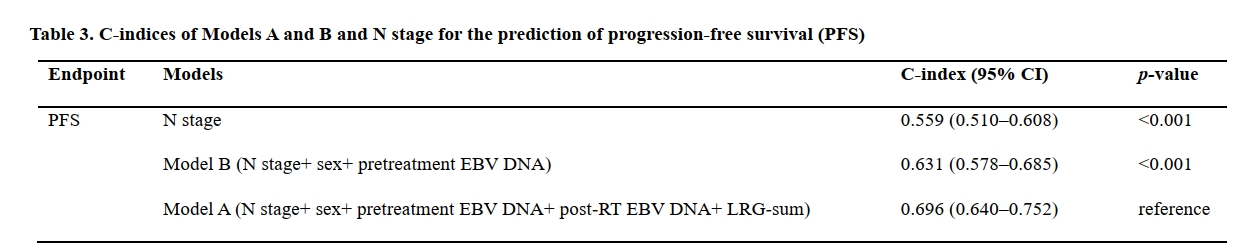
LRG-sum ≤ 9 and > 9 showed poorer 5-year PFS than LRG-sum ≤ 2 (66.1, 42.9, and 77.6%, respectively, p < 0.001, Tabel 1). The MRI-LRG scores sum (LRG-sum) was an independent prognostic factor for progression-free survival (PFS) (HR, 2.50; 95% CI 1.28–4.90, Tabel 2). Stepwise Cox regression model identified five risk factors of disease progression in NPC patients: LRG-sum, pretreatment EBV DNA, post-RT EBV DNA, sex and N stage (Tabel 2). A nomogram that based on the multivariate Cox regression model was shown in Figure 2A. Patients with 5-year PFS were divided into two subgroups: a low-risk group (total score ≤63.8) and a high-risk group (total score >63.8), corresponding 5-year PFS rates were 83.8% and 55.7%, respectively (Figure 2B). Furthermore, nomogram model A incorporating LRG had a higher C-index for PFS prediction than the model without LRG (Table 3).Conclusion
MRI-based LRG was an independent prognostic factor for PFS. A nomogram, based on LRG-sum, pretreatment EBV DNA, post-RT EBV DNA, sex and N stage factors, was proved to be useful to facilitate risk stratification in NPC. This approach might help to stratify treatment modalities and develop a more effective tailored surveillance program in patients with NPC.Acknowledgements
No acknowledgement found.References
1. Wee J, Tan EH, Tai BC, Wong HB, Leong SS, Tan T, et al. Randomized trial of radiotherapy versus concurrent chemoradiotherapy followed by adjuvant chemotherapy in patients with American Joint Committee on Cancer/International Union against cancer stage III and IV nasopharyngeal cancer of the endemic variety. J Clin Oncol. 2005; 23(27): 6730-8.
2. Kam MK, Teo PM, Chau RM, Cheung KY, Choi PH, Kwan WH, et al. Treatment of nasopharyngeal carcinoma with intensity-modulated radiotherapy: the Hong Kong experience. Int J Radiat Oncol Biol Phys. 2004; 60(5): 1440-50.
3. Lee AW, Sze WM, Au JS, Leung SF, Leung TW, Chua DT, et al. Treatment results for nasopharyngeal carcinoma in the modern era: the Hong Kong experience. Int J Radiat Oncol Biol Phys. 2005; 61(4): 1107-16.
4. Li WF, Zhang Y, Liu X, Tang LL, Tian L, Guo R, et al. Delayed clinical complete response to intensity-modulated radiotherapy in nasopharyngeal carcinoma. Oral Oncol. 2017; 75: 120-6.
5. Lv JW, Zhou GQ, Li JX, Tang LL, Mao YP, Lin AH, et al. Magnetic Resonance Imaging-Detected Tumor Residue after Intensity-Modulated Radiation Therapy and its Association with Post-Radiation Plasma Epstein-Barr Virus Deoxyribonucleic Acid in Nasopharyngeal Carcinoma. J Cancer. 2017; 8(5): 861-9.
6. Lambregts DMJ, Boellaard TN, Beets-Tan RGH. Response evaluation after neoadjuvant treatment for rectal cancer using modern MR imaging: a pictorial review. Insights Imaging. 2019; 10(1): 15.
7. Rodel C, Martus P, Papadoupolos T, Fuzesi L, Klimpfinger M, Fietkau R, et al. Prognostic significance of tumor regression after preoperative chemoradiotherapy for rectal cancer. J Clin Oncol. 2005; 23(34): 8688-96. 8. Kalisz KR, Enzerra MD, Paspulati RM. MRI Evaluation of the Response of Rectal Cancer to Neoadjuvant Chemoradiation Therapy. Radiographics. 2019; 39(2): 538-56.
Figures