1456
Evaluation of Peritoneal Fluid Flow in Response to Respiratory Motion Using MRI-Based CFD1Mechanical Engineering, University of Wisconsin-Madison, Madison, WI, United States, 2Radiology, University of Wisconsin-Madison, Madison, WI, United States, 3Obstetrics and Gynecology, University of Wisconsin-Madison, Madison, WI, United States, 4Biomedical Engineering, University of Wisconsin-Madison, Madison, WI, United States, 5Department of Radiology, University of Wisconsin-Madison, Madison, WI, United States
Synopsis
Keywords: Cancer, Cancer, Peritoneal, MRI-Based-CFD
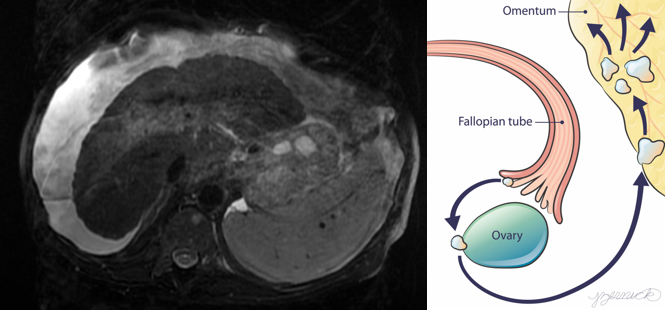
Motivation: High-grade serous ovarian cancer (HGSOC) is hypothesized to initiate at fallopian tubes and ovaries, and then spreads by detaching and floating through the peritoneal fluid to the upper abdomen.
Goal(s): Create a framework that could potentially assess HGSOC cell movement and deposition in the peritoneal cavity using MRI-based computational fluid dynamics.
Approach: Under the assumption that ovarian cancer cells are already prevalent in peritoneal fluid, ovarian cancer cell displacement can be analyzed using MRI-based CFD.
Results: Velocity maps and streamlines and WSS maps were created using CFD simulation results to predict cells transport to the lower peritoneum and diaphragm.
Impact: MRI-based CFD allows temporal and volumetric analysis of the peritoneal cavity and provides insight in ovarian cancer cell spread due to peritoneal fluid flow. Velocities and wall shear stress analysis can be used to identify stagnation points for cell deposition.
Introduction
HGSOC is hypothesized to initiate on the fallopian tube and ovary, and then spreads by detaching and floating through the peritoneal fluid to the upper abdomen1. The buildup of peritoneal fluid, or ascites, due to cancer contributes to the transport of cancer cells to the upper abdomen, where ovarian cancer typically progresses1. Therefore, there is a necessity to understand the role of peritoneal fluid flow in HGSOC cell transport and potential cancer spread. The peritoneum is made up of the parietal and visceral peritoneum which engulf the abdominal organs2. The upper portion of the peritoneal cavity is contiguous with the diaphragm thus influencing movement of the peritoneal cavity with respiration. Peritoneal fluid is produced by transudation from sub mesothelial vessels across the membrane of the peritoneal cavity3. This fluid exits the cavity through the upper portion of the abdomen near the diaphragm where it is filtered into the lymphatic system due to pressure induced during respiration4. The purpose of this fluid is to lubricate the movement of the gut during regular and irregular abdominal deforming activities. The MRI based computational fluid dynamics (CFD) framework presented here aims to determine the significance of wall shear stress (WSS) caused by the peritoneal fluid on the primary tumor site of the fallopian tube/ovaries due to respiratory motion as well as provide a velocity analysis of the trajectories of cancer cells throughout the peritoneal cavity.Methods
AcquisitionA young female volunteer was imaged using a SPGR (SPoiled Gradient Recalled Echo) acquisition sequence. A spatial 1.5625 mm isotropic resolution, temporal resolution of 3.1s, and a flip angle of 25° were used to obtain anatomical images of the abdominal cavity during several respiration cycles.
Model Creation
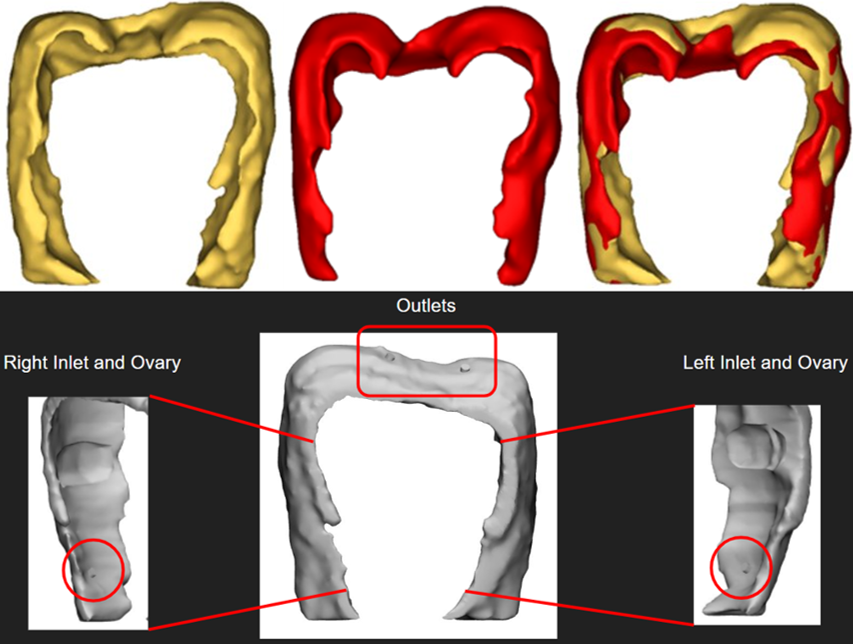
Averaged inspiratory and expiratory models were reconstructed using a semi-automated process with Mimics (Materialise, Belgium). These parts were later exported into 3-Matic (Materialise, Belgium) for the addition of inlet (base of the peritoneum) and outlet (diaphragm) vessels5. Enlarged ovary representations were also segmented and subtracted from the peritoneal cavity models to create a final idealized model.
CFD Simulations
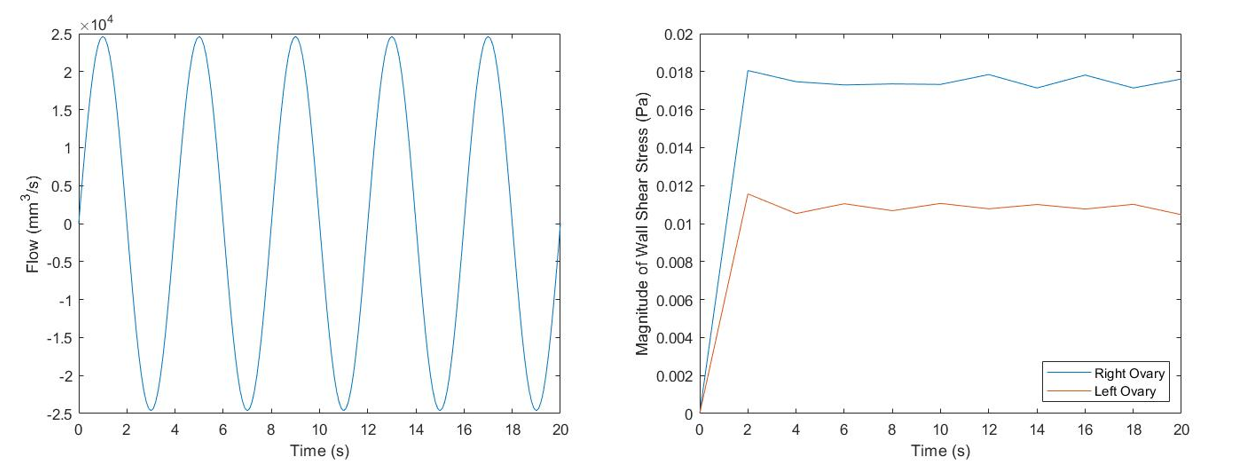
The change in volume of the peritoneum through respiration was used to generate a sinusoidal flow curve which was used as the inlet boundary condition. The outlet boundary condition was atmospheric pressure. Peritoneal fluid was assumed to have constant density of 1015 kg/m3 6 and viscosity of 1.425 cP 7. A breathing rate of 15 breaths/min was considered and five consecutive breathing cycles were simulated. Womersley number was calculated to be 10.6 indicating pulsatile flow, therefore an unsteady CFD simulation was performed using CONVERGE (Madison, WI) to run the simulation and Tecplot (Bellevue, WA) to visualize the CFD results.
Results
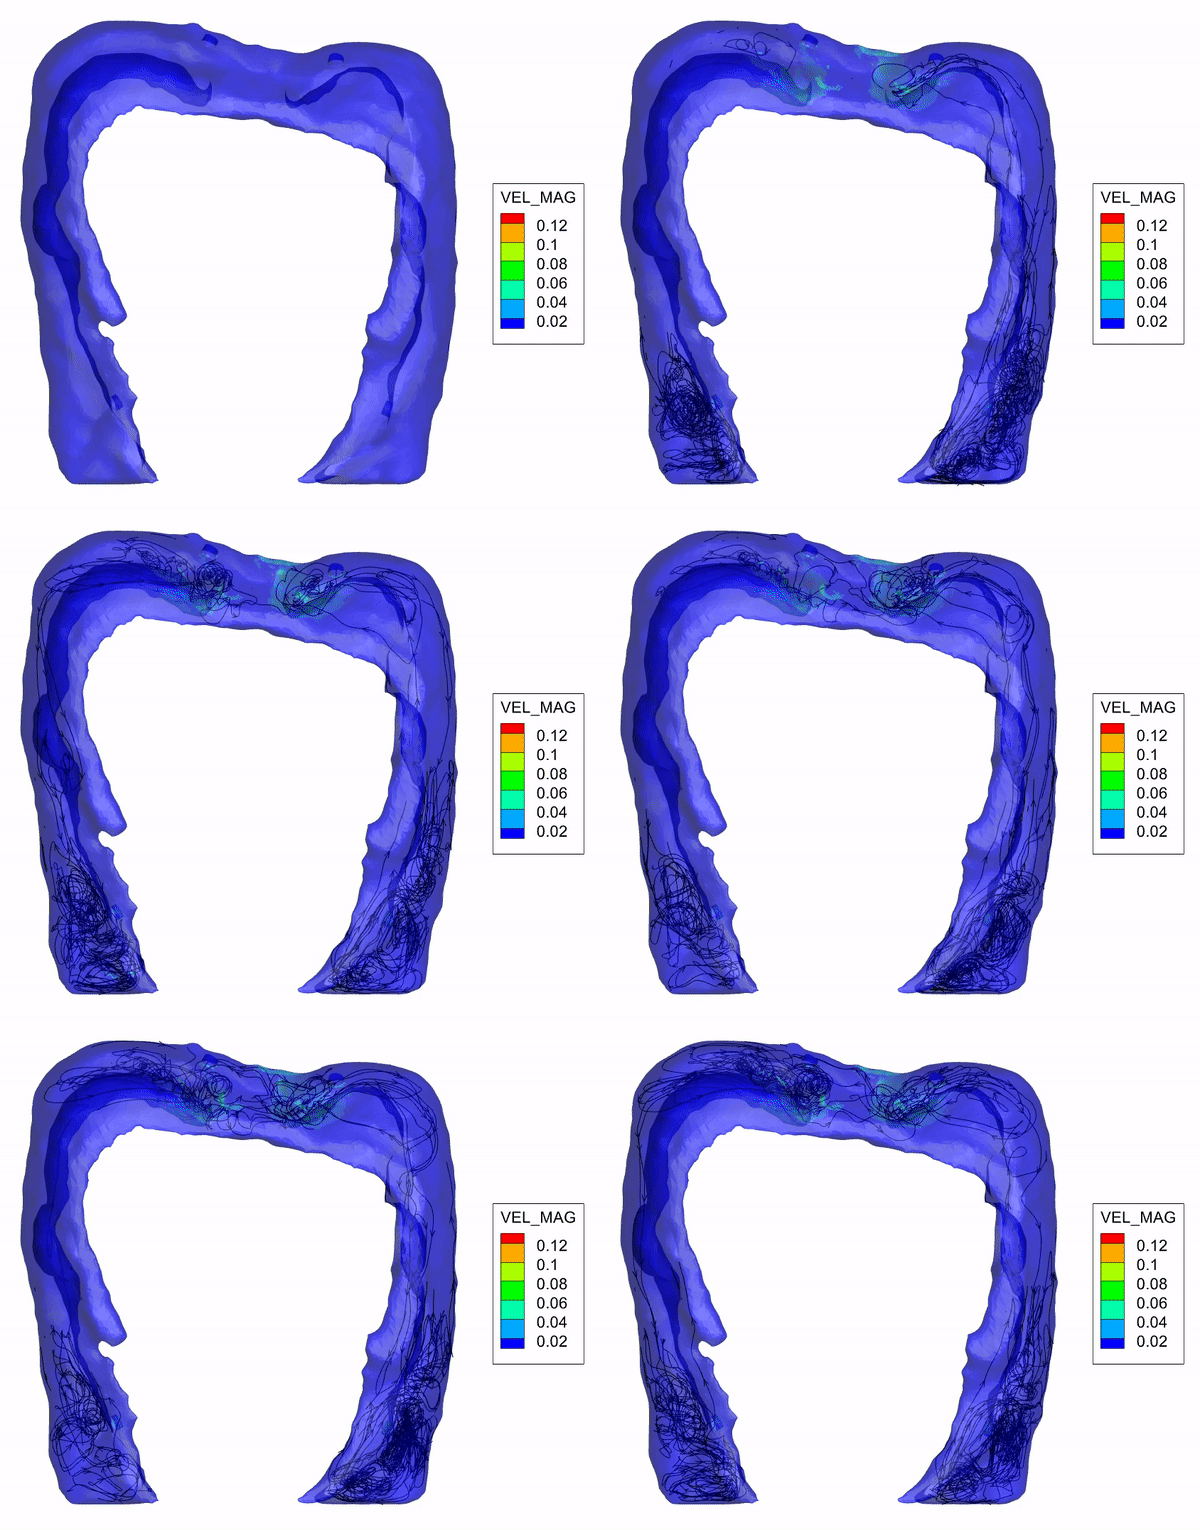
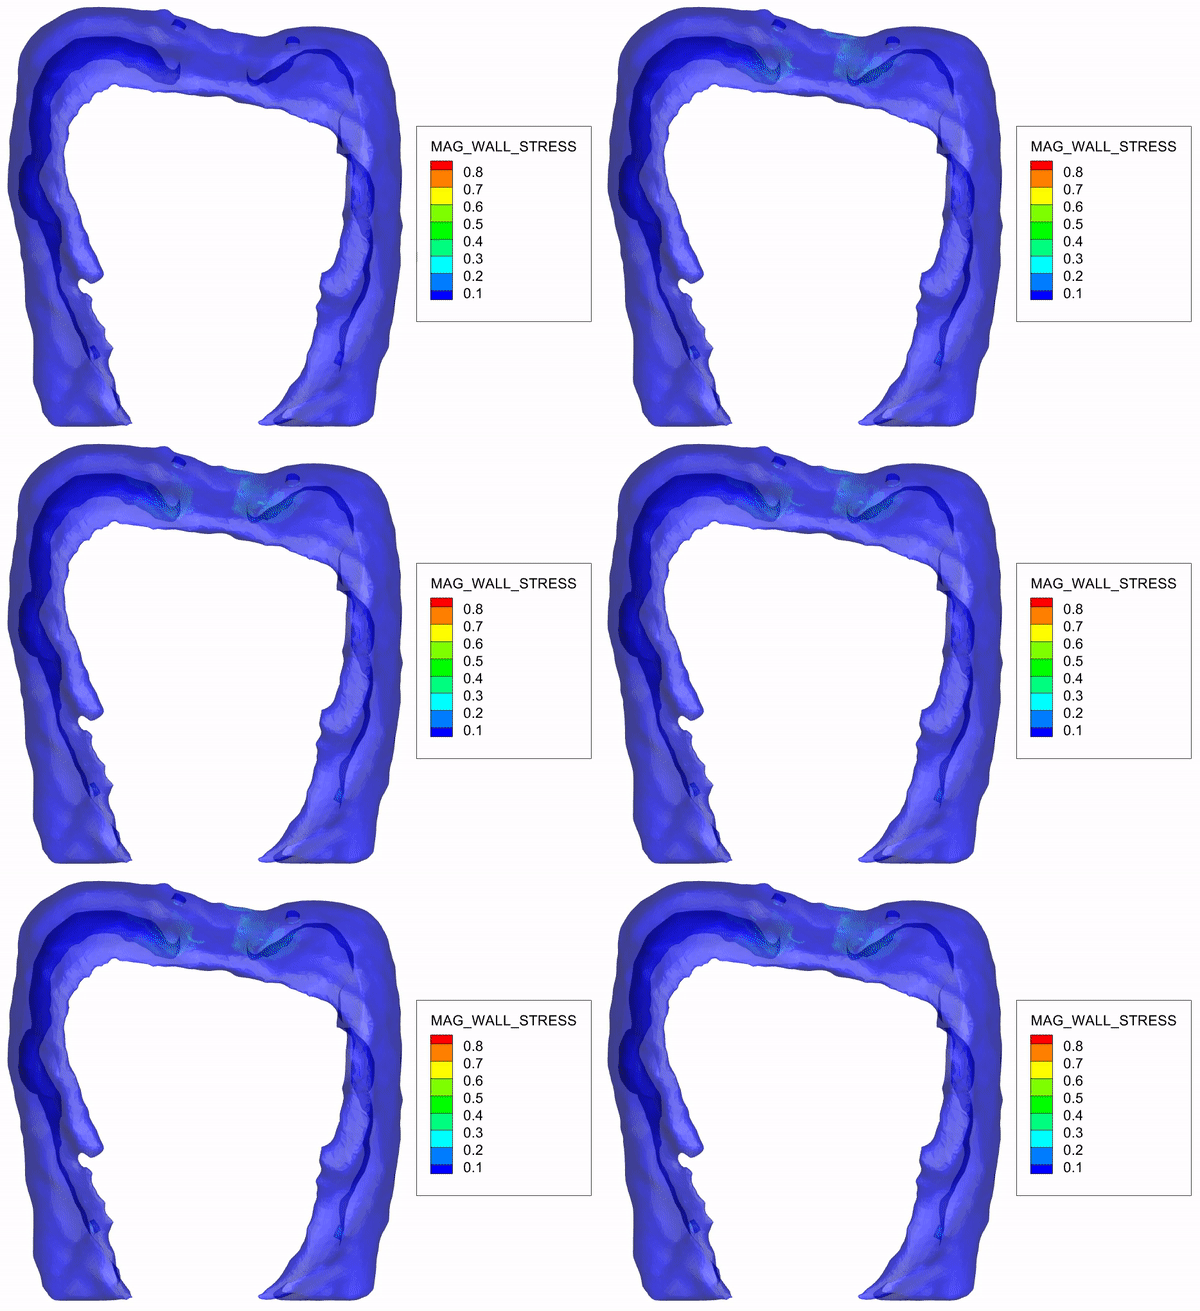
The volume of the peritoneum at inspiration and expiration were 1.92 x 106 mm3 and 1.82 x 106 mm3, respectively. The CFD simulation was successfully executed. Figure 3 and 4 show contour maps of velocity and WSS on the final model respectively. High velocity profiles are observed close to the inlet and outlet for both expiration and inspiration alongside constant WSS value in the parietal and visceral walls.Discussion
Velocity contour maps show vortical flow in the lower peritoneum and the streamlines can map transportation pathways of dispersed cancer cells within the peritoneum. Peritoneal flow changes during the respiration cycle. Simulations showed that the location of the ovaries are stagnation points where the cancerous cells would be able to exude into the peritoneal cavity and potentially be filtered into the lymphatic system in the diaphragm. WSS on the ovaries did not vary temporally despite the oscillatory inlet boundary condition. Further experimentation will be needed to determine if 0.018 Pa is sufficient to dislodge cancer cells from the ovaries.Conclusions
MRI-based CFD provided an idealized model of peritoneal fluid flow and a framework for future studies regarding the analysis of peritoneal flow. Velocity streamlines through the peritoneal cavity display potential displacement of cancerous cells towards the diaphragm and lower peritoneum if some cancerous cells have crossed the peritoneal visceral membrane. Numerous assumptions were made to set up the simulations and create the models and their effects will be considered for future work where we will aim to distribute the inlet boundary conditions between several vessels spread out through the visceral peritoneal layer and include other sources of motion that affect the peritoneal cavity. In conclusion, the MRI-based CFD method presented here has the potential to enhance the ability of MRI to aid in better understanding of ovarian cancer and its ability to spread to other organs.Acknowledgements
We would like to acknowledge support from NCI (R01 CA240965-01A1) and GE Healthcare which provides research support to University of Wisconsin-Madison.
References
1. Micek HM, Visetsouk MR, Fleszar AJ, Kreeger PK. The Many Microenvironments of Ovarian Cancer. In: Advances in Experimental Medicine and Biology. Vol 1296. Springer; 2020:199-213. doi:10.1007/978-3-030-59038-3_12
2. Isaza-Restrepo A, Martin-Saavedra JS, Velez-Leal JL, Vargas-Barato F, Riveros-Dueñas R. The peritoneum: Beyond the tissue - A review. Front Physiol. 2018;9(JUN). doi:10.3389/fphys.2018.00738
3. Ducharme NG, Desrochers A, Fubini SL, et al. Surgery of the Bovine Digestive System. In: Farm Animal Surgery. Vol 1. ; 2017:223-343.
4. Pannu HK, Oliphant M. The subperitoneal space and peritoneal cavity: basic concepts. Abdom Imaging. 2015;40(7):2710-2722. doi:10.1007/s00261-015-0429-5
5. Abu-Hijleh MF, Habbal OA, Moqattash ST. The Role of the Diaphragm in Lymphatic Absorption from the Peritoneal Cavity. Vol 186.; 1995.
6. Abdollahi A, Nozarian Z. Diagnostic Value of Measurement Specific Gravity by Refractometric and Dipstick Method in Differentiation between Transudate and Exudate in Pleural and Peritoneal Fluid. Iran J Pathol. 2016;11(4):363-369.
7. Ott DE. Laparoscopy and Tribology: The Effect of Laparoscopic Gas on Peritoneal Fluid. J Am Assoc Gynecol Laparosc. 2001;8(1):117-123.
Figures