1400
Predicting Anatomical Tumor Growth in Pediatric High-grade Gliomas via Denoising Diffusion Models1ETH Zurich, Zurich, Switzerland, 2Yale University, New Haven, CT, United States, 3École Polytechnique Fédérale de Lausanne, Lausanne, Switzerland, 4Kinderspital Zurich, Zurich, Switzerland, 5University of California San Francisco, San Francisco, CA, United States
Synopsis
Keywords: AI Diffusion Models, Machine Learning/Artificial Intelligence, Oncology, Cancer, DMG, Diffuse Midline Glioma
Motivation: Pediatric diffuse midline gliomas are associated with a poor prognosis, leaving radiotherapy as standard of palliative care. Personalized radiation regimes could maximize the benefit for the patient, and consequently improve clinical outcomes.
Goal(s): This study explores a state-of-the-art computer vision method to predict the anatomical growth of tumors which could inform tailored radiotherapy treatments.
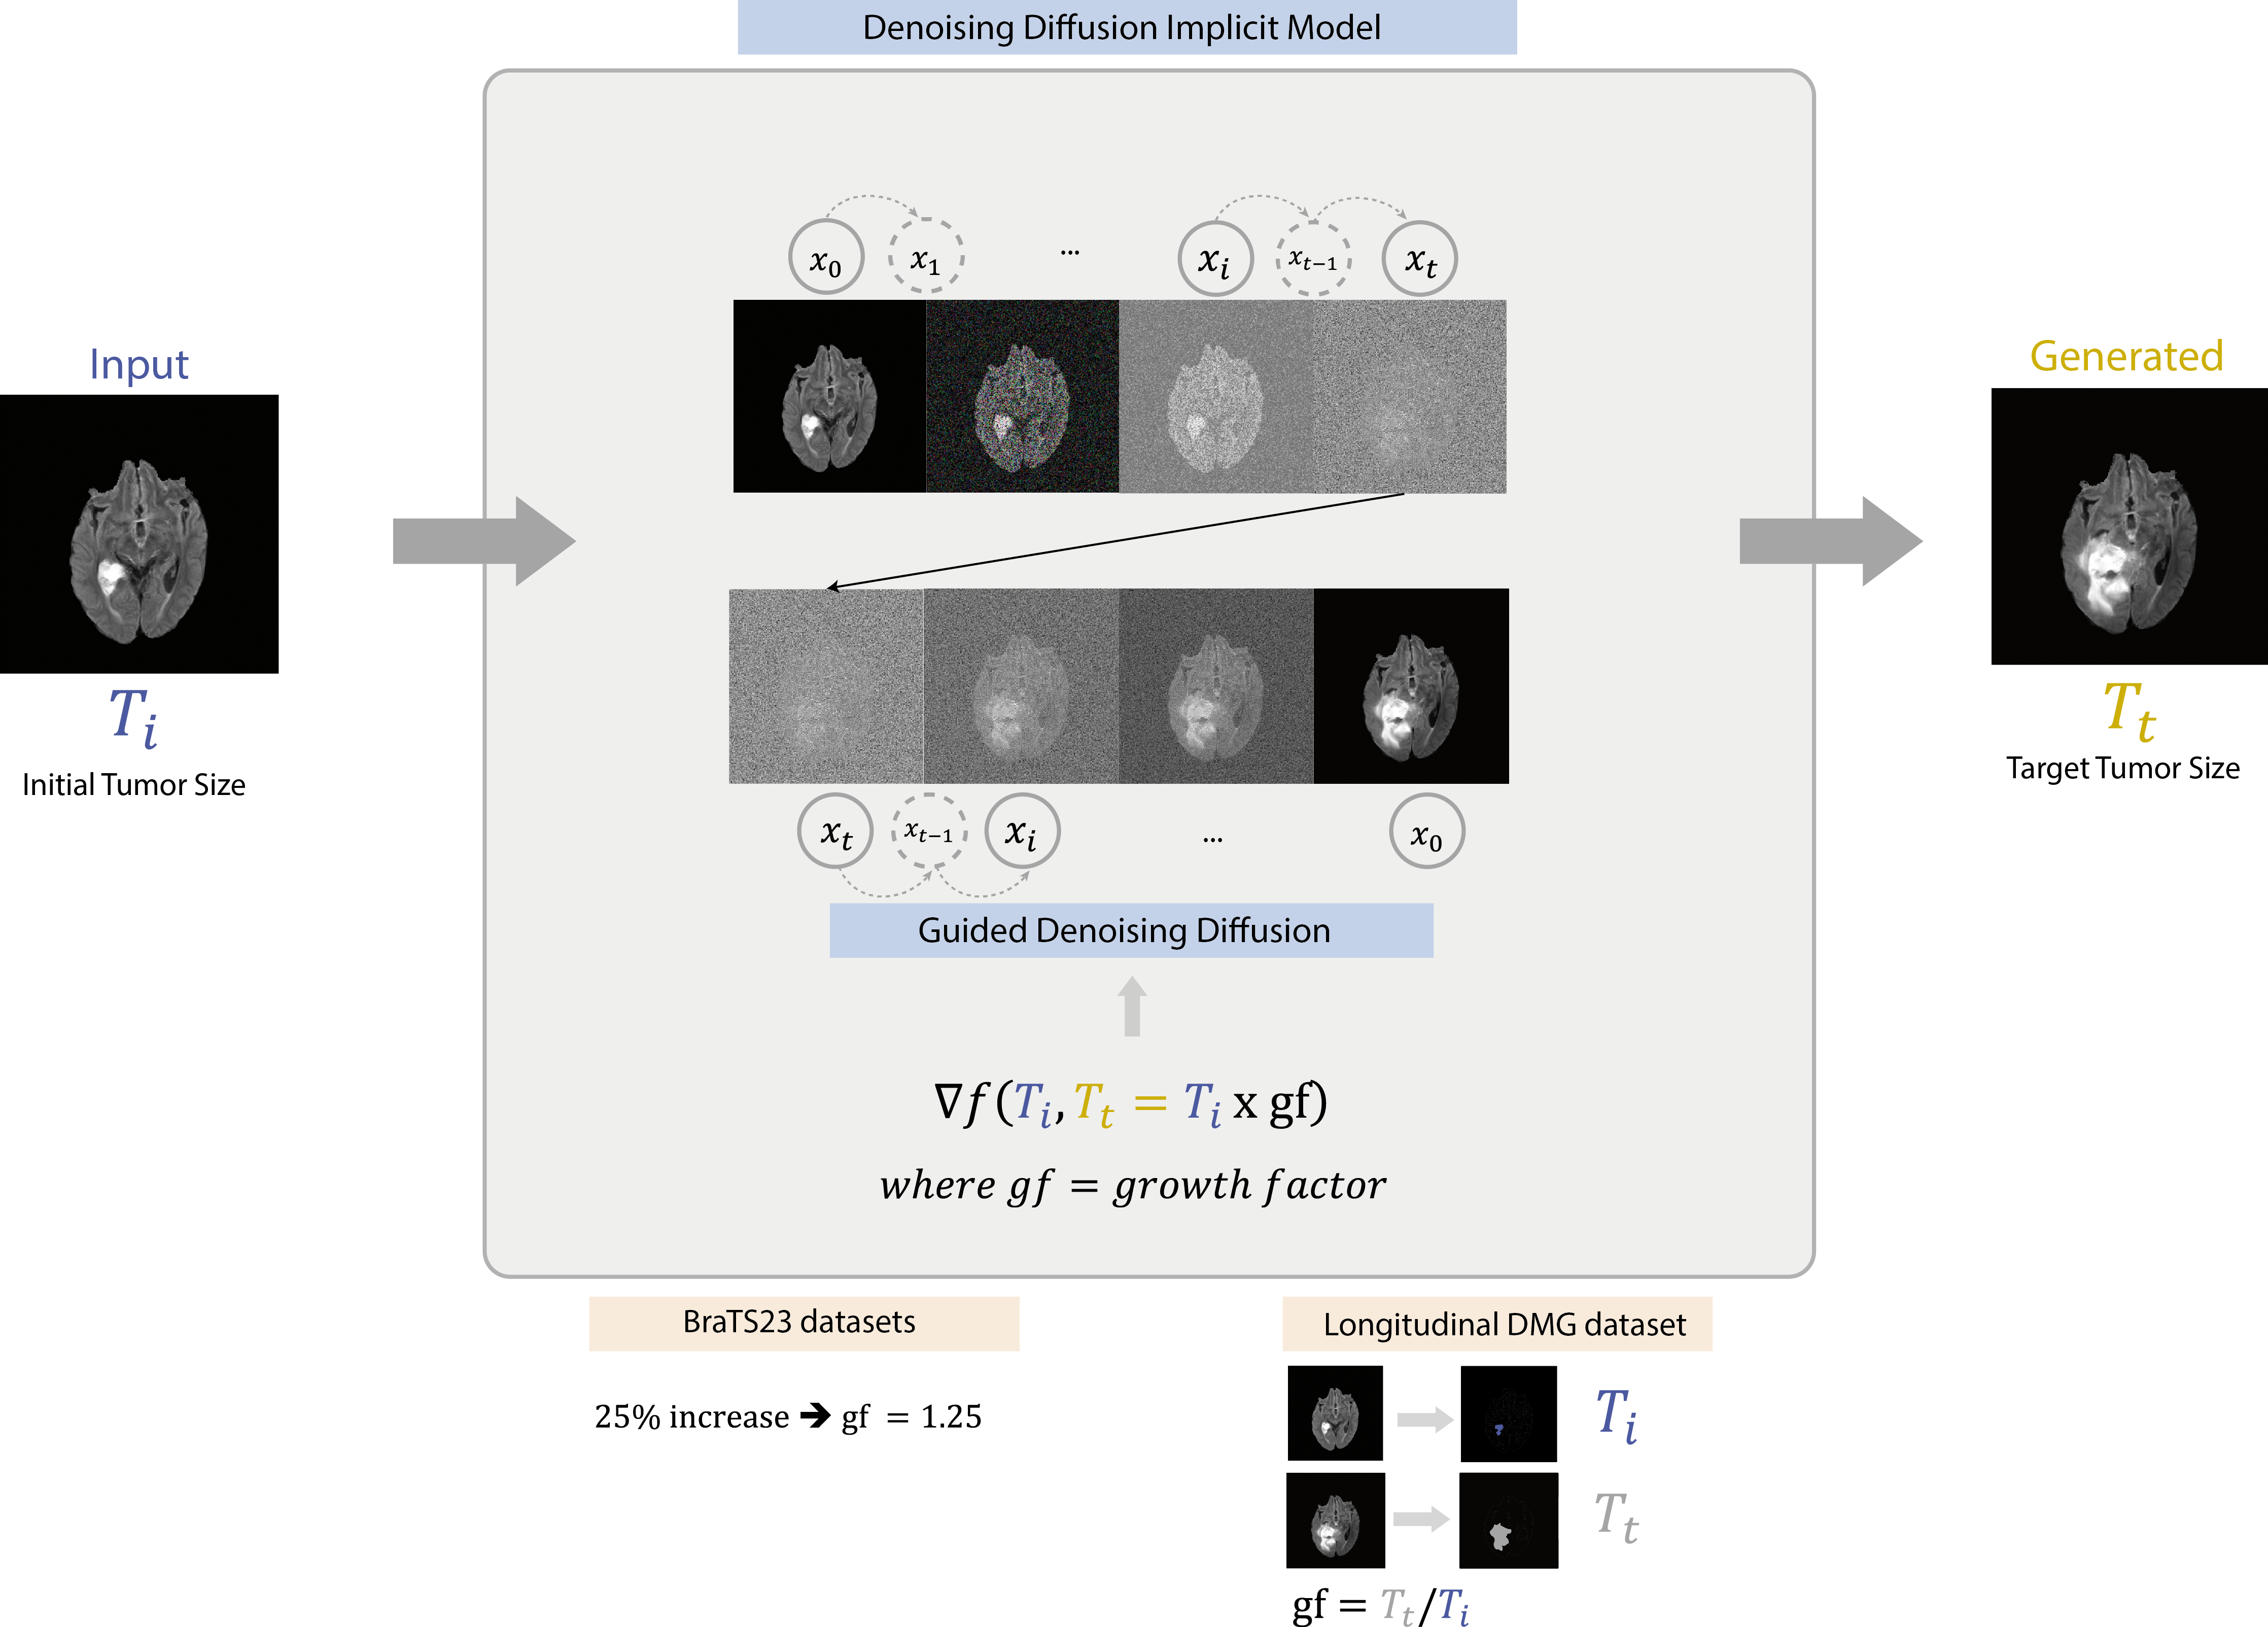
Approach: A denoising diffusion implicit model is employed to generate realistic, high-quality magnetic resonance imaging scans of enlarged tumor sizes starting from a baseline image.
Results: Our proof-of-concept study demonstrates promising results on an external longitudinal pediatric dataset, highlighting the method’s potential to realistically predict visual tumor growth.
Impact: We demonstrate realistic predictions of anatomical (pediatric) brain tumor growth using a generative denoising diffusion implicit model. This enables personalized predictions of tumor growth trajectories to guide localized therapies such as geometric dose shaping for radiotherapy delivery.
Introduction
Magnetic Resonance Imaging (MRI) plays a crucial role in radiographic treatment response assessment for neurological disorders, including brain tumors 1–3. Amongst different tumor entities, pediatric diffuse midline glioma (DMG) stands out with a poor prognosis, exacerbated by patients’ ineligibility for surgery. Radiotherapy remains the standard of palliative care for DMGs, making it essential to maximize its benefits for the individual. Apart from defining the gross tumor volume, identifying high-risk brain regions of likely disease progression could guide the design of personally adapted geometric dose distributions. Currently, tumor progression sites estimation is driven by the clinician’s experience, rather than by the patient’s individual characteristics 4,5. In this work, we explore state-of-the-art computer vision approaches to predict the anatomical tumor growth which would drive personalized planning of localized therapeutic intervention.Current advances in network architecture design increased the popularity of generative models for medical imaging data 6–9. Recently, denoising diffusion implicit models (DDIM), which learn an iterative denoising process for a given data distribution, outperformed popular generative adversarial networks (GANs) and variational autoencoders (VAEs) 10,11. Naturally, the next step is to explore anatomical image generation using DDIMs. The aim of this study was a proof-of-principle to generate realistic and clinically relevant anatomical representations of the progression of pediatric DMG image slices through DDIMs.Methods
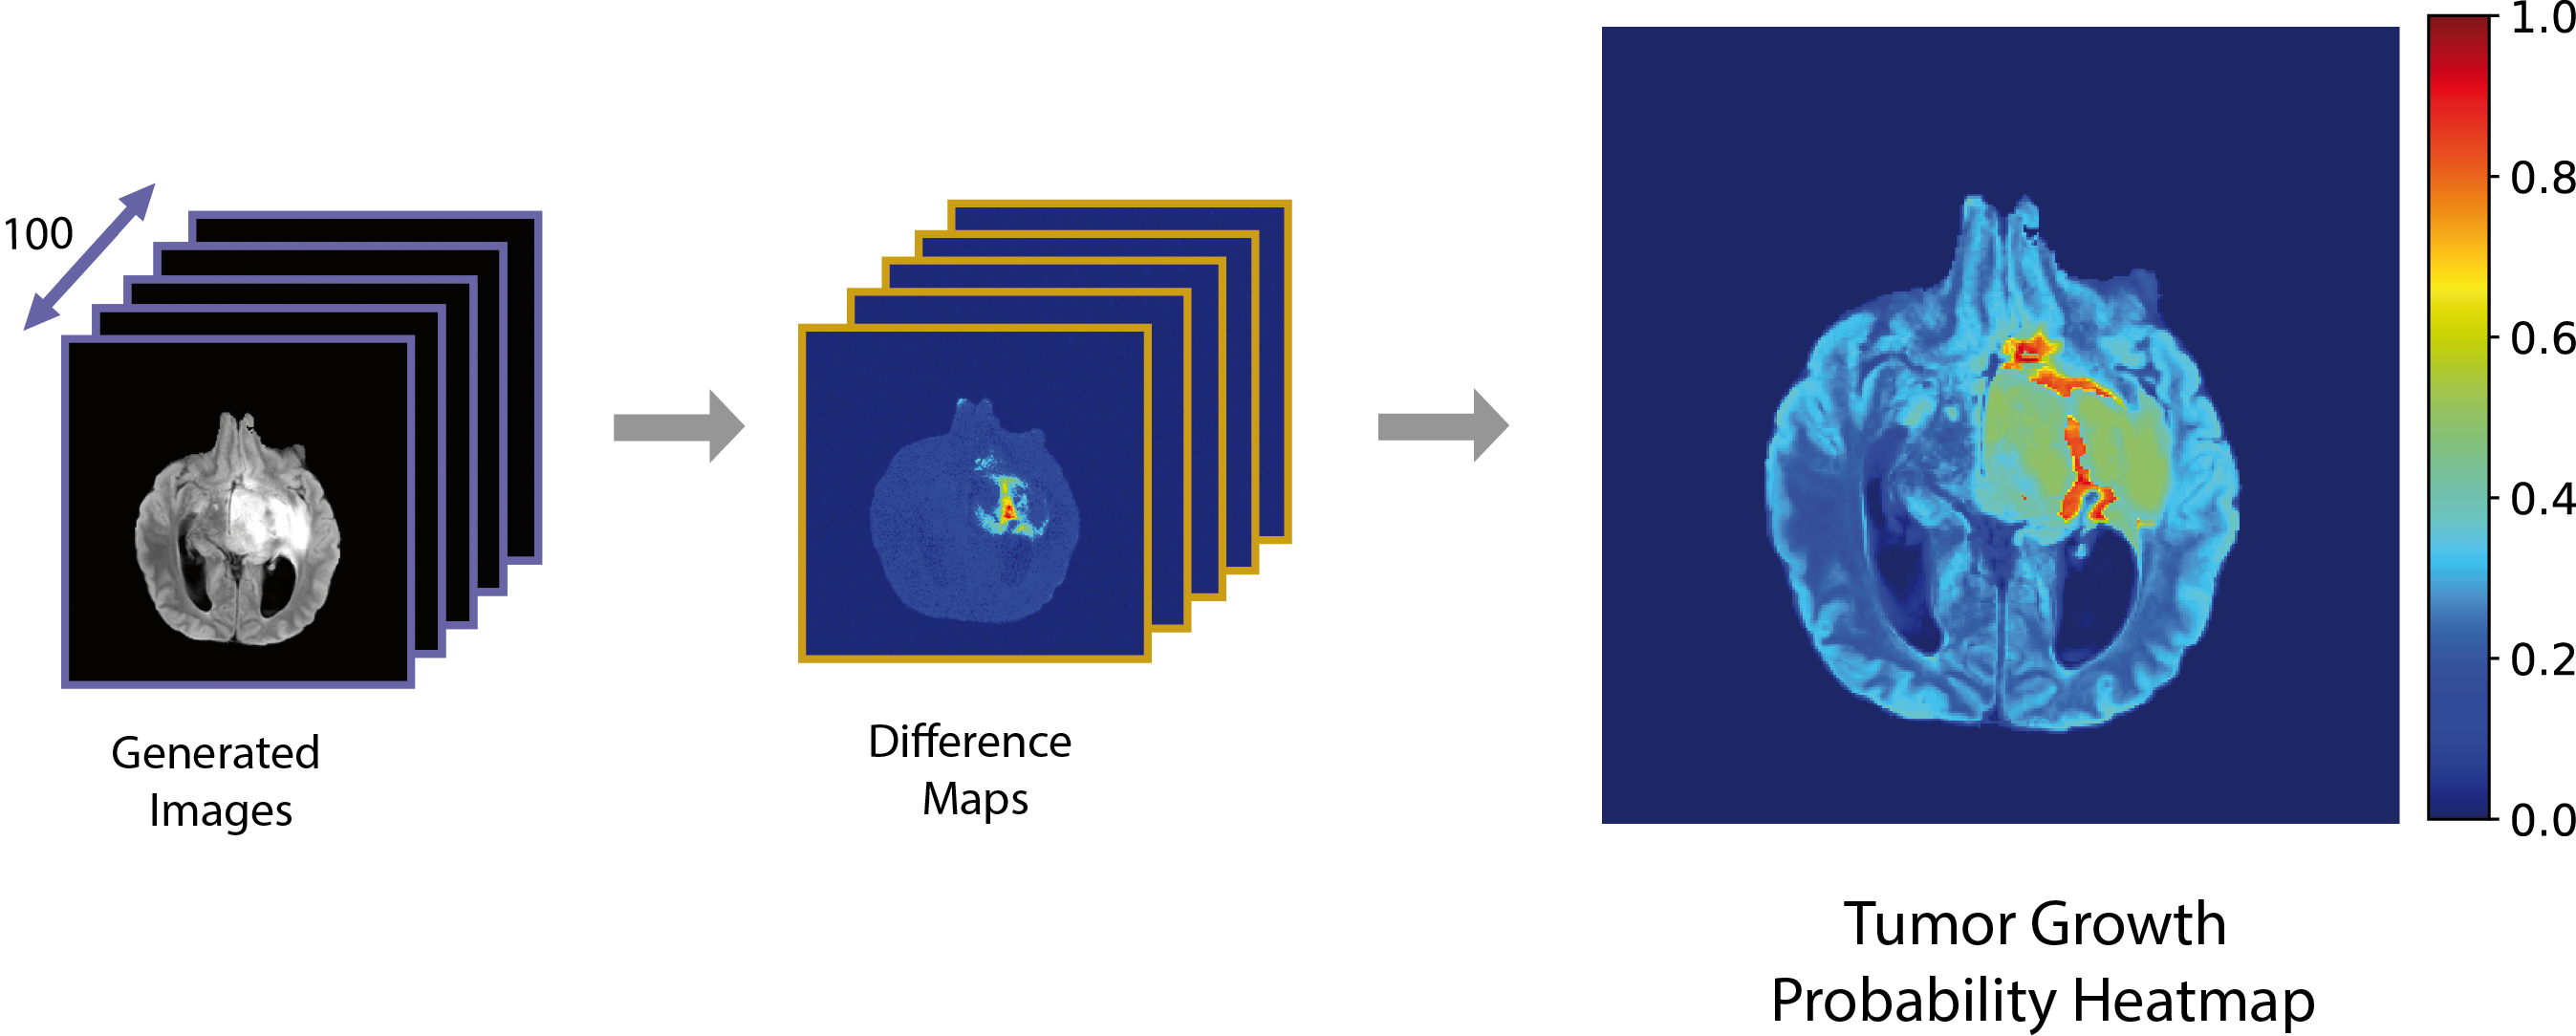
This study used data from the BraTS23 challenge: 101 pediatric DMG and astrocytoma patients and 1126 adult diffuse glioma patients 12–15. Multi-contrast coregistered 3D MRI scans, with 1mm mean in-plane resolution are available: T1-weighted, T1-Contrast Enhanced (T1-CE), T2-weighted, and T2-FLAIR. This study adopts a 2D approach, considering axial slices covering 95% of tumor-prevalent brain regions. The data is split by patient into training (90%), validation (1%), and testing (9%). An independent pediatric DMG dataset of longitudinal T2-FLAIR scans from five patients treated within the DMG Center Zurich is included for external validation.We employ a DDIM-based framework, integrating the guidance of a regressor in the denoising process which enables tumor resizing to a defined target 16,17 (Fig.1). We train two models: multi-contrast using all available contrasts and single-contrast using T2-FLAIR only. Hyperparameter tuning was conducted for the diffusion and regression models in the internal validation subset. The optimal single-contrast model was trained for 80,000 epochs while the multi-contrast model for over 150,000, with a noise level of 400 and a regressor scale of 100,000. Leveraging the model’s inherent probabilistic nature, we compile tumor growth probability heatmaps through iterative generations. Test set performance was evaluated using image quality measures: Frechet Inception Distance (FID), Structural Similarity Index (SSIM). Qualitative evaluation involved comparing extracted radiomic features18 and visual classification of real vs generated images by a panel of radiology experts.
Ultimately, the single-contrast model was applied to longitudinal instances of the DMG dataset. The predictions were compared to the ground truth scans using the DICE coefficient 19,20.
Results and Discussion
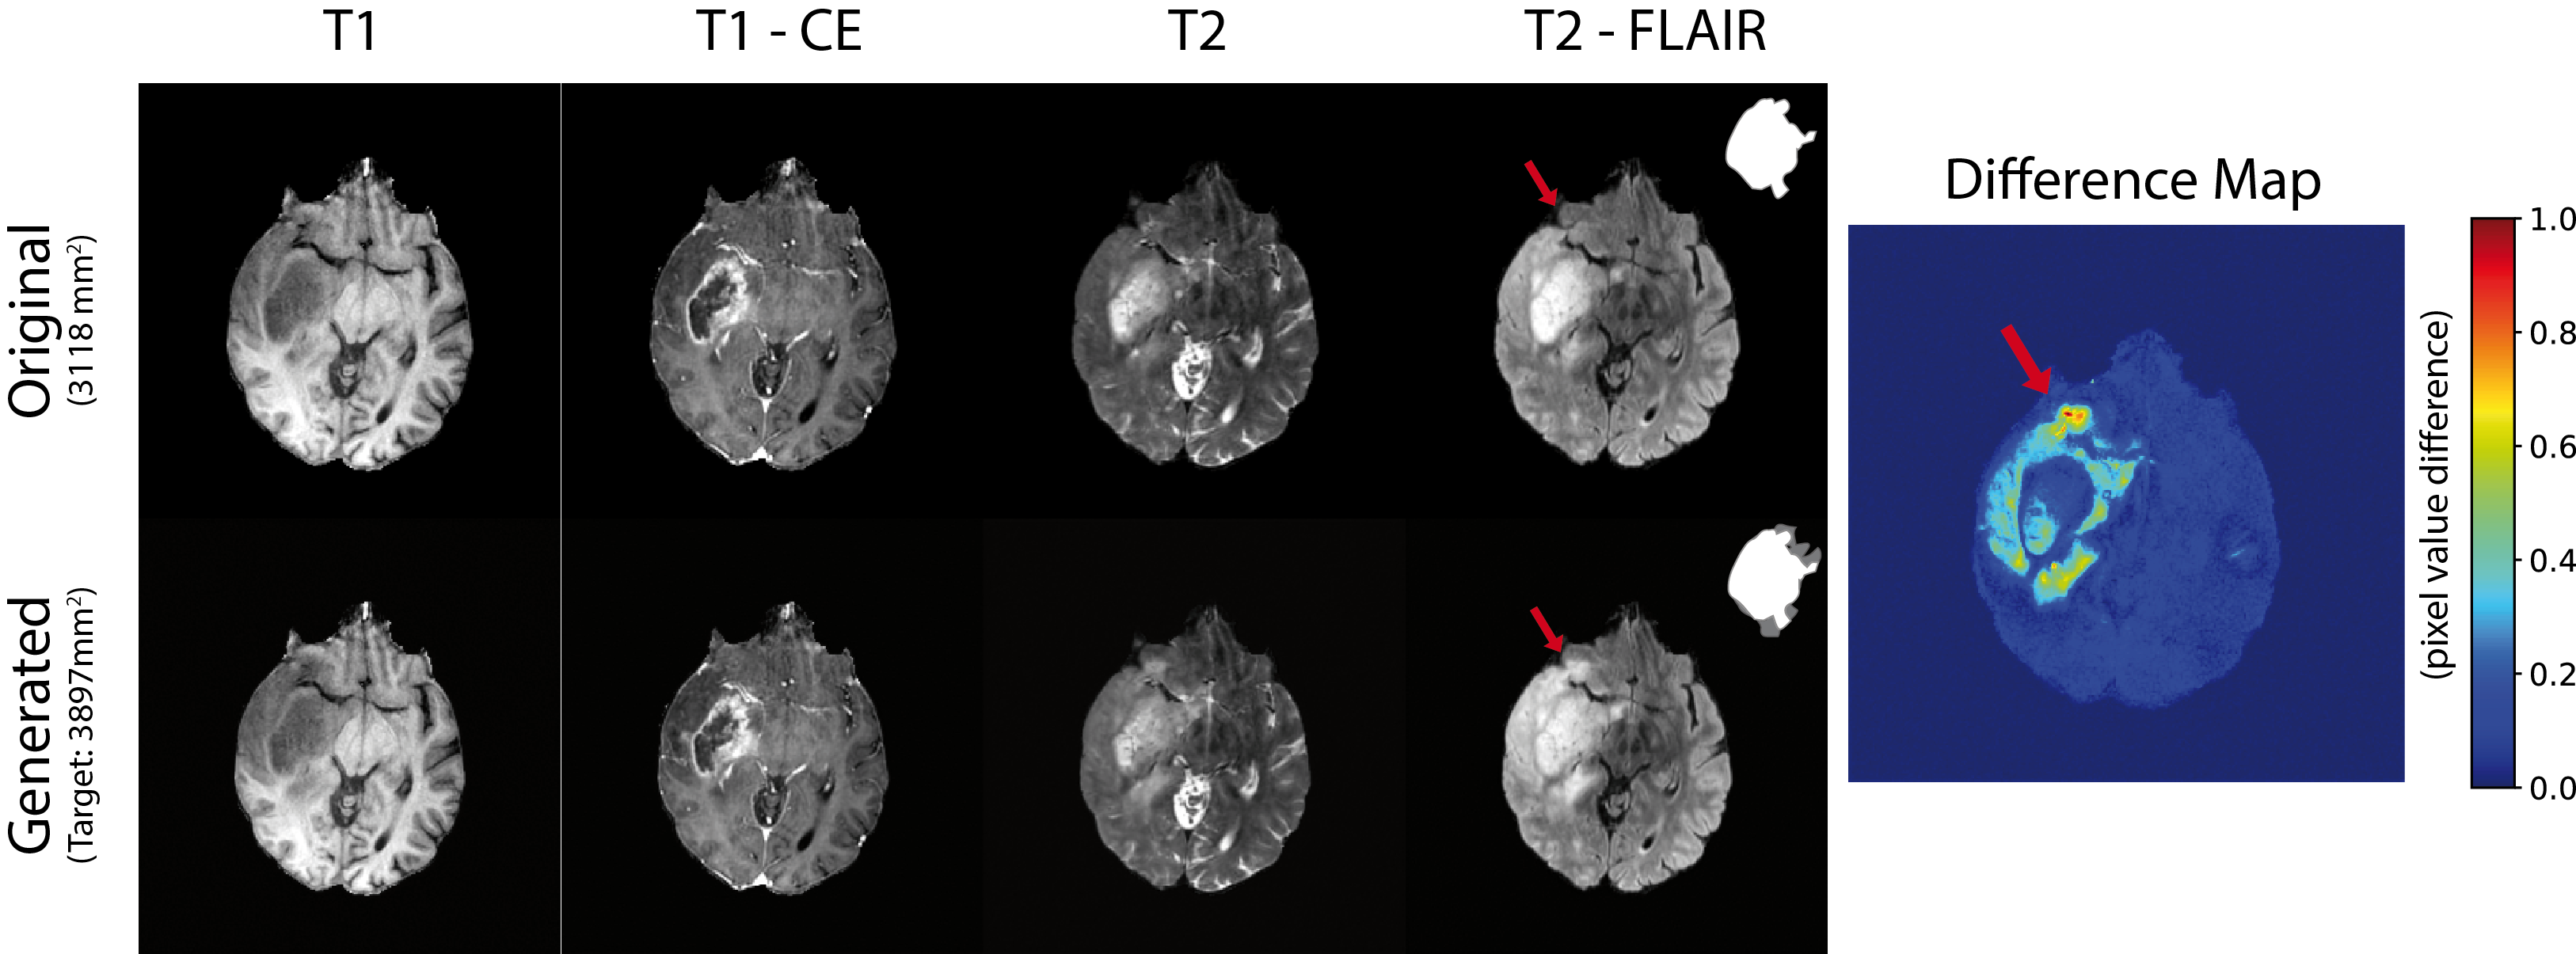
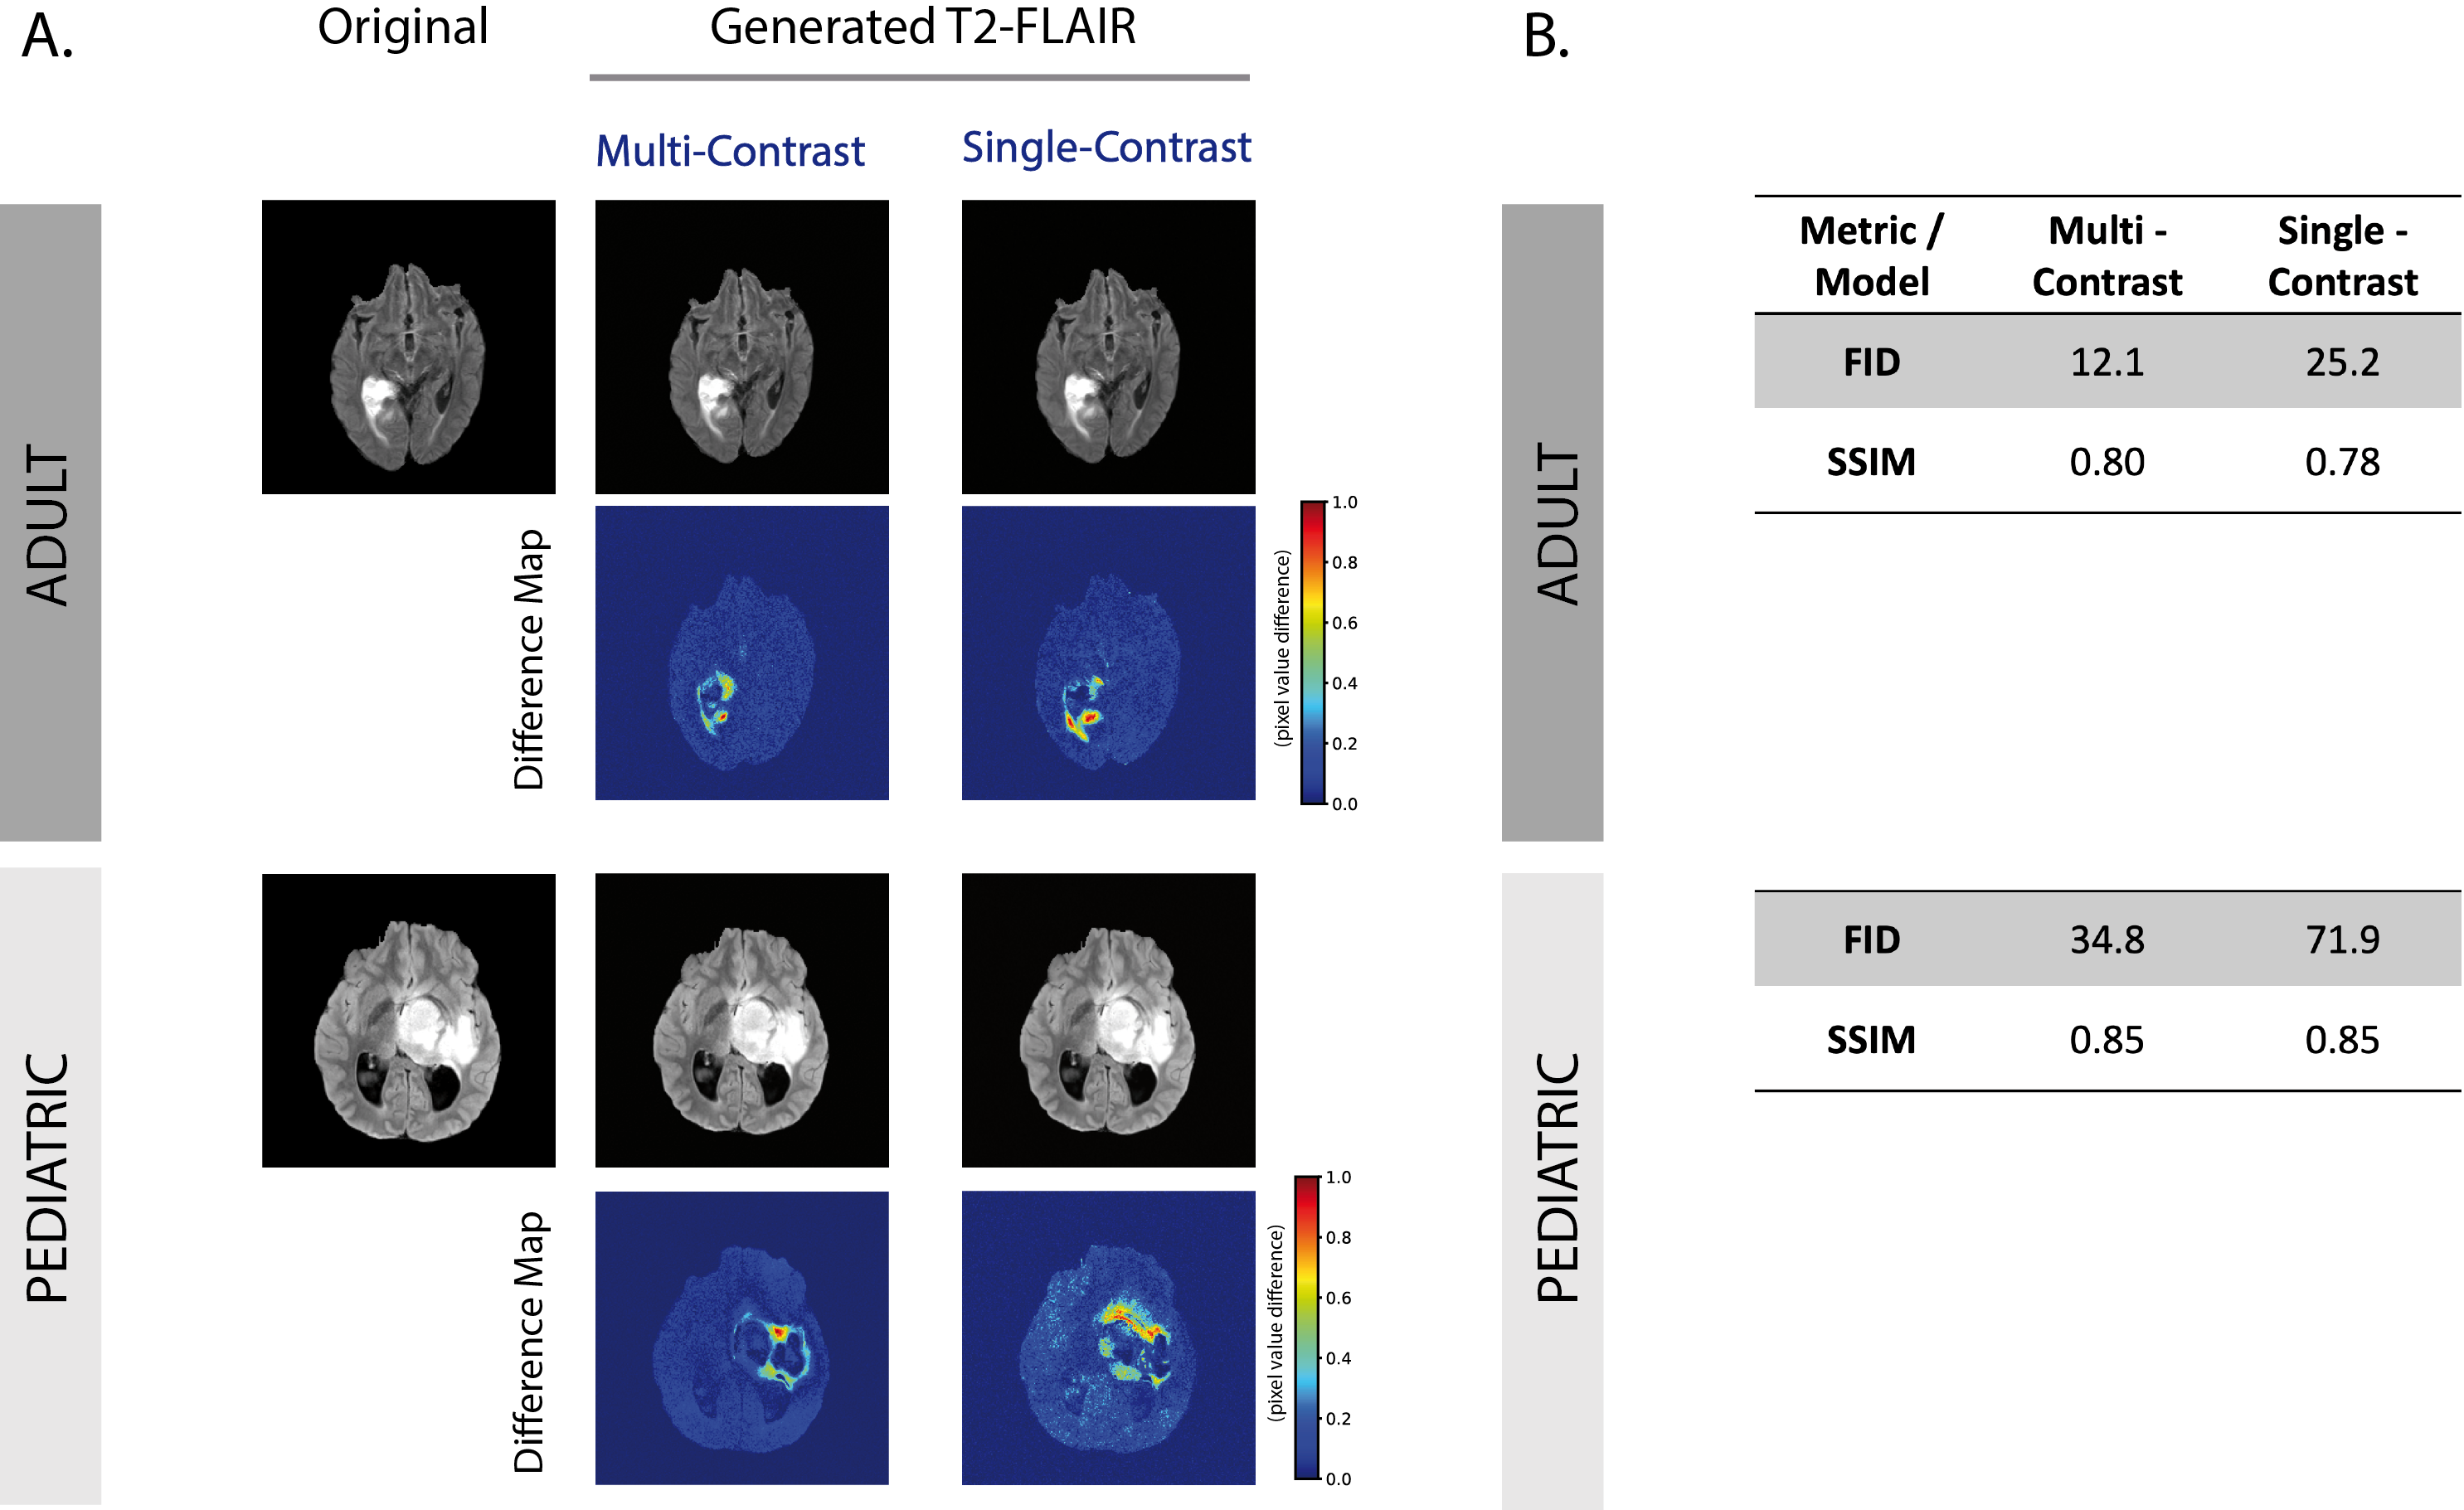
Fig.2 shows a representative test case for successfully adjusting the tumor size (+25%) while preserving the anatomical characteristic features. The segmentation confirms a 5% variation in the targeted tumor size.The high fidelity of the generated images is supported by an FID of 12.4 and 0.8 SSIM on the test set for the multi-contrast adult samples, while the considerably smaller pediatric dataset yields a 34.8 FID and 0.84 SSIM. Similar quality tumor growth predictions are obtained with the single-contrast model (Fig.3).
The expert radiologists’ assessment reveals the generated samples are very difficult to distinguish from real MRI scans, with a mean recall and precision of 0.51. Additionally, the extracted tumor radiomic features from real and generated images match. The predictions’ consistency is evident in the tumor growth probability map, where only regions adjacent to the tumor are altered (Fig.4).
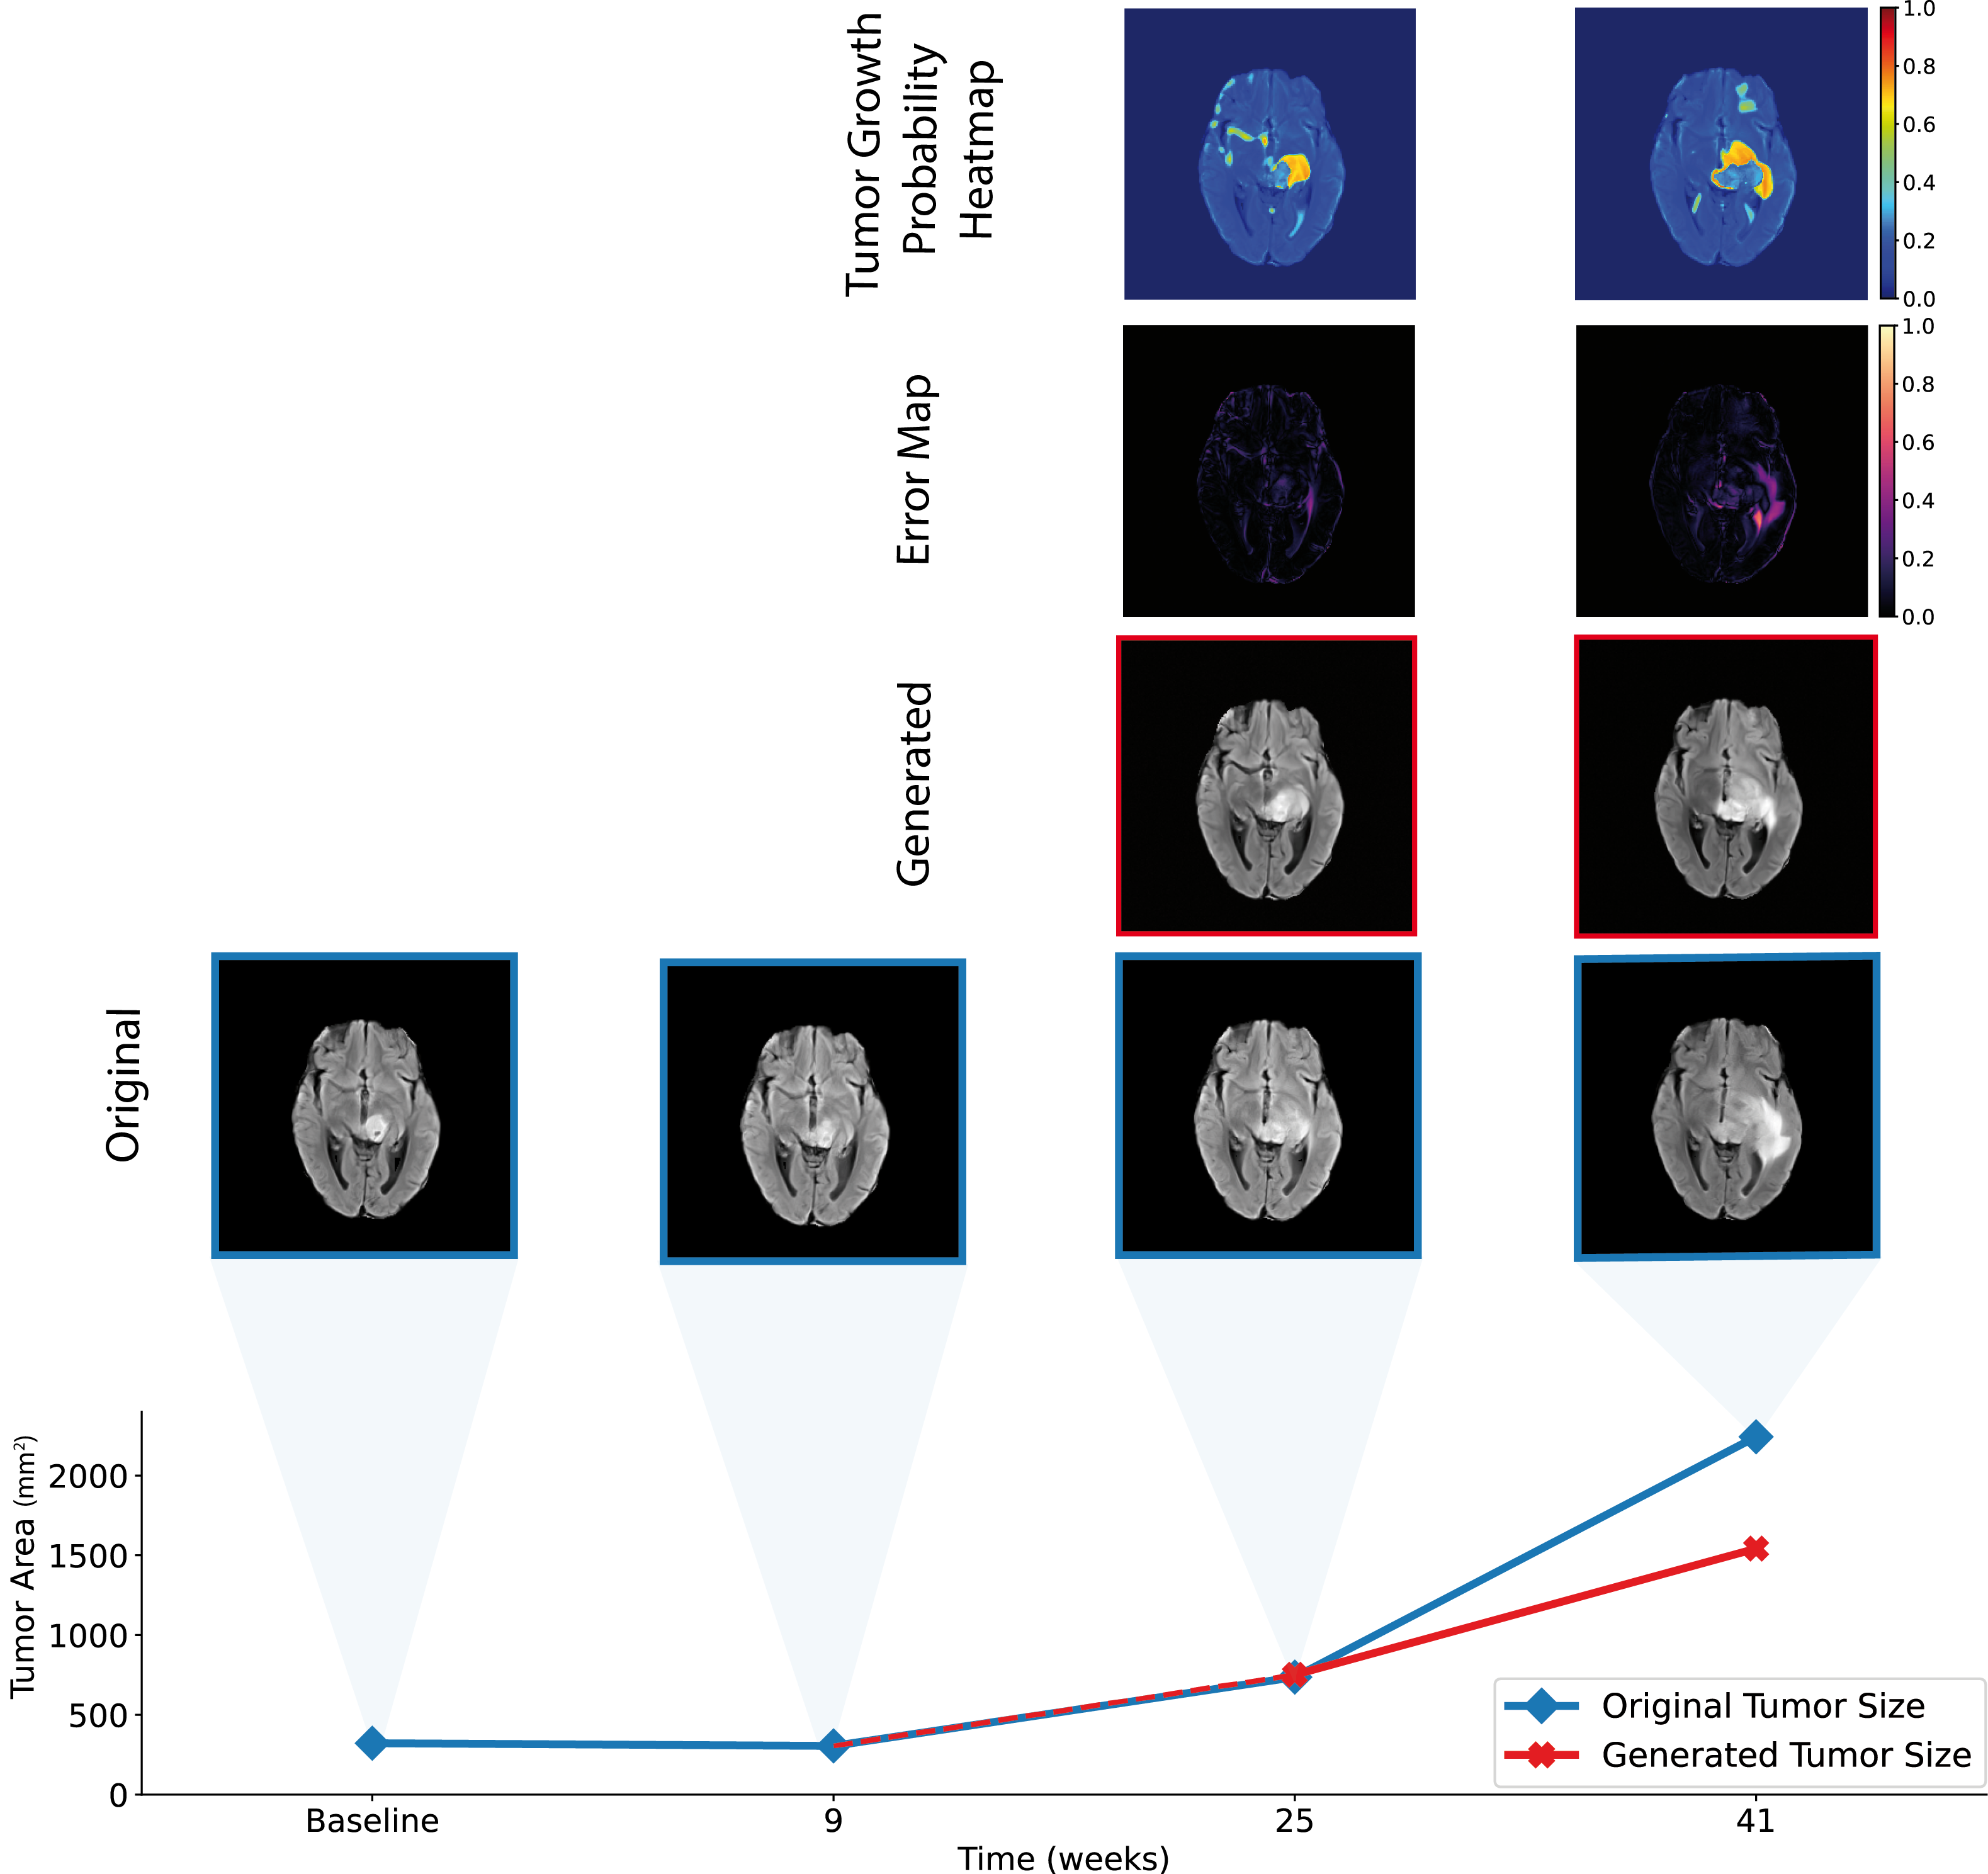
When applied to the external validation DMG longitudinal scans, the model generates anatomical predictions that closely resemble the original scans for tumor progression (mean DICE of 0.8). Notably, the direction and extent of tumor growth align remarkably while preserving the anatomy of the brain slice (Fig.5).
Conclusions
Our model is the first to produce high-quality samples that accurately conform to growth patterns in clinical cases. The proposed model was primarily tailored for multi-contrast inputs, yet it delivered promising results on the T2-FLAIR DMG subset. Despite encouraging results, quantitative validation on larger longitudinal datasets is required, to ensure the robustness of the proposed method. We anticipate better prediction accuracy with the use of multiple contrasts.The proposed method enables a personalized approach for defining target regions in radiation therapy which could translate to improved clinical outcomes.
Acknowledgements
No acknowledgement found.References
1. Mabray, M. C., Barajas, R. F. & Cha, S. Modern Brain Tumor Imaging. Brain Tumor Research and Treatment 3, 8 (2015).
9. Siddiquee, M. M. R. et al. Learning Fixed Points in Generative Adversarial Networks: From Image-to-Image Translation to Disease Detection and Localization. (2019) doi:10.48550/arXiv.1908.06965.
10. Song, J., Meng, C. & Ermon, S. Denoising Diffusion Implicit Models. (2020).
11. Ho, J., Jain, A. & Abbeel, P. Denoising Diffusion Probabilistic Models. (2020).
15. Kazerooni, A. F. et al. The Brain Tumor Segmentation (BraTS) Challenge 2023: Focus on Pediatrics (CBTN-CONNECT-DIPGR-ASNR-MICCAI BraTS-PEDs). arXiv [eess.IV] (2023) doi:10.48550/arXiv.2305.17033.
16. Dhariwal, P. & Nichol, A. Diffusion Models Beat GANs on Image Synthesis. (2021).
Figures