1395
Automatic segmentation of spinal cord multiple sclerosis lesions across multiple sites, contrasts and vendors1NeuroPoly Lab, Institute of Biomedical Engineering, Polytechnique Montreal, Montréal, QC, Canada, 2Mila - Quebec AI Institute, Montréal, QC, Canada, 3Department of Neurosurgery, Faculty of Medicine and Dentistry, Palacký University Olomouc, Olomouc, Czech Republic, 4Department of Neurology, Faculty of Medicine and Dentistry, Palacký University Olomouc, Olomouc, Czech Republic, 5Department of Medicine (Neurology), University of Toronto, Toronto, ON, Canada, 6BARLO Multiple Sclerosis Centre & Keenan Research Centre, St. Michael's Hospital, Toronto, ON, Canada, 7Department of neuroscience, Université de Montréal, Montréal, QC, Canada, 8Neuroimmunology research laboratory, University of Montreal Hospital Research Centre (CRCHUM), Montréal, QC, Canada, 9School of Biomedical Engineering, University of British Columbia, Vancouver, BC, Canada, 10Departments of Medicine (Neurology), Physics, Radiology, University of British Columbia,, Vancouver, BC, Canada, 11Functional Neuroimaging Unit, CRIUGM, Université de Montréal, Montréal, QC, Canada, 12Centre de Recherche du CHU Sainte-Justine, Université de Montréal, Montréal, QC, Canada
Synopsis
Keywords: Diagnosis/Prediction, Multiple Sclerosis, Deep Learning, Segmentation, Spinal Cord
Motivation: Longitudinal analysis of spinal cord multiple sclerosis (MS) lesions is clinically relevant for the early diagnosis and monitoring of MS progression.
Goal(s): Develop a deep learning tool for the automatic segmentation of MS spinal cord lesions on PSIR and STIR images from multiple sites.
Approach: A nnUNet model was trained and tested on the baseline data and applied to follow-up scans to create lesion distribution maps.
Results: We demonstrated the utility of the model to map the spatio-temporal distribution of MS lesions across MS phenotypes. The model is packaged into an open-source software.
Impact: Automatic segmentation of spinal cord lesions in large cohorts helps to identify signatures of MS phenotypes for ultimately improving prognosis and optimizing treatment for people with MS.
Introduction
Clinical monitoring of spinal cord (SC) multiple sclerosis (MS) lesions is relevant for the early diagnostics and evaluation of MS progression1. While methods exist to automatically segment MS lesions in the brain, only a few have tackled lesion segmentation in the SC2. Moreover, existing SC MS lesion segmentation algorithms only work well for MRI contrasts used during training but do not generalize well. In this work, we propose a deep learning (DL) model for the automatic segmentation of both SC and lesions in phase sensitive inversion recovery (PSIR) and short tau inversion recovery (STIR) images. The algorithm was tested on longitudinal multi-site, multi-contrast and multi-vendor data. A proof-of-concept application of this work was to automatically generate spatial distribution maps of MS lesions3,4.Methods
3T MRI data from 5 sites were collected as part of the ongoing Canadian Prospective Cohort Study to Understand Progression in MS (CanProCo) project5. Sagittal PSIR 0.7×0.7×3 mm3 (4 sites, 333 participants) and sagittal STIR 0.7×0.7×3 mm3 (1 site, 92 participants) images of the cervical SC from the baseline session (M0) were used for model training. To study spatio-temporal MS lesion distribution, participants with both M0 and 12-month follow-up (M12) sessions were used, resulting in 158 relapsing-remitting MS (RRMS), 45 primary progressive MS (PPMS), and 45 radiologically isolated syndrome (RIS) participants.MS lesions were manually segmented by a single-rater, and intervertebral discs were manually identified on M0 images. For each subject, the SC was automatically segmented on M0 images using the contrast-agnostic DL model6 on STIR and inverted PSIR (multiplied by -1). Segmentations were corrected when necessary in ~5% of the images. For M12 data, intervertebral discs were obtained using the Hourglass model7 fine-tuned on M0 data and manually corrected when necessary (~20% of the images).
The self-configuring nnUNet v2 framework8 was used to train two DL models (3D and 2D) on the STIR and inverted PSIR images from M0 to simultaneously segment hyper-intense lesions and the SC (269/67/89 images for training/validation/testing). The performance of both models on the test set (~20% of M0 images for each site) was compared with sct_deepseg_lesion2. The models were then applied to unseen M12 data.
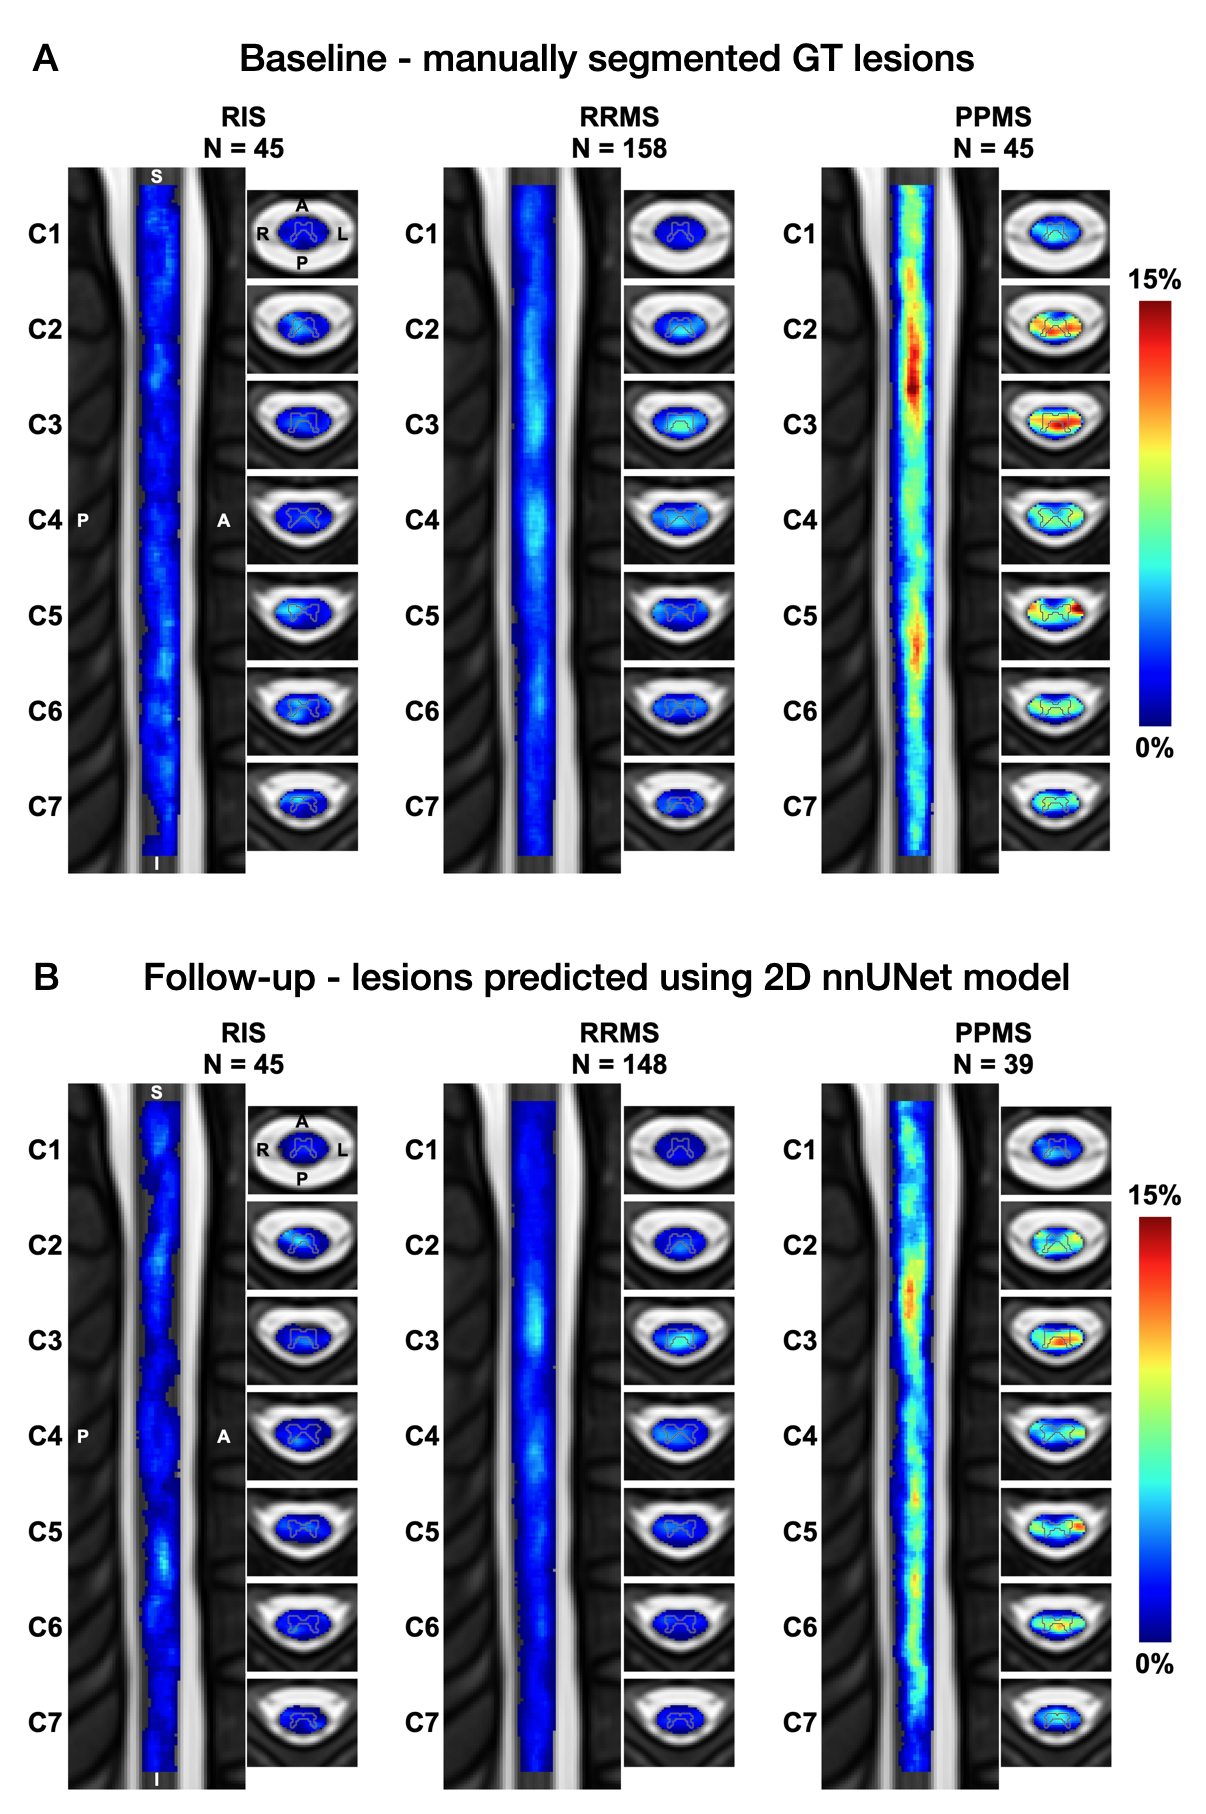
Lesion and SC masks were brought to the PAM50 SC template9 to create lesion frequency maps4 for individual phenotypes and across sessions.
Results
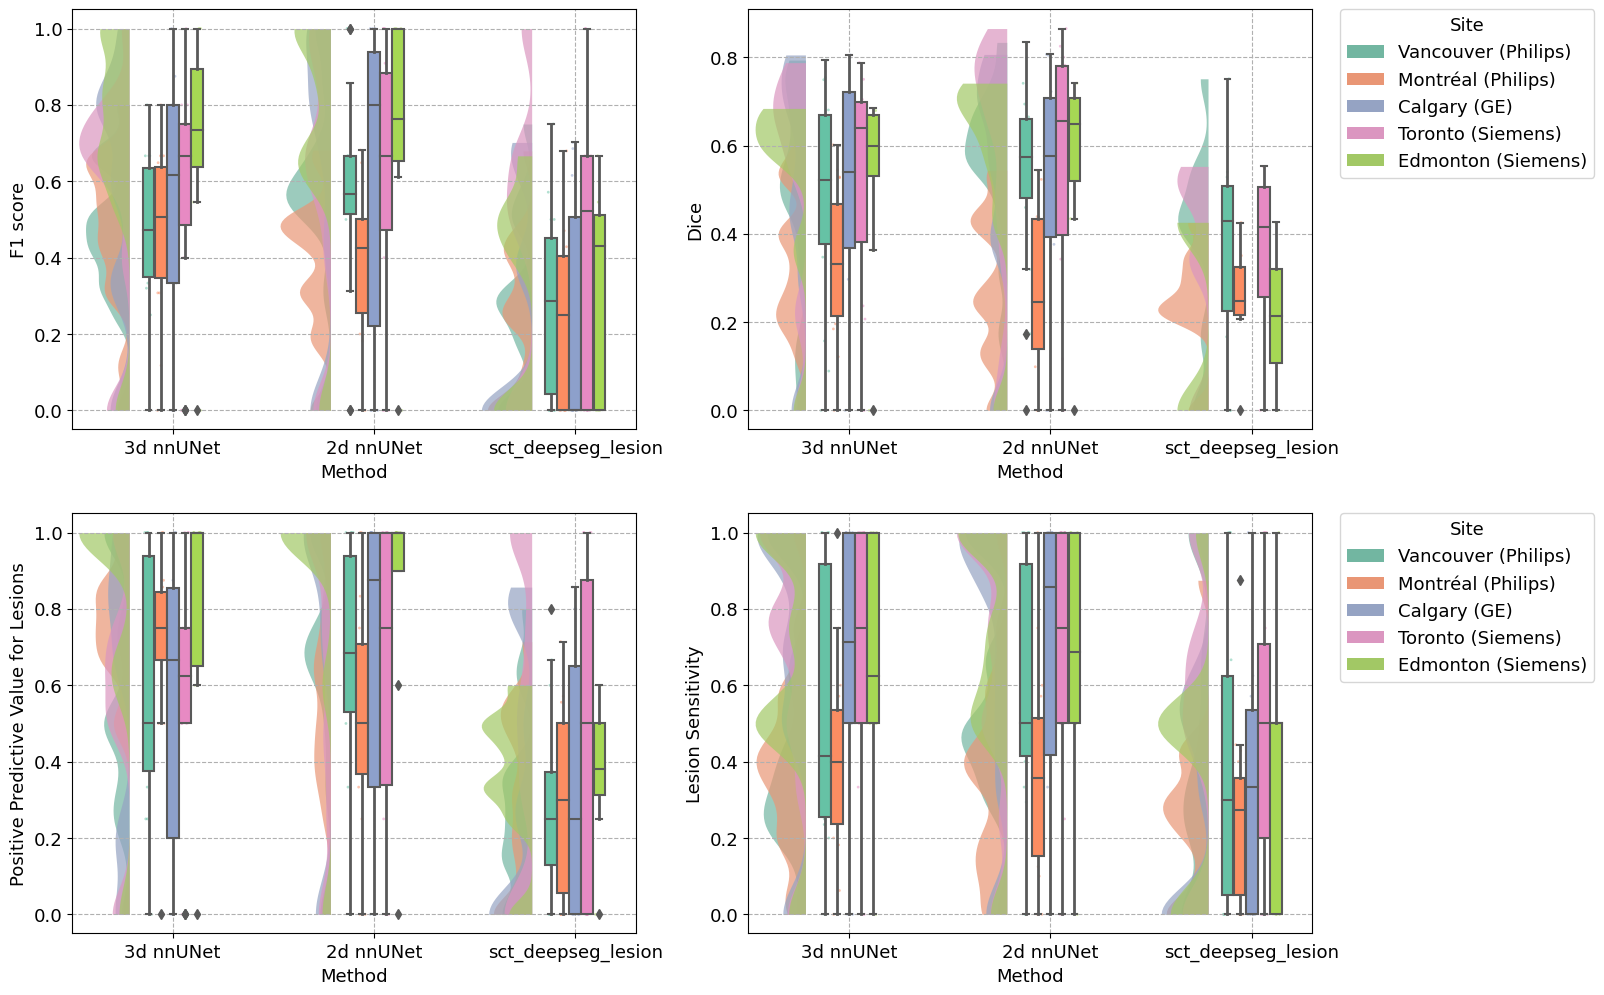
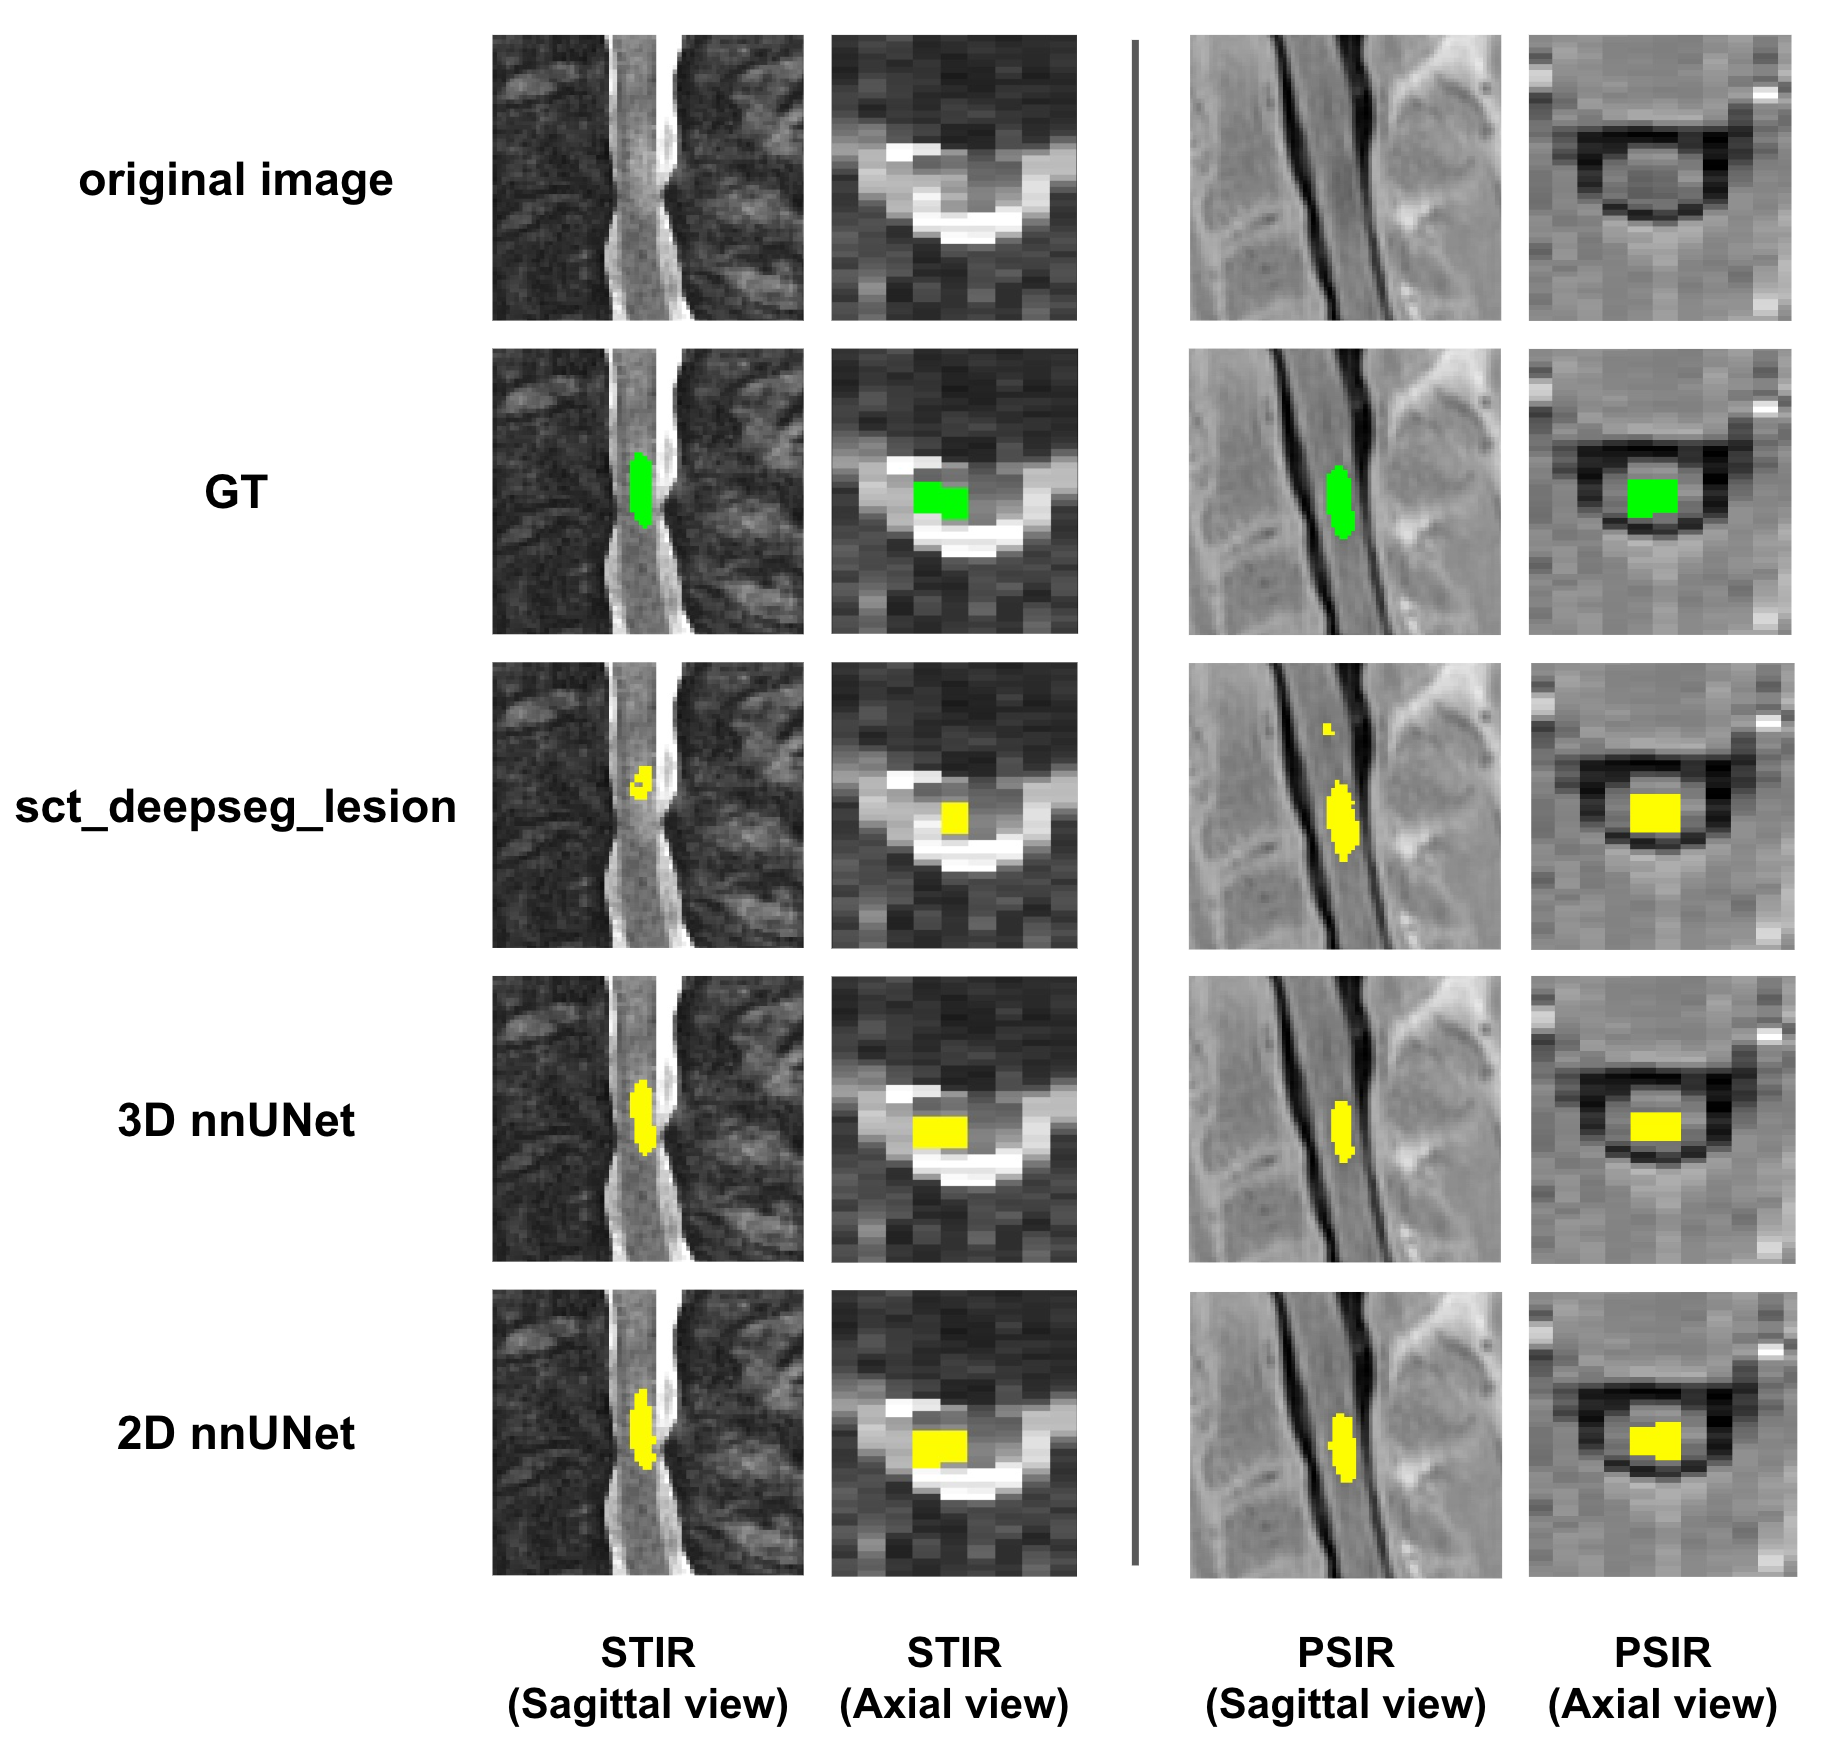
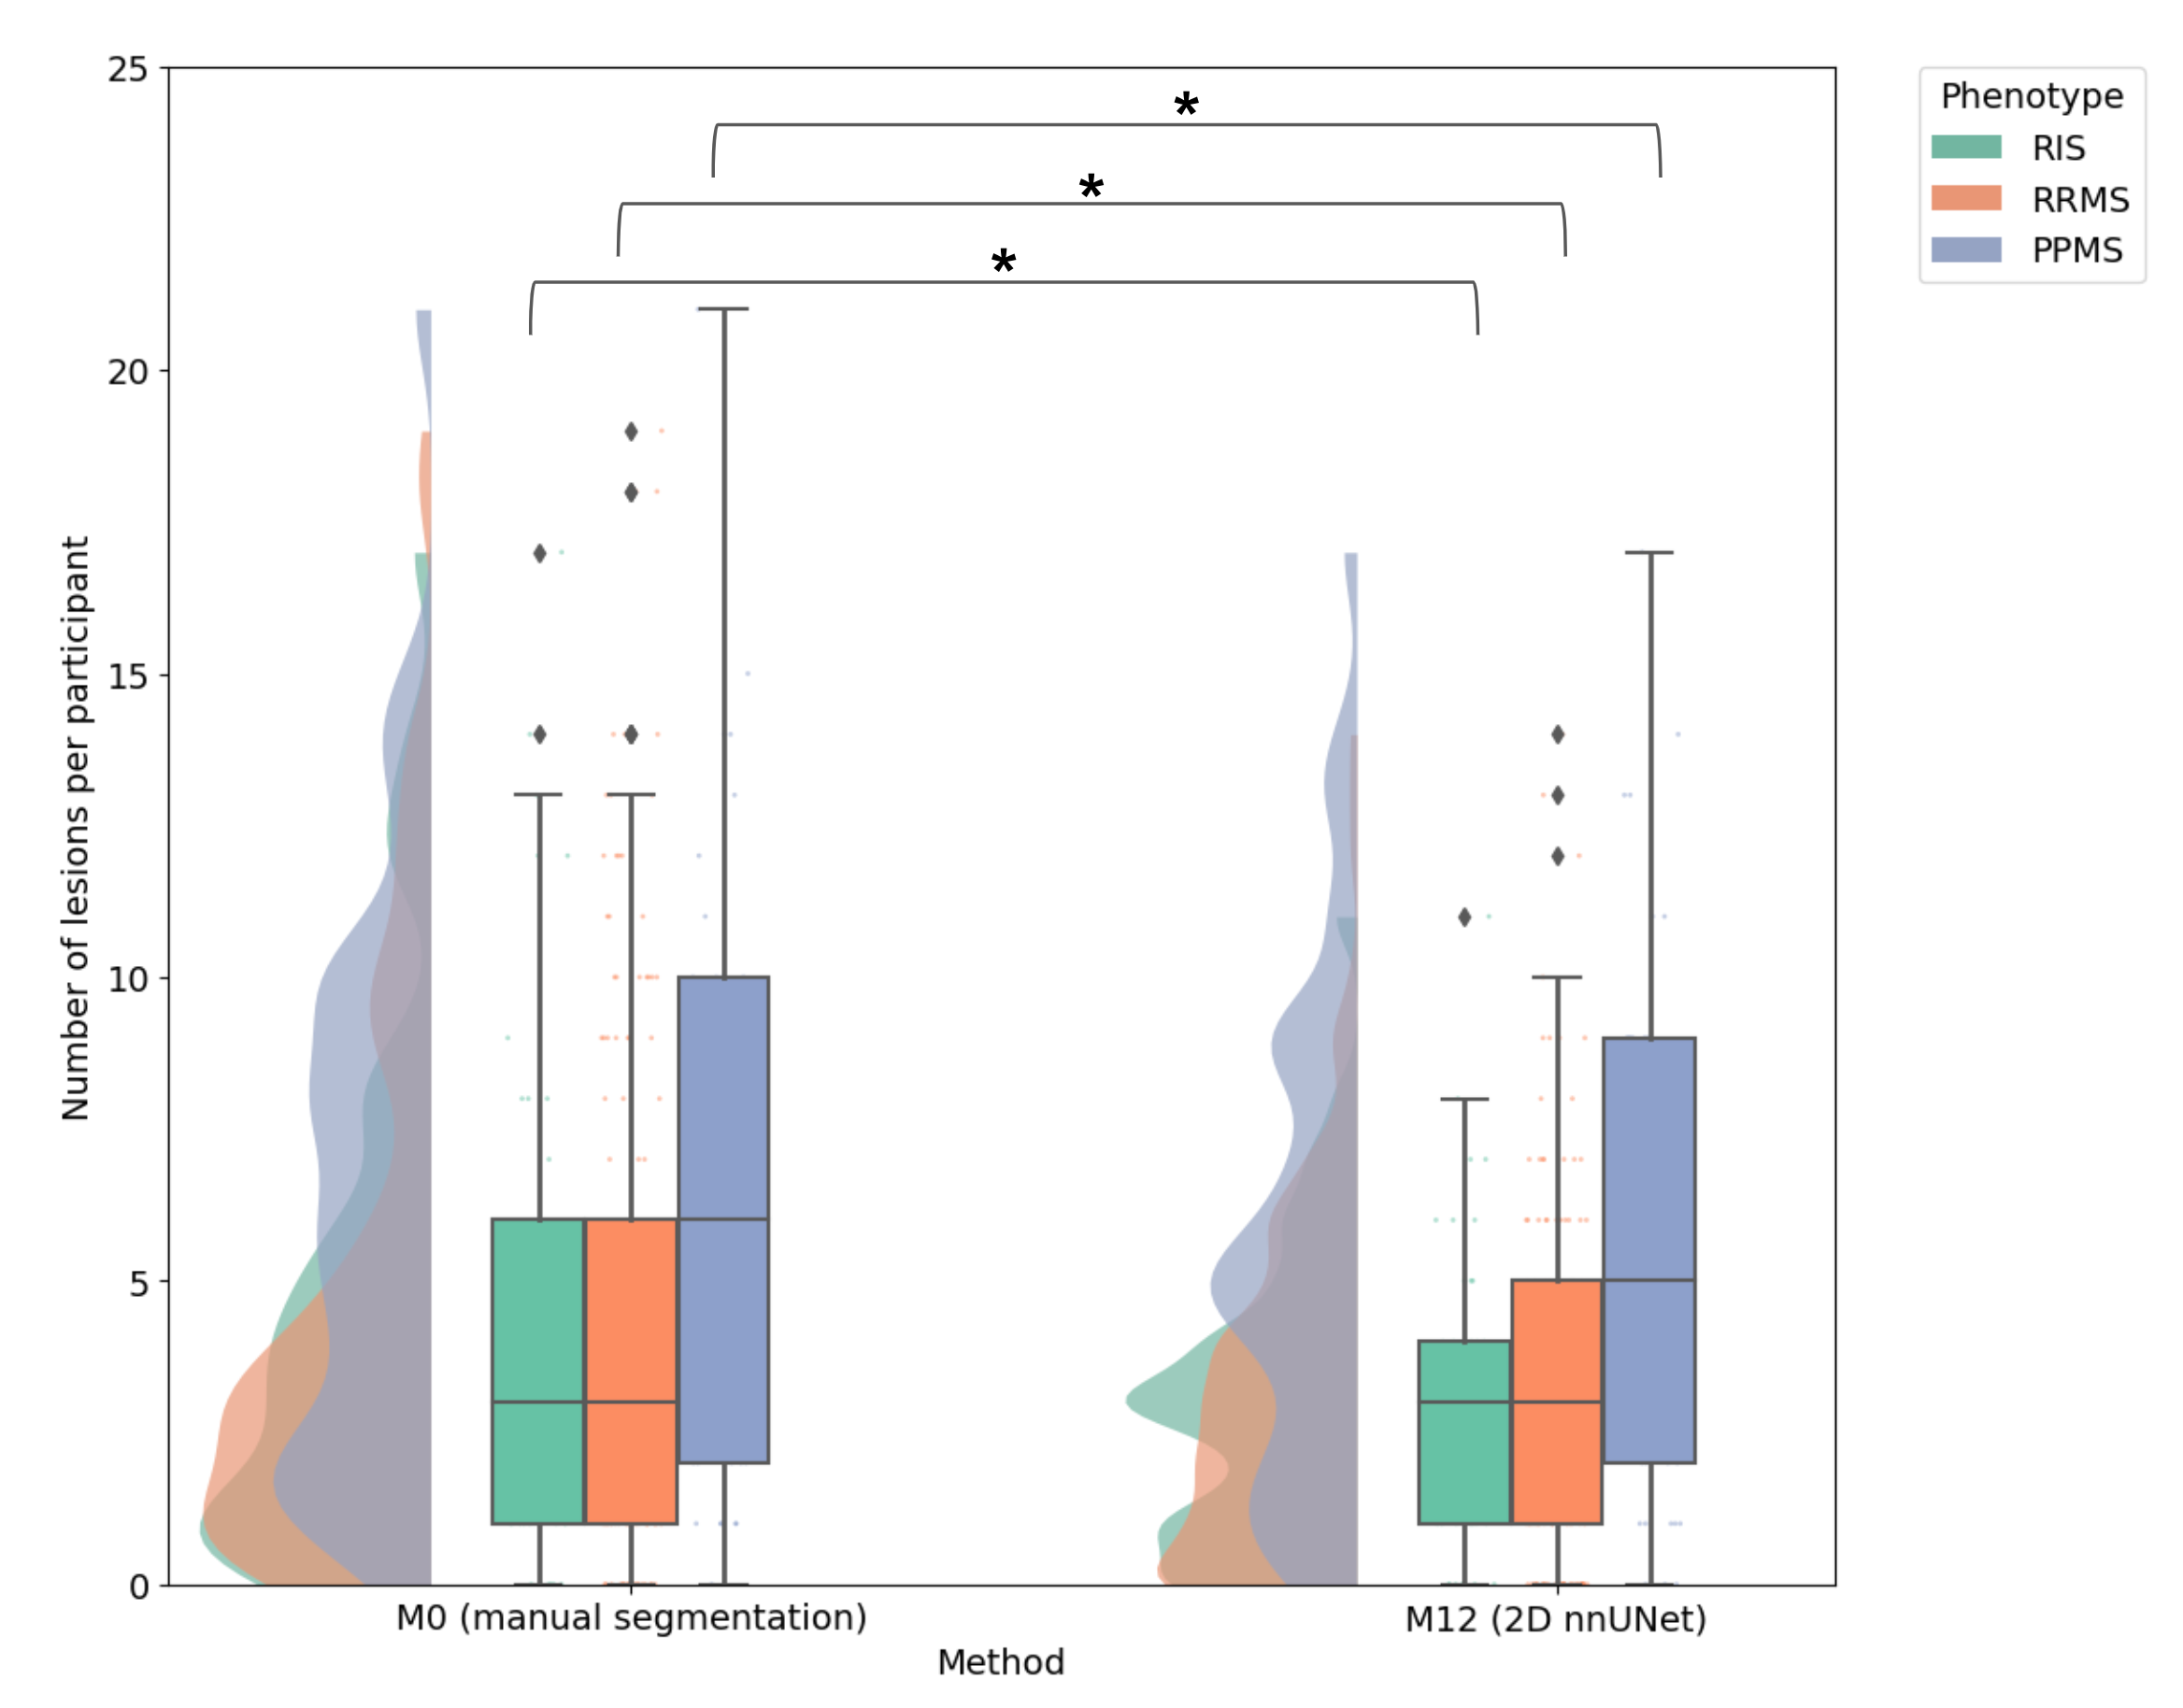
Figure 1 shows that both the 3D and 2D nnUNet models performed similarly, and both outperformed sct_deepseg_lesion on lesion-wide and voxel-wide metrics (Figure 2).Figure 3 depicts the number of lesions across phenotypes and sessions. We measured an average number of 4.71 manually segmented lesions at M0, and 3.55 lesions at M12 for the 2D model. PPMS participants showed a higher number of lesions relative to RRMS and RIS participants across all sessions.
Figure 4 shows lesion frequency maps across phenotypes and sessions. In both the M0 (created from ground truth segmentations) and the M12 (created from predicted segmentations) maps, lesions were predominantly located at C2-C3 and C5 vertebral levels. PPMS participants demonstrated higher lesion count relative to RRMS and RIS participants.
Discussion
The median Dice scores were 0.55 and 0.53 for the 2D and 3D models, respectively, which is in the ballpark of state-of-the-art performance for SC MS lesion segmentation2. The developed models outperformed sct_deepseg_lesion, keeping in mind that sct_deepseg_lesion was trained on different contrasts. Contrary to a previous longitudinal study showing an increase in lesion count in RRMS10, our model predicted fewer lesions for M12 relative to M0. This is likely caused by a relatively low sensitivity of the model to detect lesions (median sensitivity is 0.5). This can be explained by: (i) the poorly defined lesions due to the highly anisotropic resolution, (ii) the aggregation of two different MRI contrasts for training a single model, and (iii) intra-rater variability in the generation of ground truth lesion masks11. Similarly to previous studies3,4, we found that lesions were more frequently located at C2-C3 and C5 vertebral levels, with a higher distribution of lesions in PPMS relative to RRMS and RIS. Further validation of the proposed models is needed to validate their performance against M12 manual segmentations.Conclusion
This work presents an automatic method for the segmentation of MS lesions from PSIR/STIR images. The method generalizes across phenotypes, sites, and sessions and provides results in agreement with previous studies. Subsequent development will further validate the generalizability of the model across additional MRI contrasts.Acknowledgements
This research was supported by the Multiple Sclerosis Society of Canada, Biogen Idec, Brain Canada, and Roche. We acknowledge all study participants as well as CanProCo collaborators. Thanks to Nick Guenther and Mathieu Guay-Paquet for helping with dataset management. Funded by the Canada Research Chair in Quantitative Magnetic Resonance Imaging [CRC-2020-00179], the Canadian Institute of Health Research [PJT-190258], the Canada Foundation for Innovation [32454, 34824], the Fonds de Recherche du Québec - Santé [322736, 324636], the Natural Sciences and Engineering Research Council of Canada [RGPIN-2019-07244], the Canada First Research Excellence Fund (IVADO and TransMedTech), the Courtois NeuroMod project, the Quebec BioImaging Network [5886, 35450], INSPIRED (Spinal Research, UK; Wings for Life, Austria; Craig H. Neilsen Foundation, USA), Mila - Tech Transfer Funding Program. JV has received funding from the European Union's Horizon Europe research and innovation programme under the Marie Sktodowska-Curie grant agreement No 101107932.References
Figures