1394
Cerebral microbleed detection on susceptibility weighted imaging using solely artificial training data1Advanced Clinical Imaging Technology, Siemens Healthineers International AG, Lausanne, Switzerland, 2Department of Radiology, Lausanne University Hospital and University of Lausanne, Lausanne, Switzerland, 3LTS5, École Polytechnique Fédérale de Lausanne (EPFL), Lausanne, Switzerland, 4Leenaards Memory Centre, Lausanne University Hospital and University of Lausanne, Lausanne, Switzerland, 5Siemens Healthcare Pvt. Ltd., Bangaluru, India
Synopsis
Keywords: Diagnosis/Prediction, Machine Learning/Artificial Intelligence, microbleed, ARIA, SWI
Motivation: Cerebral microbleeds (CMBs) are small brain hemorrhages detectable with MRI associated with conditions like cerebral amyloid angiopathy. As their detection can be difficult, automated methods are needed for quick and precise detection and localization of CMBs.
Goal(s): To propose an algorithm to detect CMBs.
Approach: A neural network was trained on SWI/T2* images, with artificial bleeds generated and added during training. The model’s performance was tested on an independent test set with actual CMBs.
Results: Despite the absence of real CMBs in the training data, the simulated bleeds provided sufficient information to train a model with good performance in the independent test set.
Impact: We propose an algorithm that can help with the tedious radiological task of detecting cerebral microbleeds in the brain. We further demonstrate that a model trained solely on simulated bleeds can effectively detect actual microbleeds in real MRI data.
INTRODUCTION
Cerebral microbleeds (CMBs) are small brain hemorrhages best detected on T2*-weighted or SWI (susceptibility weighted imaging) MR images. More common in older individuals and those with neurological conditions such as cerebral amyloid angiopathy, and have emerged as side-effect of anti-amyloid treatments, so called amyloid-related imaging abnormalities-hemosiderin (ARIA-H). The count and location of CMBs are important diagnostic criteria but remain mainly subjective and qualitative. Automated methods, e.g., convolutional neural networks (CNN), can aid in quick and precise CMB detection. To overcome the need for numerous training examples, we used simulated bleeds (similar to [Momeni2021]) to artificially create the training data. Reliability of this method was assessed on a set of patients undergoing brain MRI as part of the work-up for a cognitive complaint.METHODS
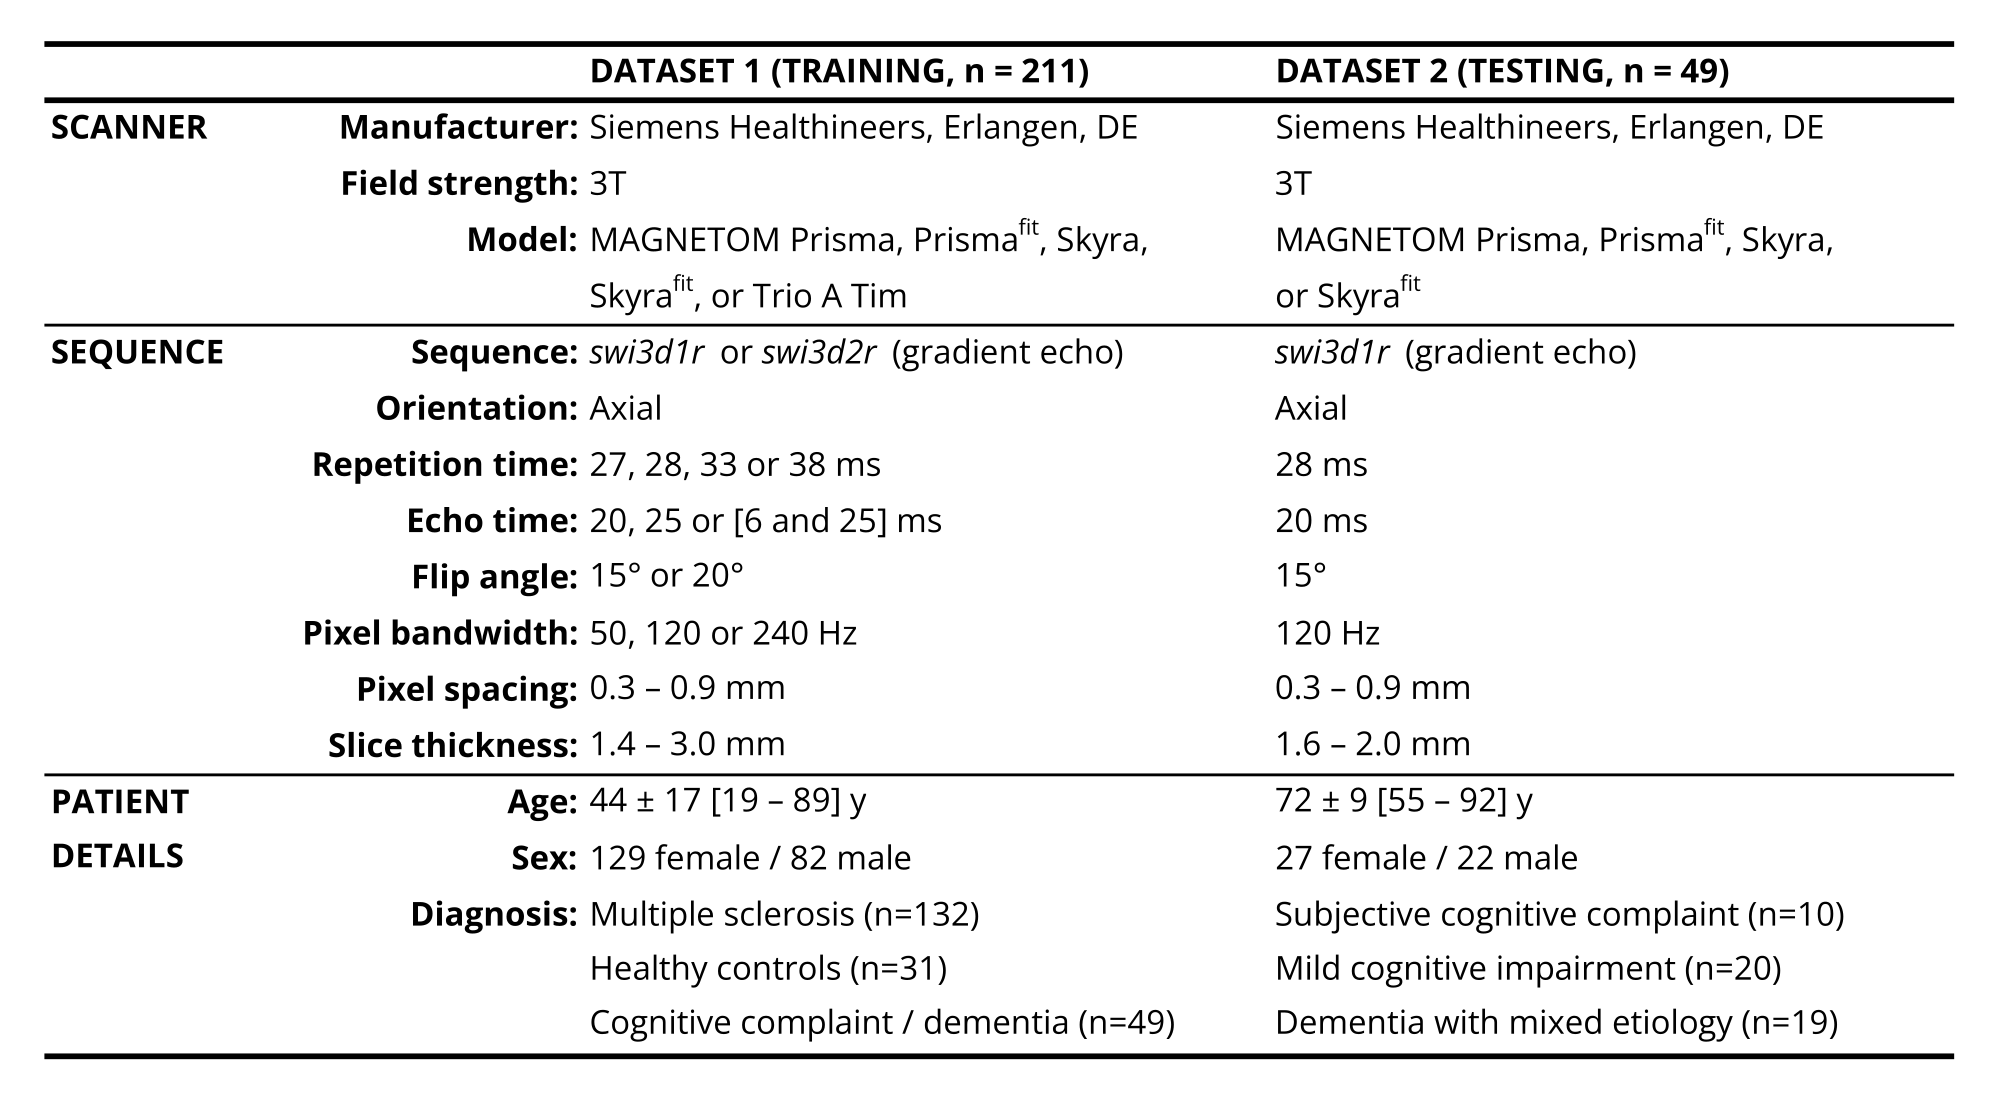
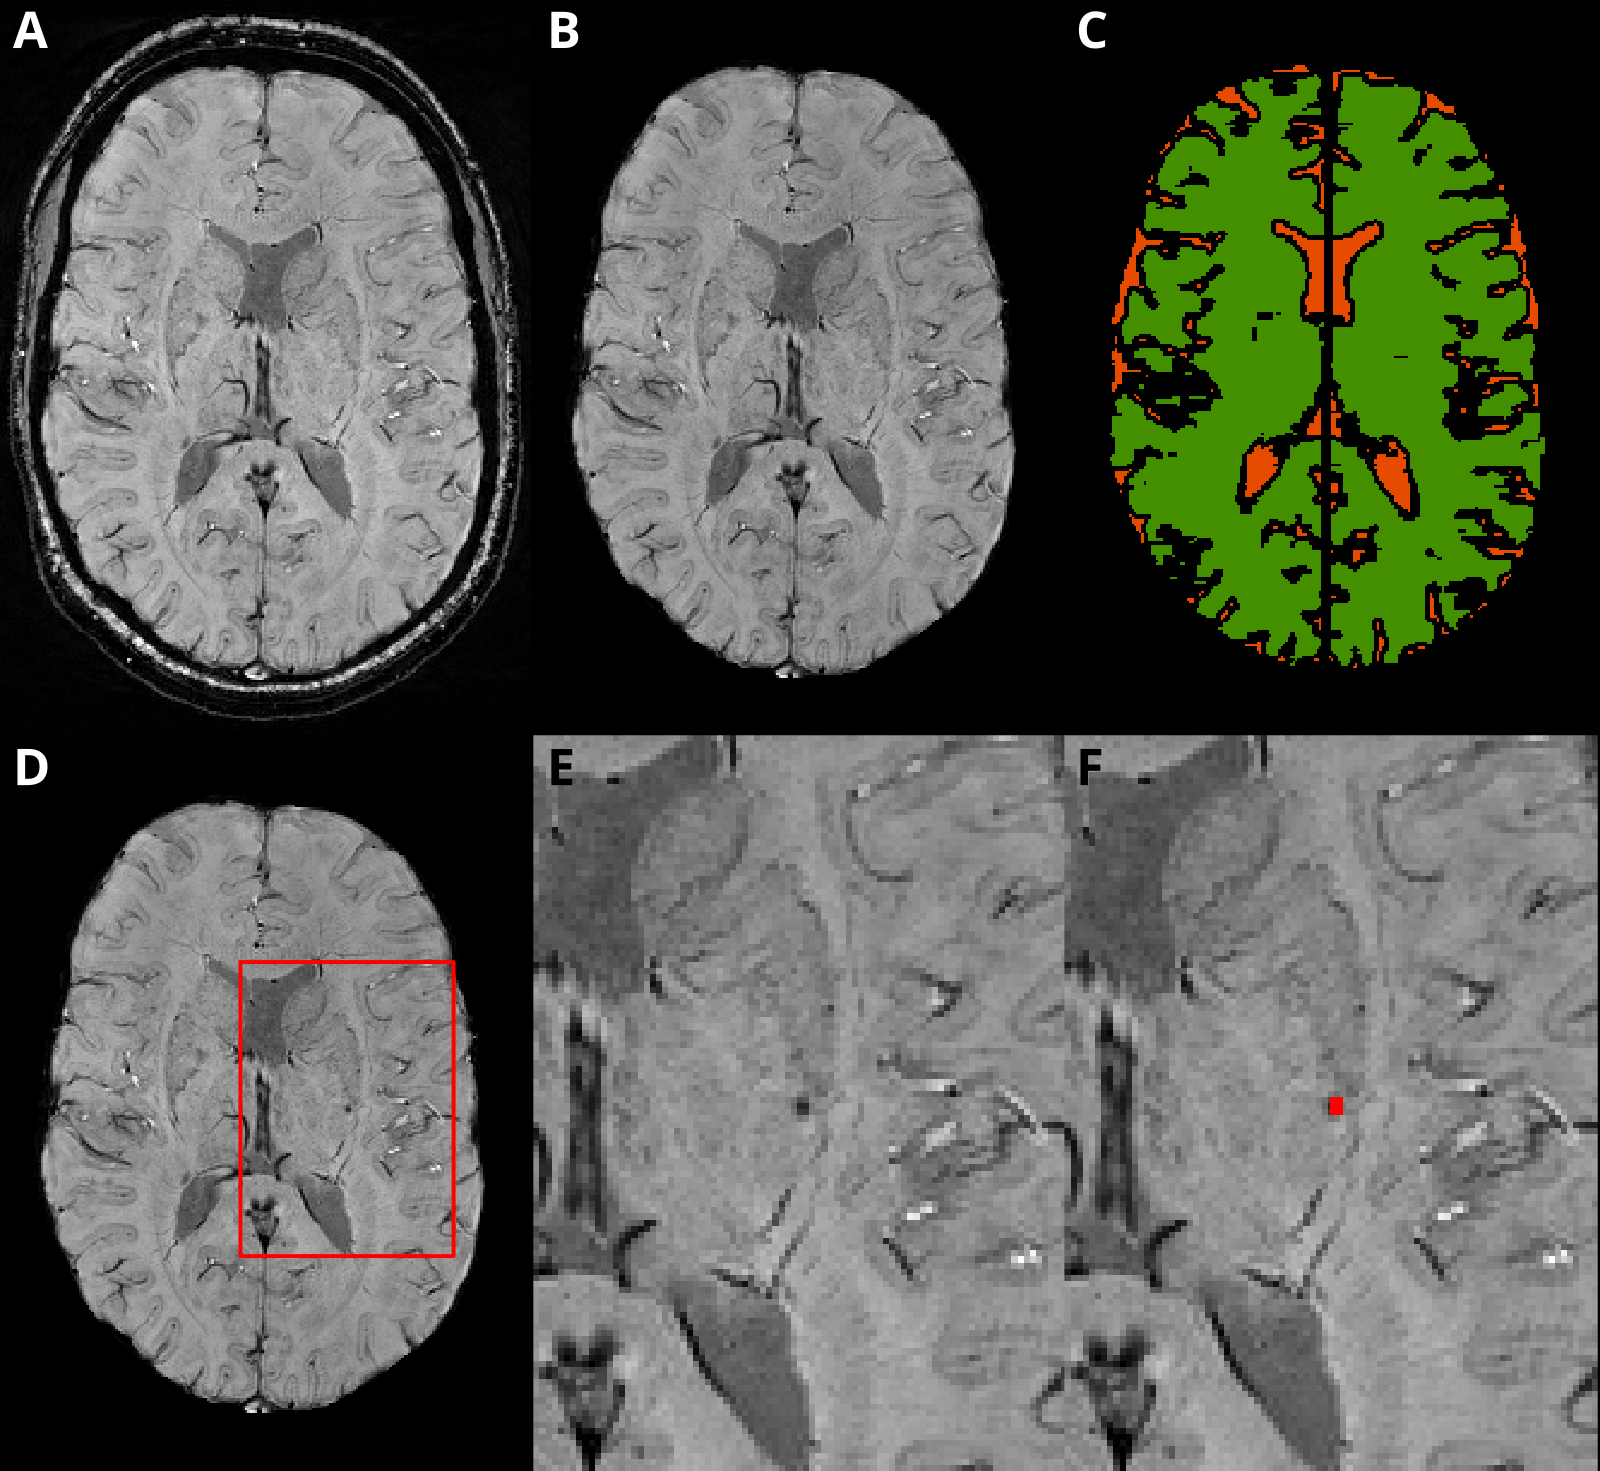
Demographic and imaging details of the MRI data used for training (N=211) can be found in Table 1. Both SWI and T2* magnitude images were added to the training data. In cases with two echo times, both were added. Automated brain region segmentation [Schmitter2015] was performed on the magnetization-prepared rapid gradient echo (MP-RAGE) images. From this, a map was generated with areas where bleeds can be generated (i.e., positive examples), where bleeds cannot be generated, and where bleed-like structures are generated but not labeled (i.e., negative examples). The latter category included the globus pallidus, and cerebrospinal fluid. The positive examples area includes the rest of the brain parenchyma, except a small area around the midsagittal plane. Another map was generated from the MP-RAGE-brain region segmentation that included the bilateral frontal, parietal, occipital, and temporal lobes, deep brain structures, brain stem and left/right cerebellum. Elastix [Klein2010] was used to perform an affine registration of the MP-RAGE to the SWI space, to transform the maps to the SWI space. One CNN was trained to perform skull-stripping on the SWI/T2*w images, similar to [Venkategowda2020]. The skull stripping was used for preprocessing in the subsequent steps. A second CNN (3D UNet) was trained on the skull-stripped SWI/T2* images to perform brain region segmentation. Finally, a third CNN (3D UNet) was trained on skull-stripped SWI/T2* images, that used only data without bleeds. During training, artificial bleeds were generated and added on the fly based on the aforementioned bleed generation map. The number of artificial bleeds, their size, shape, and other properties were randomly sampled. Each simulated bleed was based on an anisotropic Gaussian with possible hypointense center and outer ring. An independent test set of SWI images was acquired in 49 consecutive patients assessed in the Leenaards Memory Center at 3T, see Table 1. Total CMB count was obtained by combining lobar, deep and infratentorial scores manually estimated following the microbleed anatomical rating scale (MARS) [Gregoire2009] scale and compared to the automated result.RESULTS
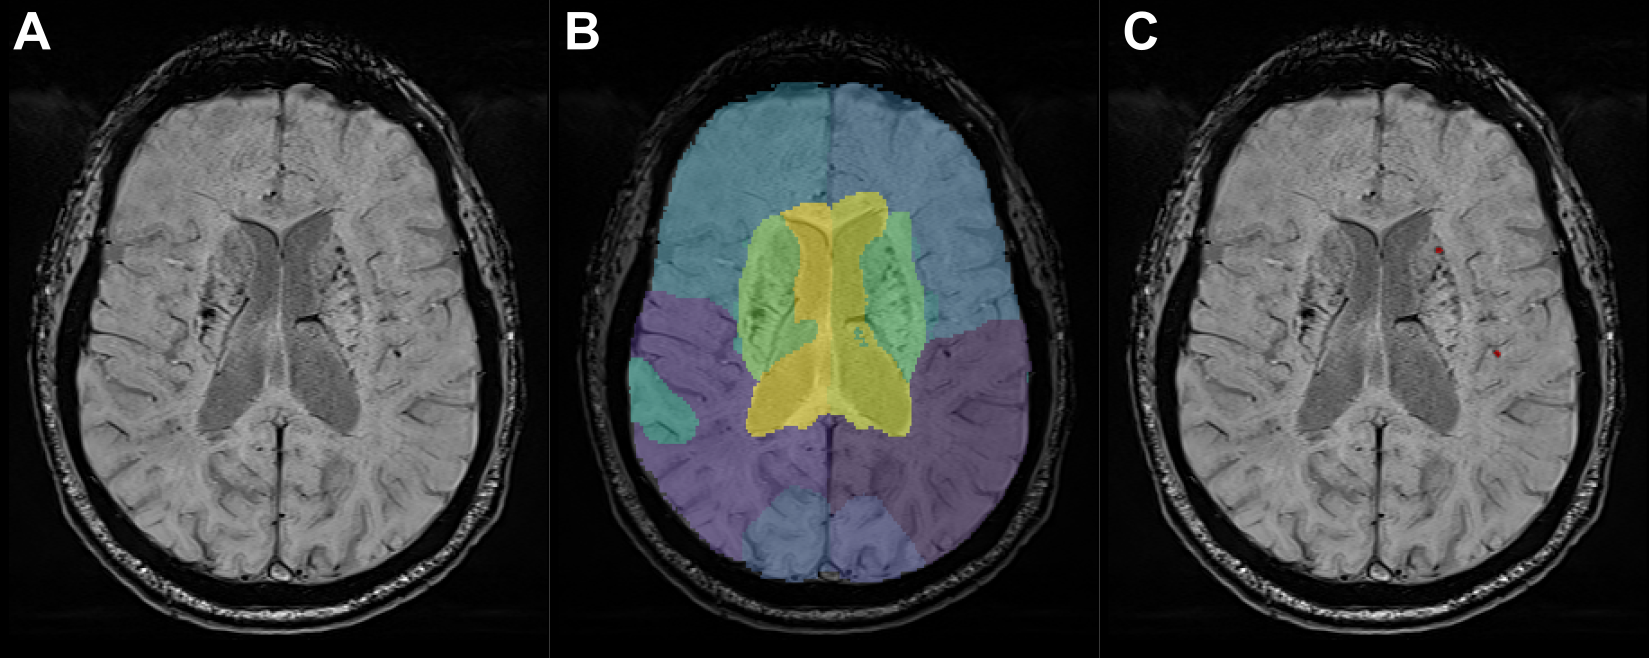
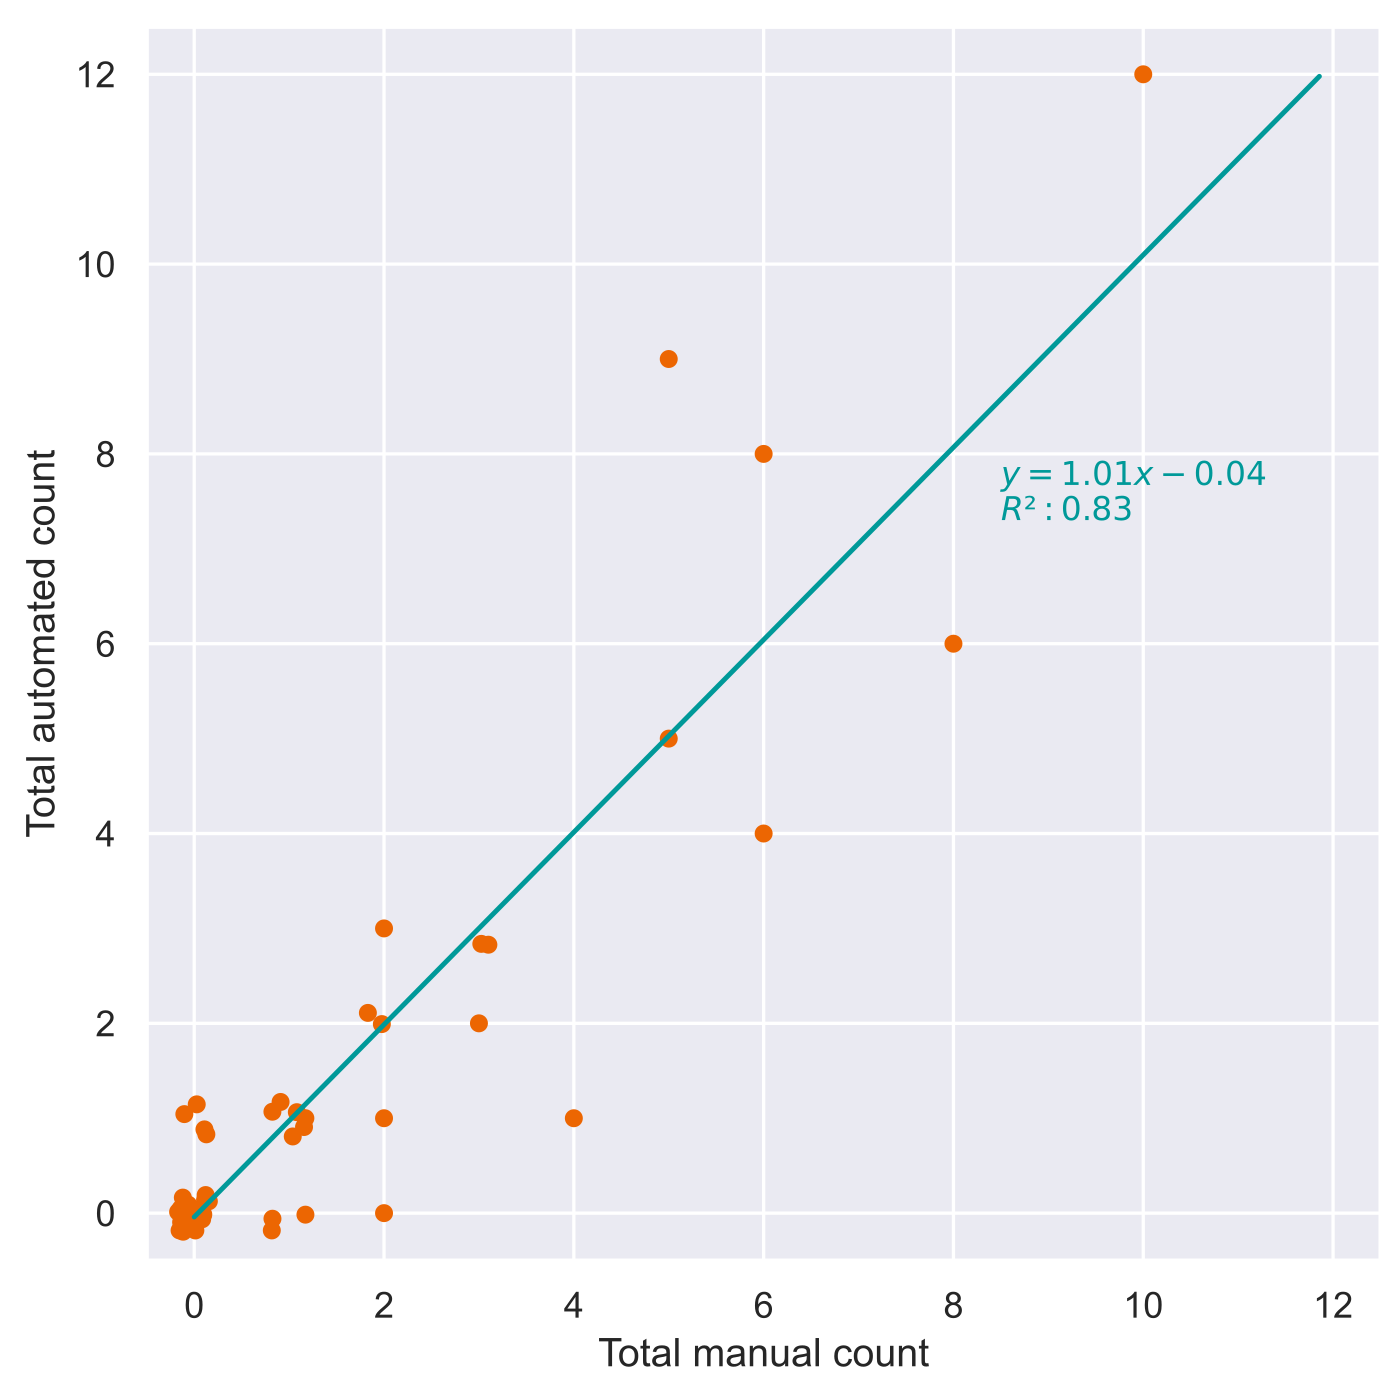
An example image used for training with simulated bleeds is shown in Figure 2. In Figure 3, a test subject with real CMBs is shown with the results of the automated detection of CMBs and brain region segmentation. In the test set of 49 patients, manual assessment showed an average of 1.5±2.3 CMBs per patient (range 0-10), with 25 patients without any, and 24 patients with at least one CMB (of which six had ≥5). The automated method detected 1.4±2.6 CMBs per patient (range 0-12), with 25 patients without and 24 with at least one (five with ≥5), see Figure 4. Overall, the algorithm classified 20 true positive, 21 true negative, 4 false positive and 4 false negative (FN) patients. The Gwet AC1 coefficient [Gwet2001] between the algorithm and manual counts was 0.63 for the whole brain.DISCUSSION
Despite the absence of real CMBs in the training data, the simulated bleeds provide sufficient information to train a model with good detection performance in the test set. The algorithm results detect a similar number of bleeds as compared to the manual rating. Further tuning of the localization of simulated bleeds and their properties may improve the results further, especially to reduce the FN detections. The current approach cannot yet be applied for clinical diagnosis but could be a starting point for a much more efficient labeling of images with CMBs. This could quickly enhance the training dataset, and a combination of actual and simulated bleeds could be used for an improved model.CONCLUSION
A model trained solely on simulated bleeds successfully achieved automated detection of CMBs on SWI, despite not having been exposed to actual bleeds. This model will assist clinicians to improve the detection of CMBs that will help to diagnose CAA and eventual complications of anti-amyloid drugs, such as ARIA-H.Acknowledgements
No acknowledgement found.References
- Momeni, S. et al. Synthetic microbleeds generation for classifier training without ground truth. Comput. Methods Programs Biomed. 207, 106127 (2021).
- Schmitter, D. et al. An evaluation of volume-based morphometry for prediction of mild cognitive impairment and Alzheimer’s disease. NeuroImage Clin. 7, 7–17 (2015).
- Klein, S., et al. elastix: A Toolbox for Intensity-Based Medical Image Registration. IEEE Trans. Med. Imaging 29, 196–205 (2010).
- Venkategowda P. B., et al. Retrofitting a
brain segmentation algorithm with deep learning techniques: validation and
experiments. 28th meeting of the International Society of Magnetic Resonance in
medicine, Sydney, 2020
- Gregoire, S. M. et al. The Microbleed Anatomical Rating Scale (MARS): reliability of a tool to map brain microbleeds. Neurology 73, 1759–66 (2009).
- Gwet K. Handbook of Inter-Rater Reliability: How to Estimate the Level of Agreement Between Two or Multiple Raters. Gaithersburg, MD: STATAXIS Publishing Company; 2001.
Figures