1392
Association of duration of dialysis and myocardial damage in end-stage renal disease patients: assessed by cardiovascular magnetic resonance1Radiology, the Second Affiliated Hospital of Nanjing Medical University, Nanjing, China, 2the Second Affiliated Hospital of Nanjing Medical University, Nanjing, China, 3GE Healthcare, MR Research China, Beijing, China
Synopsis
Keywords: Myocardium, Cardiovascular
Motivation: Explore relationship between cardiac image and duration of dialysis.
Goal(s): To evaluate myocardial damage using CMR in end-stage renal disease (ESRD) patients undergoing hemodialysis and further explore its relationship with duration of dialysis.
Approach: Patients with long- and short-term dialysis were included. CMR parameters (native T1 value and ECV) and two biochemical results (brain pro-natriuretic peptide and troponin T) were compared.
Results: Native T1 value, ECV, brain pro-natriuretic peptide and troponin T were significant different in two groups. Multiple linear regression analysis showed that native T1 value and ECV were independently associated with duration of dialysis and troponin T.
Impact: Quantification of myocardial fibrosis in ESRD is challenging. CMR imaging is useful in the detection of cardiac damage. Longer durations of dialysis may lead to poor outcomes. Our purpose was to explore relationship between cardiac image and duration of dialysis.
Introduction
There is an increased risk of cardiovascular (CV) mortality in populations with end-stage renal disease (ESRD)[1], and a majority of these patients receive hemodialysis[2]. However, detecting CV abnormalities early is challenging in some ESRD patients with preserved left ventricular ejection fraction (LVEF)[3]. Cardiac MR (CMR) native T1 mapping and extracellular volume (ECV) techniques are sensitive for evaluating diffuse interstitial myocardial fibrosis[2]. Linear gadolinium-based contrast agents (GBCAs) have been implicated in the development of nephrogenic systemic fibrosis (NSF) in patients with ESRD. The European Medicines Agency (EMA) has determined that macrocyclic formulations (group II GBCAs) are low risk and can be used in ESRD patients[4]. Findings suggest that the risk of NSF from low-risk GBCA administration in ESRD is likely less than 0.07%[5]. Therefore, contrast-enhanced MRI with a low-risk GBCA should not be withheld solely based on NSF risk[5]. Previous reports have demonstrated increased T1 times and ECV in ESRD[6] and in patients on hemodialysis[7], yet the prevalence of myocardial late gadolinium enhancement was found to be low[8]. These reports also indicated that elevated native T1 in ESRD was associated with higher levels of serum troponin[6]. Some authors have noted that longer durations of dialysis sessions may lead to left ventricular hypertrophy[9]. However, few studies have comprehensively evaluated the impact of dialysis duration on myocardial damage. Therefore, this study aimed to investigate cardiac involvement by examining CMR native T1 mapping and ECV and to further explore the relationship between the duration of dialysis and troponin levels.Methods
31 ERSD patients were enrolled[1] in this study and divided in two groups according to the duration of dialysis, including long-term (≥6 months, 20, 64.5%), and short-term (<6 months, 11, 35.5%). CMR scans were performed on 3.0-T MR scanner (GE SIGNA™ Premier 3.0T) with a 30-channel body anterior coil. The MR scans included 2-, 3- and 4-chamber views, short-axis cine images, T1 mapping using the modified look-locker inversion recovery (MOLLI) sequence (slice thickness 8.0 mm, field of view 300 ×400 mm, flip angle 35°, TE 1.4ms), LGE images acquired at 20 min after a bolus intravenous injection of 0.15 mmol/kg group II gadolinium-based contrast agent (GBCA) (gadoteric acid meglumine, Hengrui, Jiangsu, China). Biotech examinations were measured and dialysis were in all subjects in the same day [4]. The T1 mapping and ECV analyses were conducted using Segment v4.0 R12067. The mean T1 in a region of interest in the ventricular cavity was considered the blood T1. ECV= (1-haematomatic)×(1/post contrast T1 myo-1/native T1 myo)/(1/post contrast T1 blood-1/native T1 blood)(Figure 1). Comparisons of parameters between long- and short-term groups were evaluated by independent sample t test, Chi-square test or Mann–Whitney U test. A combined parameter model was established through two-class logistic regression and the predictive effects of native T1 value and ECV on long- or short-term dialysis were calculated. The correlations between CMR parameters, duration of dialysis and troponin T were evaluated by Pearson correlation test multiple linear regression. Analysis was calculated using MedCalc 19.1.2 and SPSS 23.0, figures were made by Graphpad Prism 8.0. P < 0.05 was considered statistically significant.Results
There were statistical differences in Brain pro-Natriuretic Peptide (BNP), Troponin T, native T1 value and ECV between long- and short-time groups (Table 1). Native T1 value and ECV correlated well with duration of dialysis (r=0.659, 0.721, P<0.05) (Table 2, Figure 2). The ROC curves showed that the diagnostic efficacy of combined parameters (AUC = 0.702, P < 0.05) was higher than single parameters (native T1 value (AUC = 0.613, P < 0.05) and ECV (AUC = 0.651, P < 0.05)) (Table 3, Figure 3). Multiple linear regression analysis showed that the native T1 value and ECV were independently associated with duration of dialysis (beta = 0.891, 0.351, P < 0.05) and troponin T (beta = 0.776, 0.593, P < 0.05) (Table 2, Figure 4).Conclusion
Native T1 value and ECV were found to be increased in ESRD patients with preserved LVEF under long-term dialysis. The results of this study suggest that duration of dialysis was associated with and was an independent risk factor for myocardial damage in ESRD patients undergoing maintenance hemodialysis.Acknowledgements
No acknowledgement found.References
[1] Graham-Brown MP, Rutherford E, Levelt E, et al. Native T1 mapping: inter-study, inter-observer and inter-center reproducibility in hemodialysis patients. J Cardiovasc Magn Reson. 2017. 19(1): 21. [2] Qin L, Gu S, Xiao R, et al. Value of native T1 mapping in the prediction of major adverse cardiovascular events in hemodialysis patients. Eur Radiol. 2022. 32(10): 6878-6890.
[3] Lin L, Xie Q, Zheng M, et al. Identification of cardiovascular abnormalities by multiparametric magnetic resonance imaging in end-stage renal disease patients with preserved left ventricular ejection fraction. Eur Radiol. 2021. 31(9): 7098-7109.
[4] Edwards BJ, Laumann AE, Nardone B, et al. Advancing pharmacovigilance through academic-legal collaboration: the case of gadolinium-based contrast agents and nephrogenic systemic fibrosis-a Research on Adverse Drug Events and Reports (RADAR) report. Br J Radiol. 2014. 87(1042): 20140307. [5] Woolen SA, Shankar PR, Gagnier JJ, MacEachern MP, Singer L, Davenport MS. Risk of Nephrogenic Systemic Fibrosis in Patients With Stage 4 or 5 Chronic Kidney Disease Receiving a Group II Gadolinium-Based Contrast Agent: A Systematic Review and Meta-analysis. JAMA Intern Med. 2020. 180(2): 223-230.
[6] Rutherford E, Talle MA, Mangion K, et al. Defining myocardial tissue abnormalities in end-stage renal failure with cardiac magnetic resonance imaging using native T1 mapping. Kidney Int. 2016. 90(4): 845-52.
[7] Graham-Brown M, Gulsin GS, Poli F, Parke K, Burton JO, McCann GP. Differences in native T1 and native T2 mapping between patients on hemodialysis and control subjects. Eur J Radiol. 2021. 140: 109748.
[8] Price AM, Hayer MK, Vijapurapu R, et al. Myocardial characterization in pre-dialysis chronic kidney disease: a study of prevalence, patterns and outcomes. BMC Cardiovasc Disord. 2019. 19(1): 295.
[9] Susantitaphong P, Koulouridis I, Balk EM, Madias NE, Jaber BL. Effect of frequent or extended hemodialysis on cardiovascular parameters: a meta-analysis. Am J Kidney Dis. 2012. 59(5): 689-99.
Figures
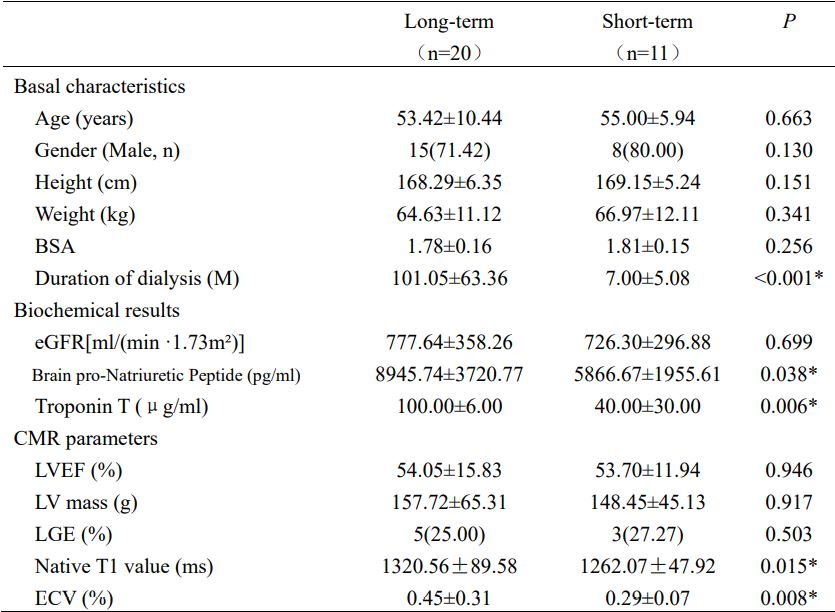
Table 1. Basal characteristics, biochemical results and cardiovascular magnetic resonance (CMR) parameters of long-term and short-term dialysis patients with end-stage renal disease (ESRD)
M months; *P < 0.05
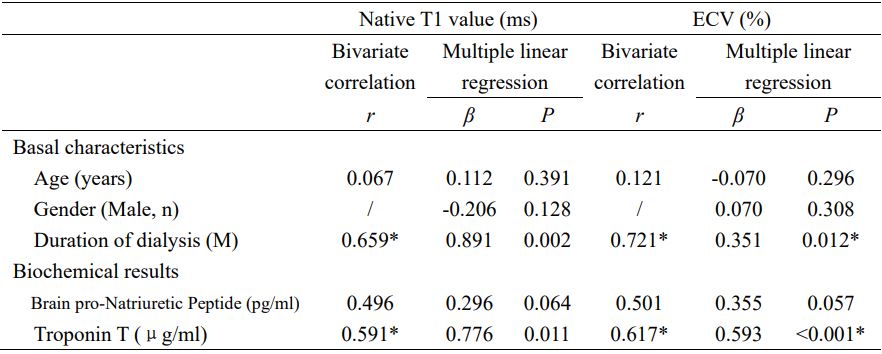
Table 2. CMR parameters correlate of basal characteristics and biochemical results by bivariate correlation analysis and multiple linear regression
*P < 0.05
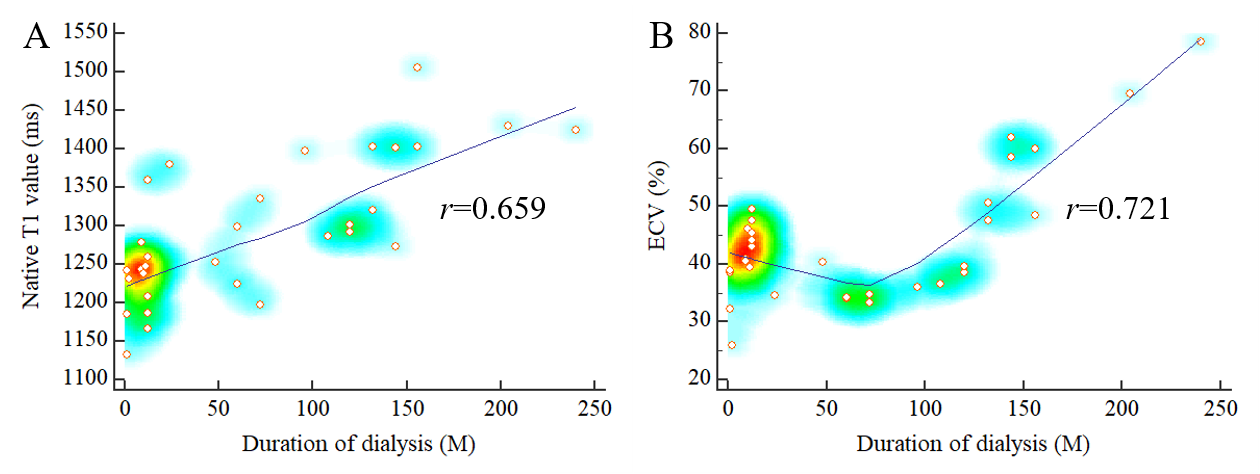
Figure 1. Correlation curves of CMR parameters and duration of dialysis.
A. Native T1 value correlates well with duration of dialysis (r=0.659, P<0.05). B. ECV correlates well with duration of dialysis (r=0.721, P<0.05).
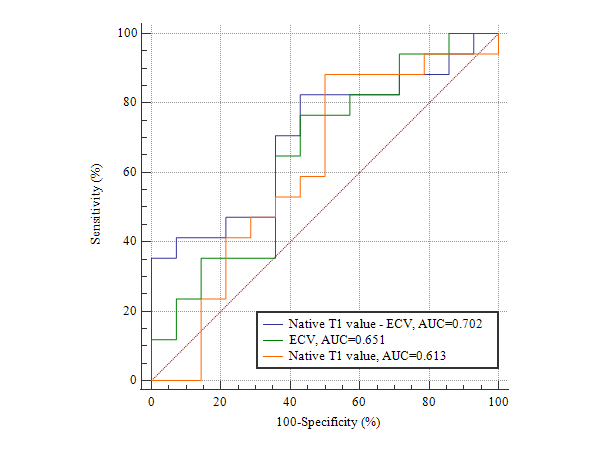
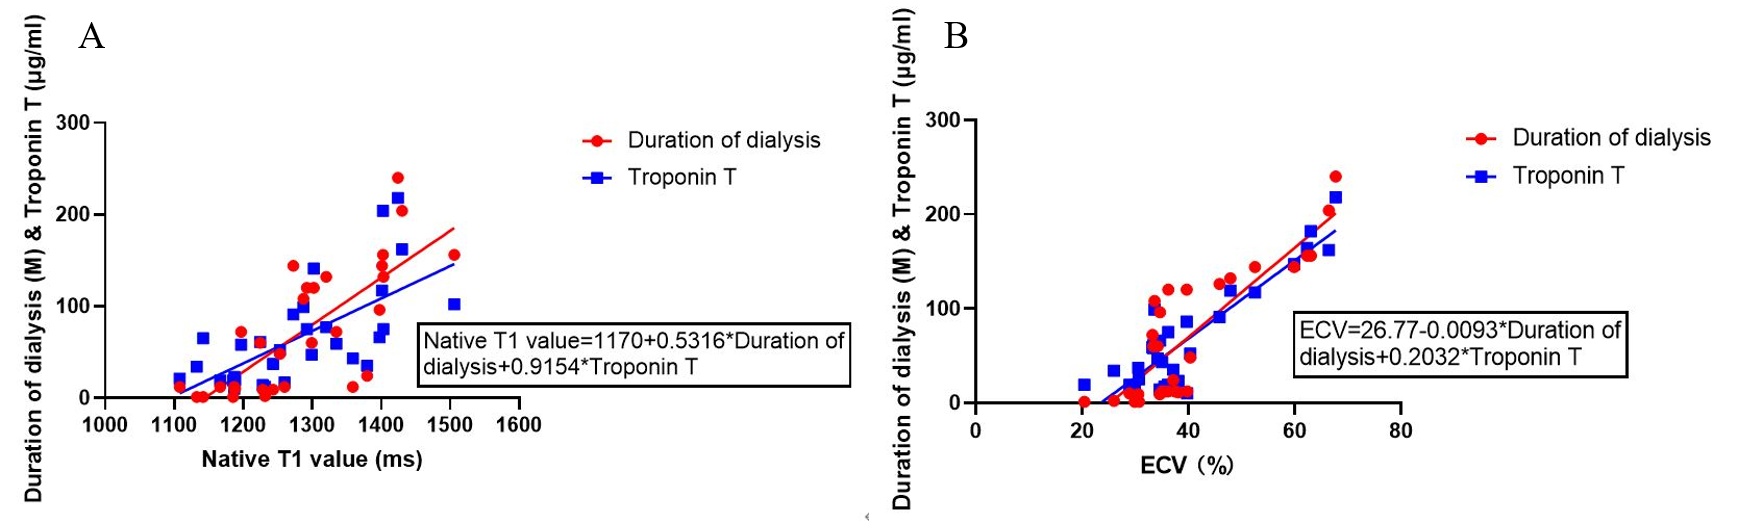
Figure 3. Multiple linear regressions of native T1 value and ECV.
A. Native T1 value correlates well with duration of dialysis and Troponin T (P<0.05).
B. ECV correlates well with duration of dialysis and Troponin T (P<0.05).