1391
Assessment of Cardiomyopathy at Different CKD Stages using Free-breathing Simultaneous Myocardial T1, T2 and T1ρ Mapping: Initial Experience1School of Biomedical Engineering, ShanghaiTech University, Shanghai, China, 2Shanghai Clinical Research and Trial Center, Shanghai, China, 3Department of Cardiovascular Medicine, Ruijin Hospital Lu Wan Branch, Shanghai Jiao Tong University School of Medicine, Shanghai, China
Synopsis
Keywords: Myocardium, Cardiovascular, Quantitative Imaging
Motivation: Chronic kidney disease (CKD) leads to significantly increased risk of cardiovascular death, highlighting the need for a non-contrast and non-invasive method to detect potential cardiomyopathy.
Goal(s): To evaluate the performance of cardiac multi-parametric mapping in assessing cardiomyopathy in CKD patients.
Approach: A recently proposed free-breathing multi-parametric mapping (FB-MultiMap) technique was employed to obtain myocardial T1, T2 and T1ρ maps of CKD patients. The parametric values were compared between healthy controls, stage 2, and stage 3-5 CKD patients.
Results: Myocardial T1, T2 and T1ρ exhibit significant differences between early-stage and moderate-to-end-stage CKD patients, indicating their potential for assessing the progression of cardiomyopathy in CKD.
Impact: FB-MultiMap may serve as an effective and easy-to-use tool for early diagnosis and monitoring of cardiomyopathy in CKD, potentially improving the outcome of CKD patients.
Introduction
Chronic kidney disease (CKD) increases the risk of cardiovascular death. Early diagnosis and intervention of uremic cardiomyopathy (UC) could improve the outcome of CKD, highlighting the need of an effective tool of assessing UC1. CMR parametric mapping is able to detect pathological changes in myocardium non-invasively2. T1 parameter is sensitive to inflammation, amyloid and iron deposition, and prolonged T2 relaxation time is typically associated with edema, injury, and inflammation. Myocardial fibrosis is commonly diagnosed with contrast-enhanced techniques, which however are not applicable to CKD with renal dysfunction. For contrast-free myocardial fibrosis imaging, T1ρ has emerged as a promising parameter, which is sensitive to the macromolecular content such as collagen changes in myocardium. T1ρ has demonstrated the ability of detecting focal and diffuse myocardial fibrosis in various cardiomyopathies3-5. Therefore, contrast-free comprehensive myocardial tissue characterization of CKD could be achieved with cardiac T1, T2 and T1ρ mapping. In this study, we explored the utility of a recently developed free-breathing multi-parametric mapping (FB-MultiMap) technique6, which produce co-registered T1, T2 and T1ρ maps in a single scan, in assessing cardiomyopathy in CKD patients.Methods
With IRB approval and written informed consent, we recruited 15 healthy controls and 32 CKD patients, among whom 19 were in CKD stage 2 and 13 were in CKD stage 3-5. T1, T2 and T1ρ maps were obtained using the FB-MultiMap technique6 with the following imaging parameters: FOV=320×280mm2, voxel size=2.08×1.67×8mm2, short-axis orientation, TR/TE=2.84/1.35ms, flip angle=45/35/70/50º, four T2-preapraed (preparation duration = 35, 45, 55 and 65 ms), four T1ρ-prepared (spin-lock duration = 16, 30, 40 and 50 ms), GRAPPA factor=2. Mean T1, T2 and T1ρ values were calculated in a Region of Interest (ROI) of septum in the middle short-axis slice as illustrated in Figure 1. The mean parameters were compared between healthy subjects and CKD patients of stage 2 and stage 3-5 using one-way ANOVA. P < 0.05 indicates statistical significance.Results & Discussion
The demographics of the healthy controls and patients are summarized in Table 1. Figure 1 compares the parameter maps of a typical CKD patient and a healthy subject. This patient exhibits increased T1, T2, and T1ρ values, suggesting the presence of myocardial edema and fibrosis. Significant differences in T1, T2, and T1ρ values were observed between the stage 2 and stage 3-5 CKD patient groups (Table 1, Figure 2), indicating the capability of the parameters estimated with FB-Multimap in detecting the progression of cardiomyopathy in different stages of CKD. Nonetheless, there is no significant difference in T2 and T1ρ between the healthy subjects and CKD patients of stage 2 (Figure 2). One possible reason is that edema and fibrosis may not be obvious in early-stage CKD patients. As inflammation, edema and fibrosis all could lead to increased T1, noticeable elevated T1 values are observed for the stage 2 CKD patients compared with healthy subjects. Although the findings are promising, it is noted that the statistical power may be limited by the small sample size in this study. Further validation in a large cohort of patients is essential.Conclusion
Myocardial T1, T2 and T1ρ values estimated with the FB-MultiMap technique exhibit significant differences between early-stage and moderate-to-advanced CKD patients, suggesting that FB-MultiMap may serve as effective, contrast-free and non-invasive tool for early diagnosis and monitoring of cardiomyopathy in CKD, potentially improving the outcome of CKD patients.Acknowledgements
No acknowledgement found.References
1. Tonelli M, Wiebe N, Culleton B, House A, Rabbat C, Fok M, et al. Chronic kidney disease and mortality risk: a systematic review. J Am Soc Nephrol. 2006;17(7):2034-47.
2. Messroghli DR, Moon JC, Ferreira VM, Grosse-Wortmann L, He T, Kellman P, et al. Clinical recommendations for cardiovascular magnetic resonance mapping of T1, T2, T2* and extracellular volume: A consensus statement by the Society for Cardiovascular Magnetic Resonance (SCMR) endorsed by the European Association for Cardiovascular Imaging (EACVI). J Cardiovasc Magn Reson. 2017;19(1):75.
3. Thompson EW, Kamesh Iyer S, Solomon MP, Li Z, Zhang Q, Piechnik S, et al. Endogenous T1rho cardiovascular magnetic resonance in hypertrophic cardiomyopathy. J Cardiovasc Magn Reson. 2021;23(1):120.
4. Zhang Y, Zeng W, Chen W, Chen Y, Zhu T, Sun J, et al. MR extracellular volume mapping and non-contrast T1ρ mapping allow early detection of myocardial fibrosis in diabetic monkeys. European radiology. 2019;29:3006-16.
5. Bustin A, Toupin S, Sridi S, Yerly J, Bernus O, Labrousse L, et al. Endogenous assessment of myocardial injury with single-shot model-based non-rigid motion-corrected T1rho mapping. J Cardiovasc Magn Reson. 2021;23(1):119.
6. Lyu Z, Hua S, Xu J, Shen Y, Guo R, Hu P, Qi H. Free-Breathing Simultaneous Native Myocardial T1, T2 and T1ρ Mapping with Cartesian Acquisition and Dictionary Matching. J Cardiovasc Magn Reson. in press.
Figures
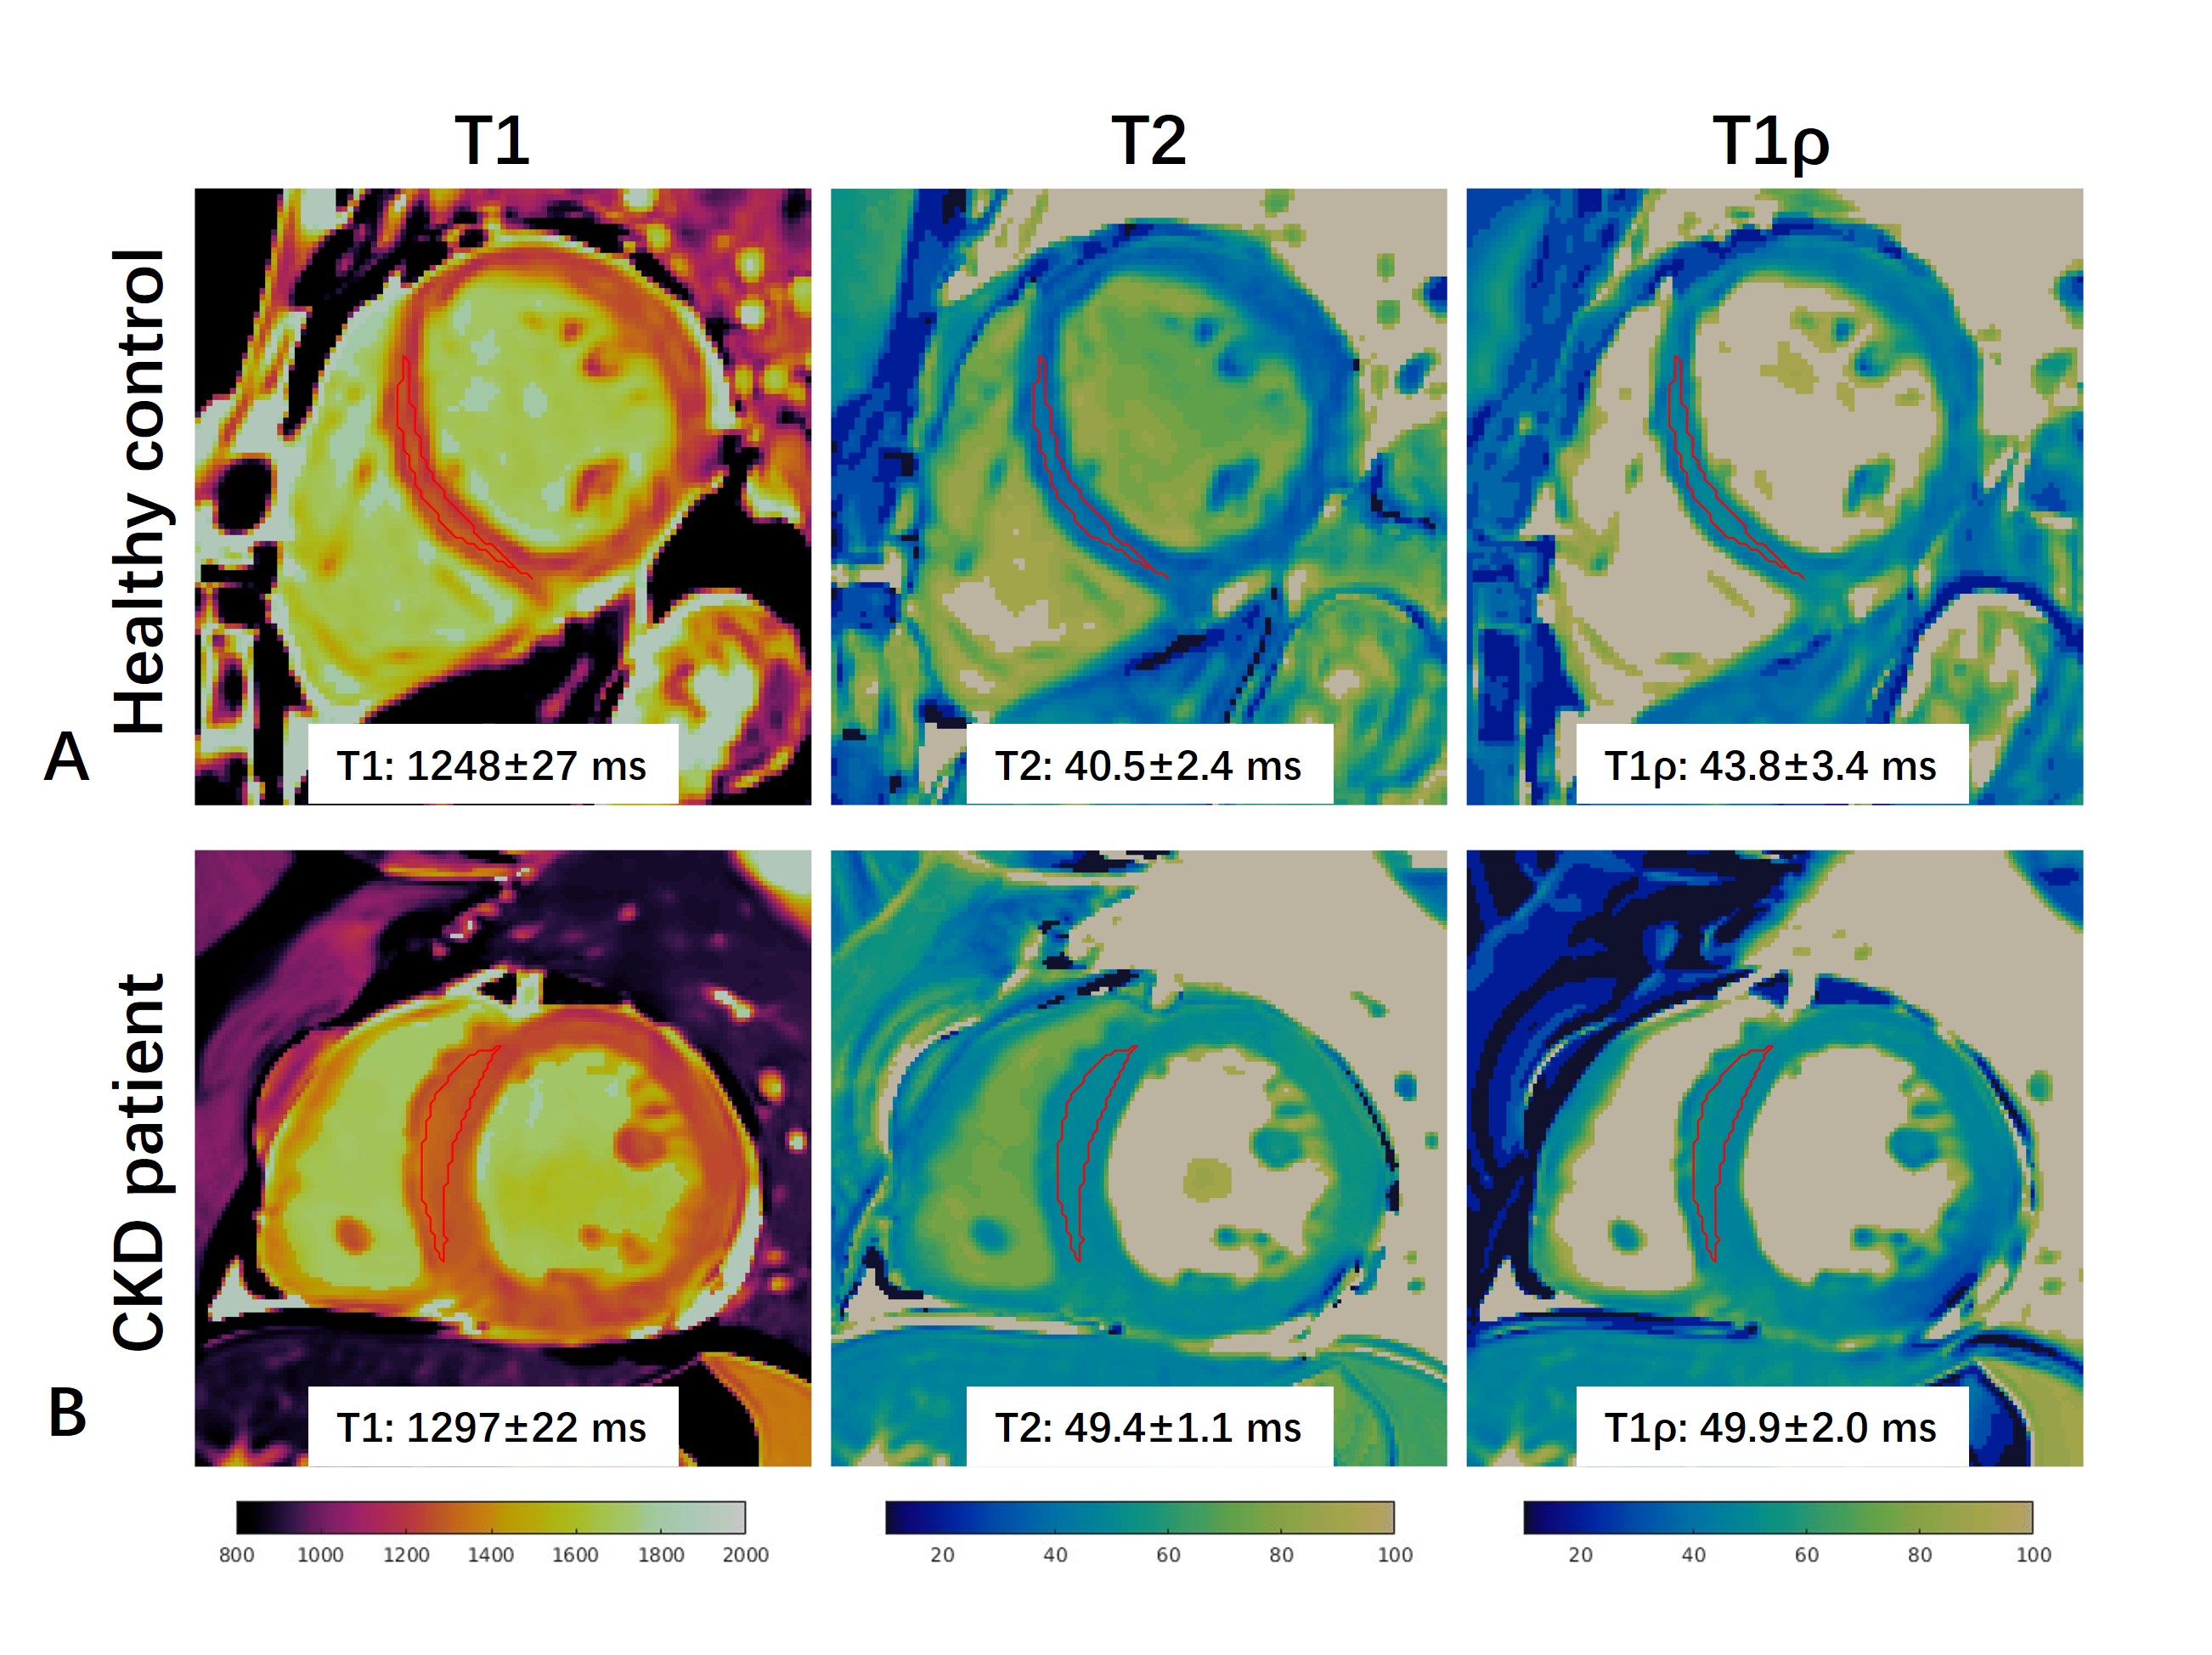
Figure 1 Representative T1, T2 and T1ρ maps with FB-MultiMap in a heathy subject (A) and a stage 3 CKD patient (B).
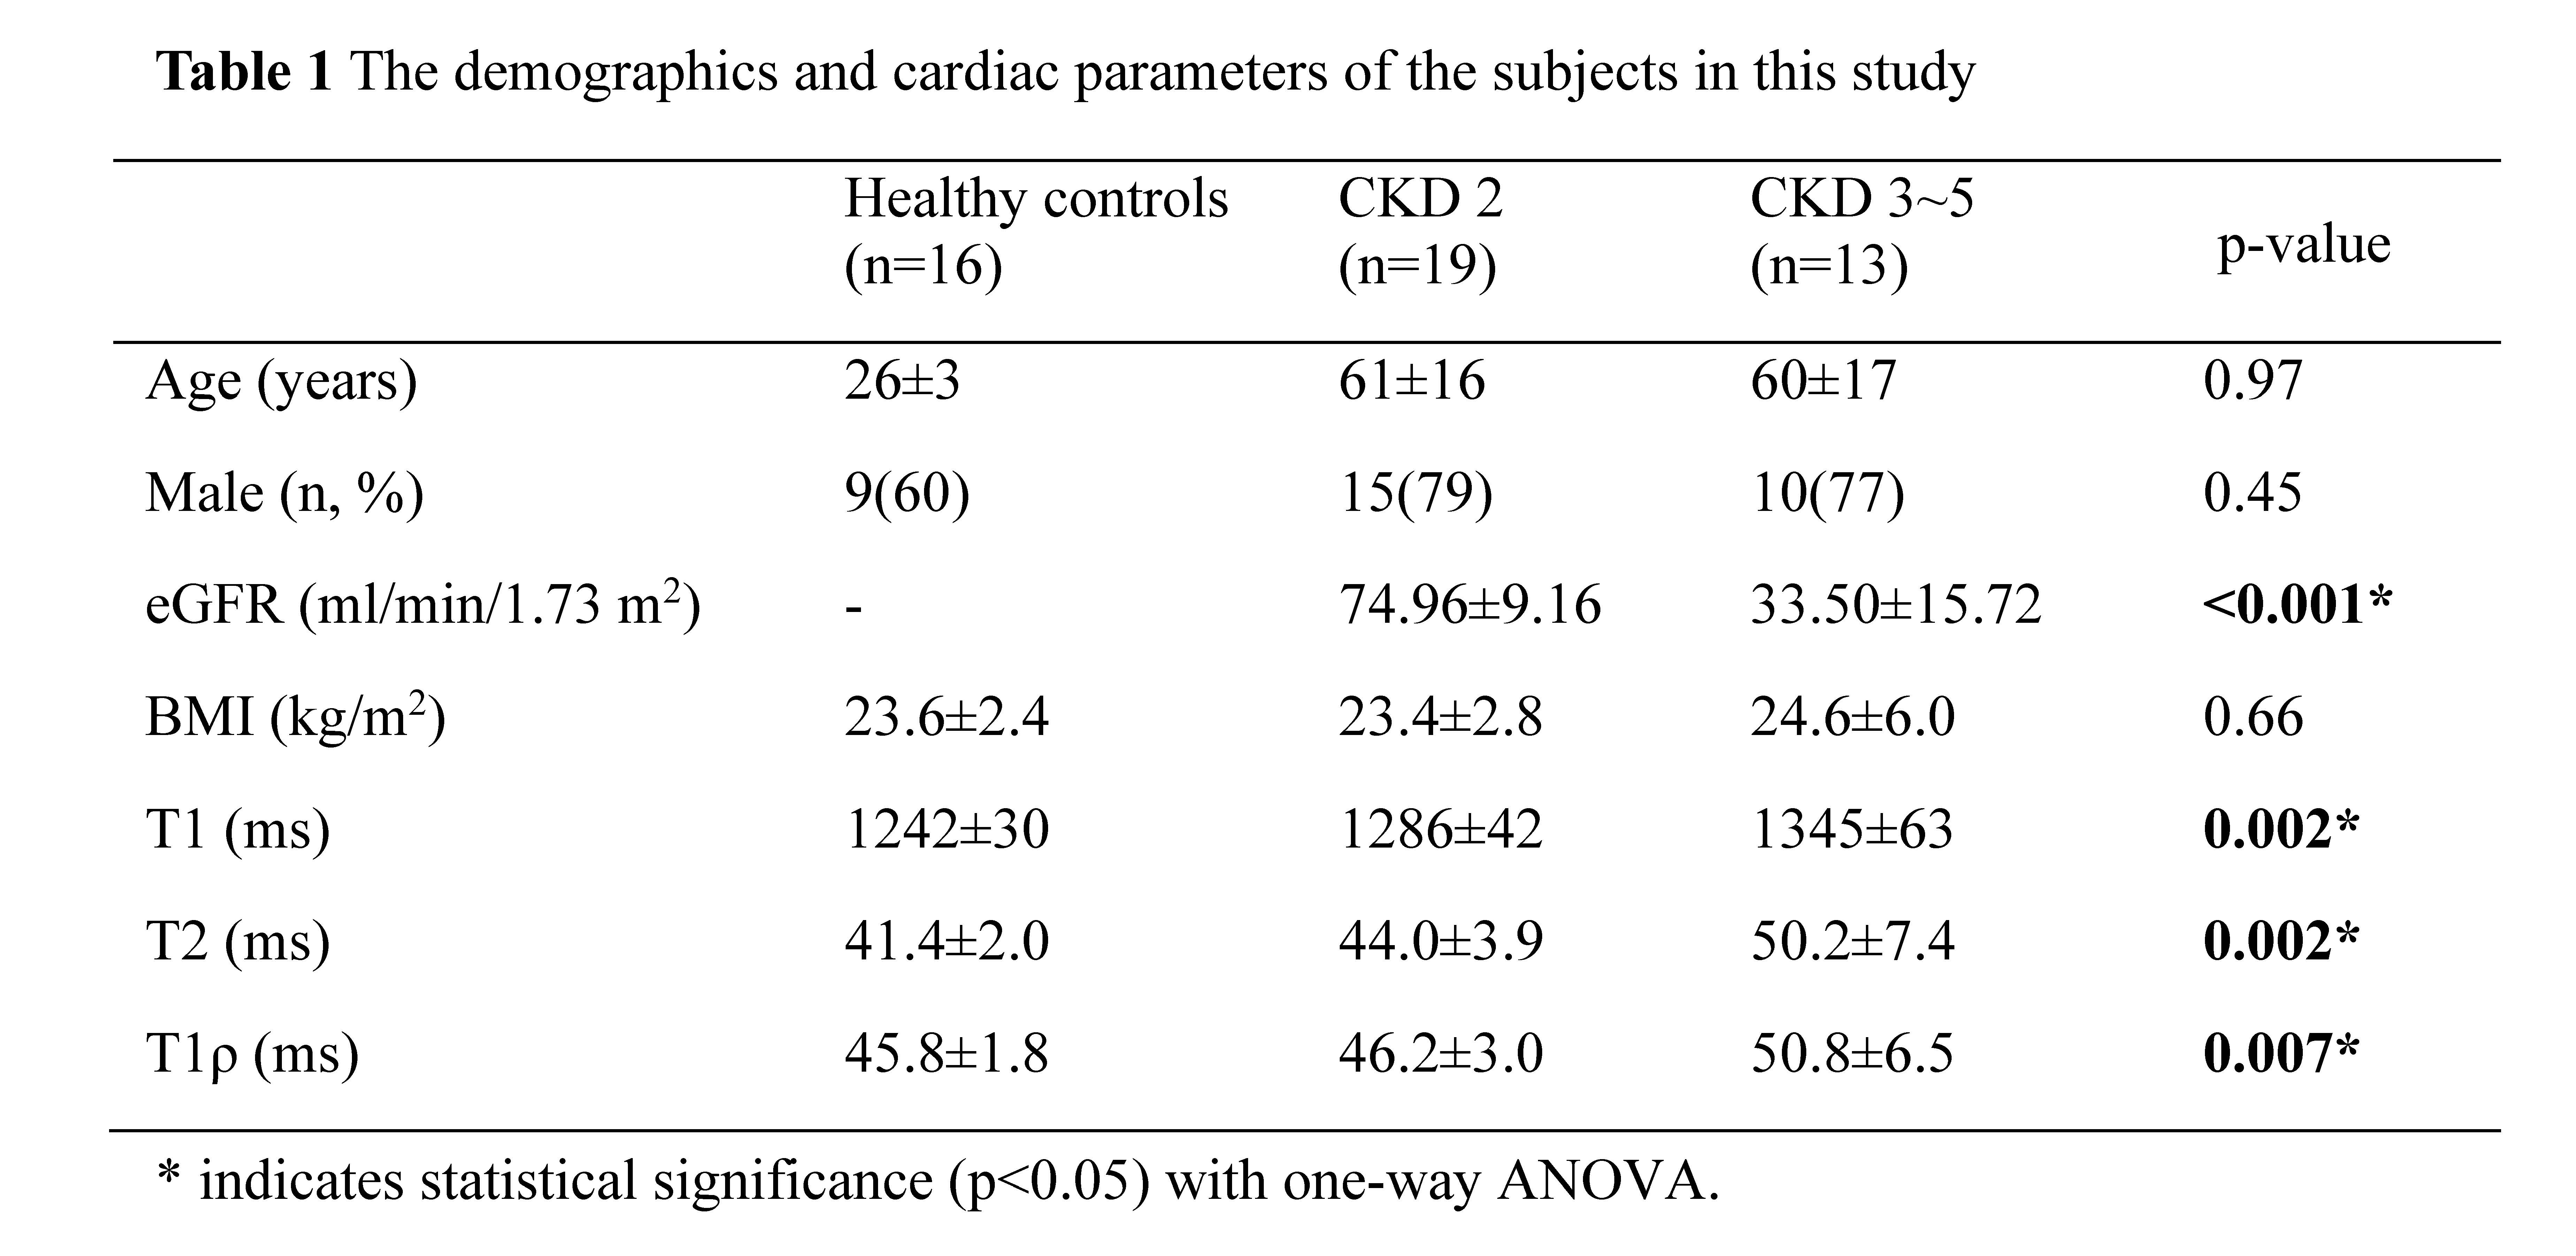
Table 1 The demographics and cardiac parameters of the subjects in this study
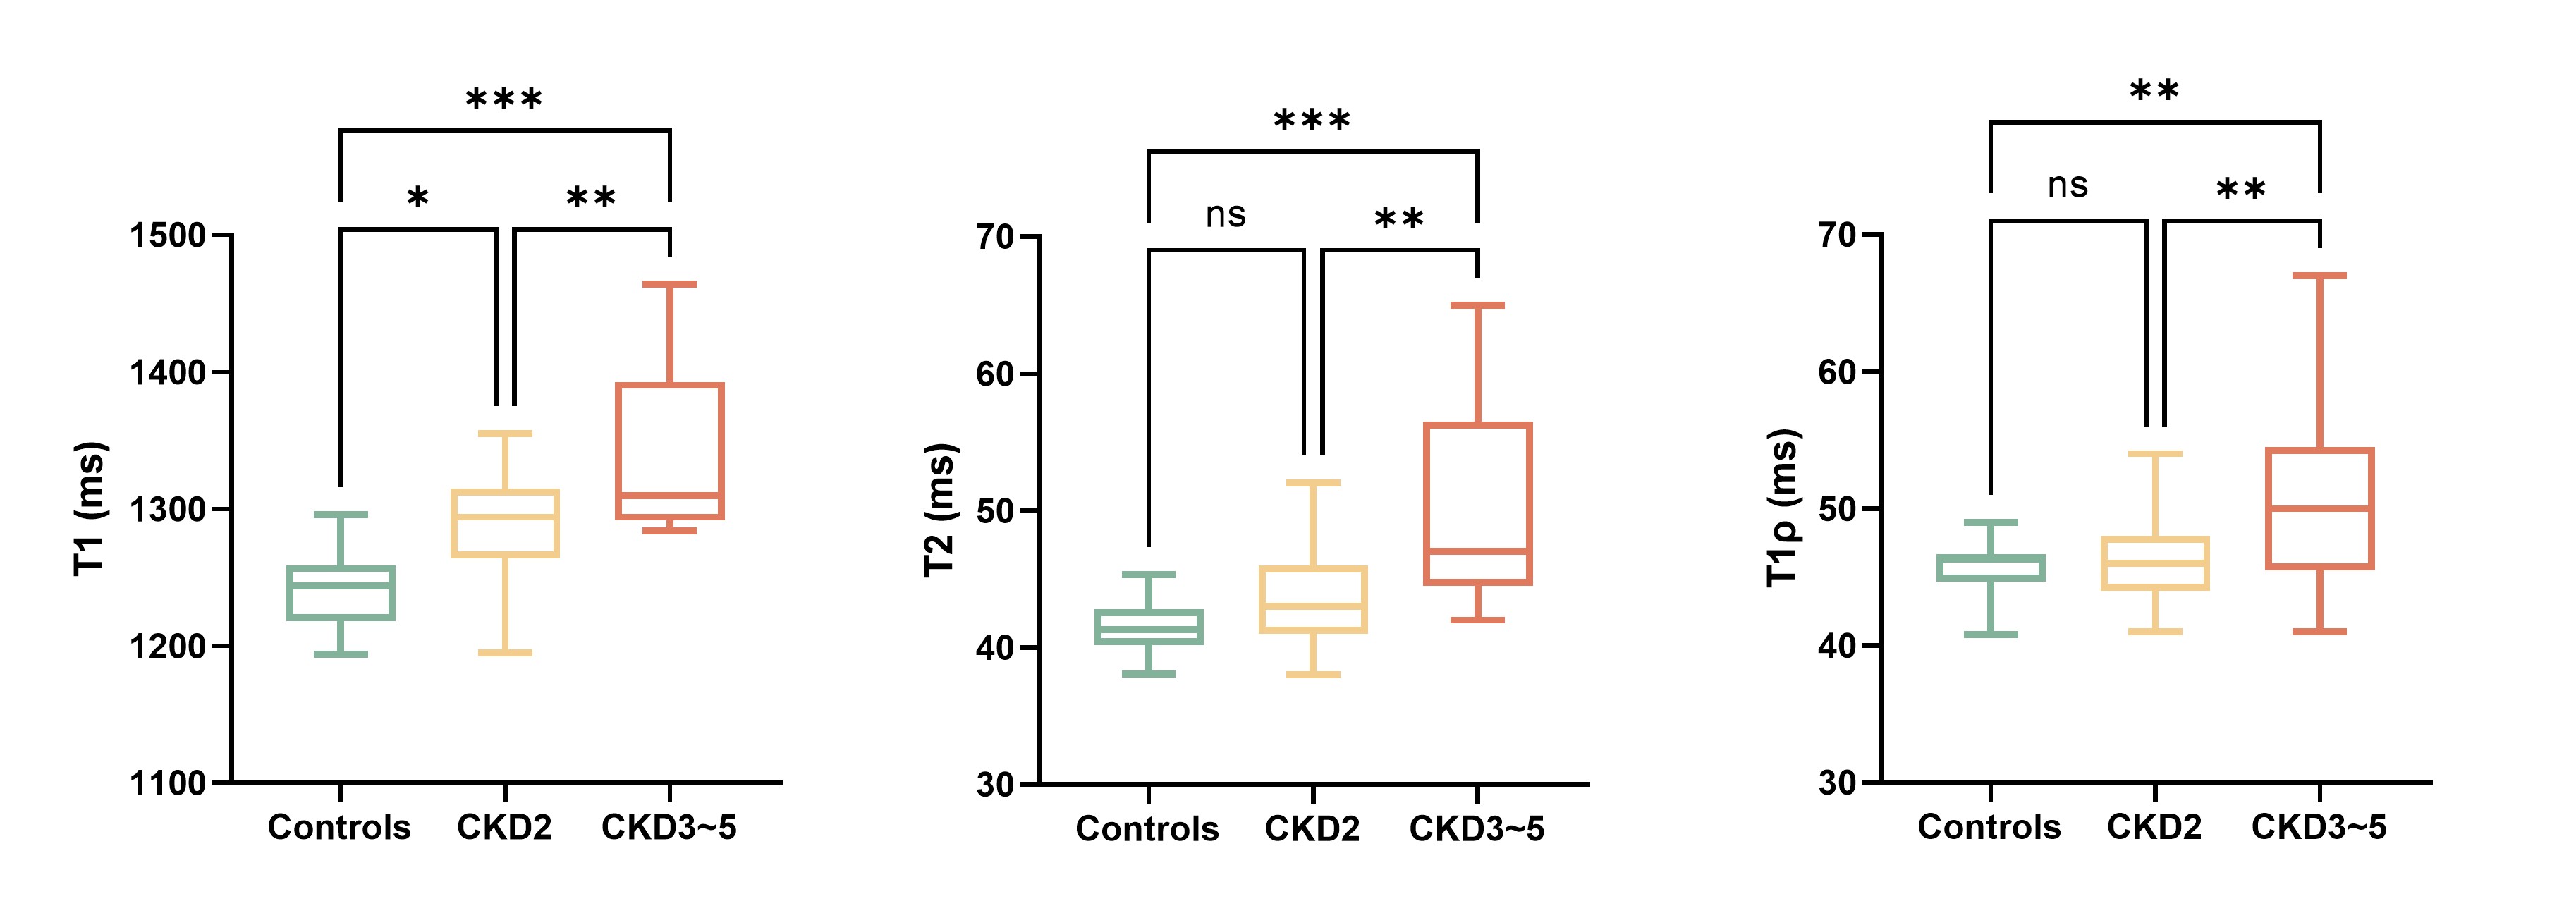
Figure 2 Comparison of T1, T2 and T1ρ values between healthy controls and CKD patients of different stages.