1390
T1 Mapping and Extracellular Volume Fraction in Patients with Suspected Acute Myocarditis: A Prognosis Study1Fuwai Hospital, Peking Union Medical College, Chinese Academy of Medical Sciences, Beijing, China, 2Chinese Academy of Medical Sciences (CAMS) and Peking Union Medical College (PUMC), Beijing, China, 3Siemens Healthineers, Los Angeles, CA, United States, 4Siemens Shenzhen Magnetic Resonance Ltd., Shenzhen, China, 5Key Laboratory of Cardiovascular Imaging (Cultivation), Chinese Academy of Medical Sciences, Beijing, China
Synopsis
Keywords: Inflammation, Infiltration, Heart
Motivation: The prognostic value of T1 mapping and extracellular volume fraction (ECV) in acute myocarditis has not yet been supported by high-quality, evidence-based medicine.
Goal(s): To investigate the prognostic value of T1 mapping and ECV in patients with acute suspected myocarditis.
Approach: Patients meeting the recommended clinical criteria for suspected myocarditis were enrolled. The potential value for predicting MACE was explored using Cox proportional hazards models.
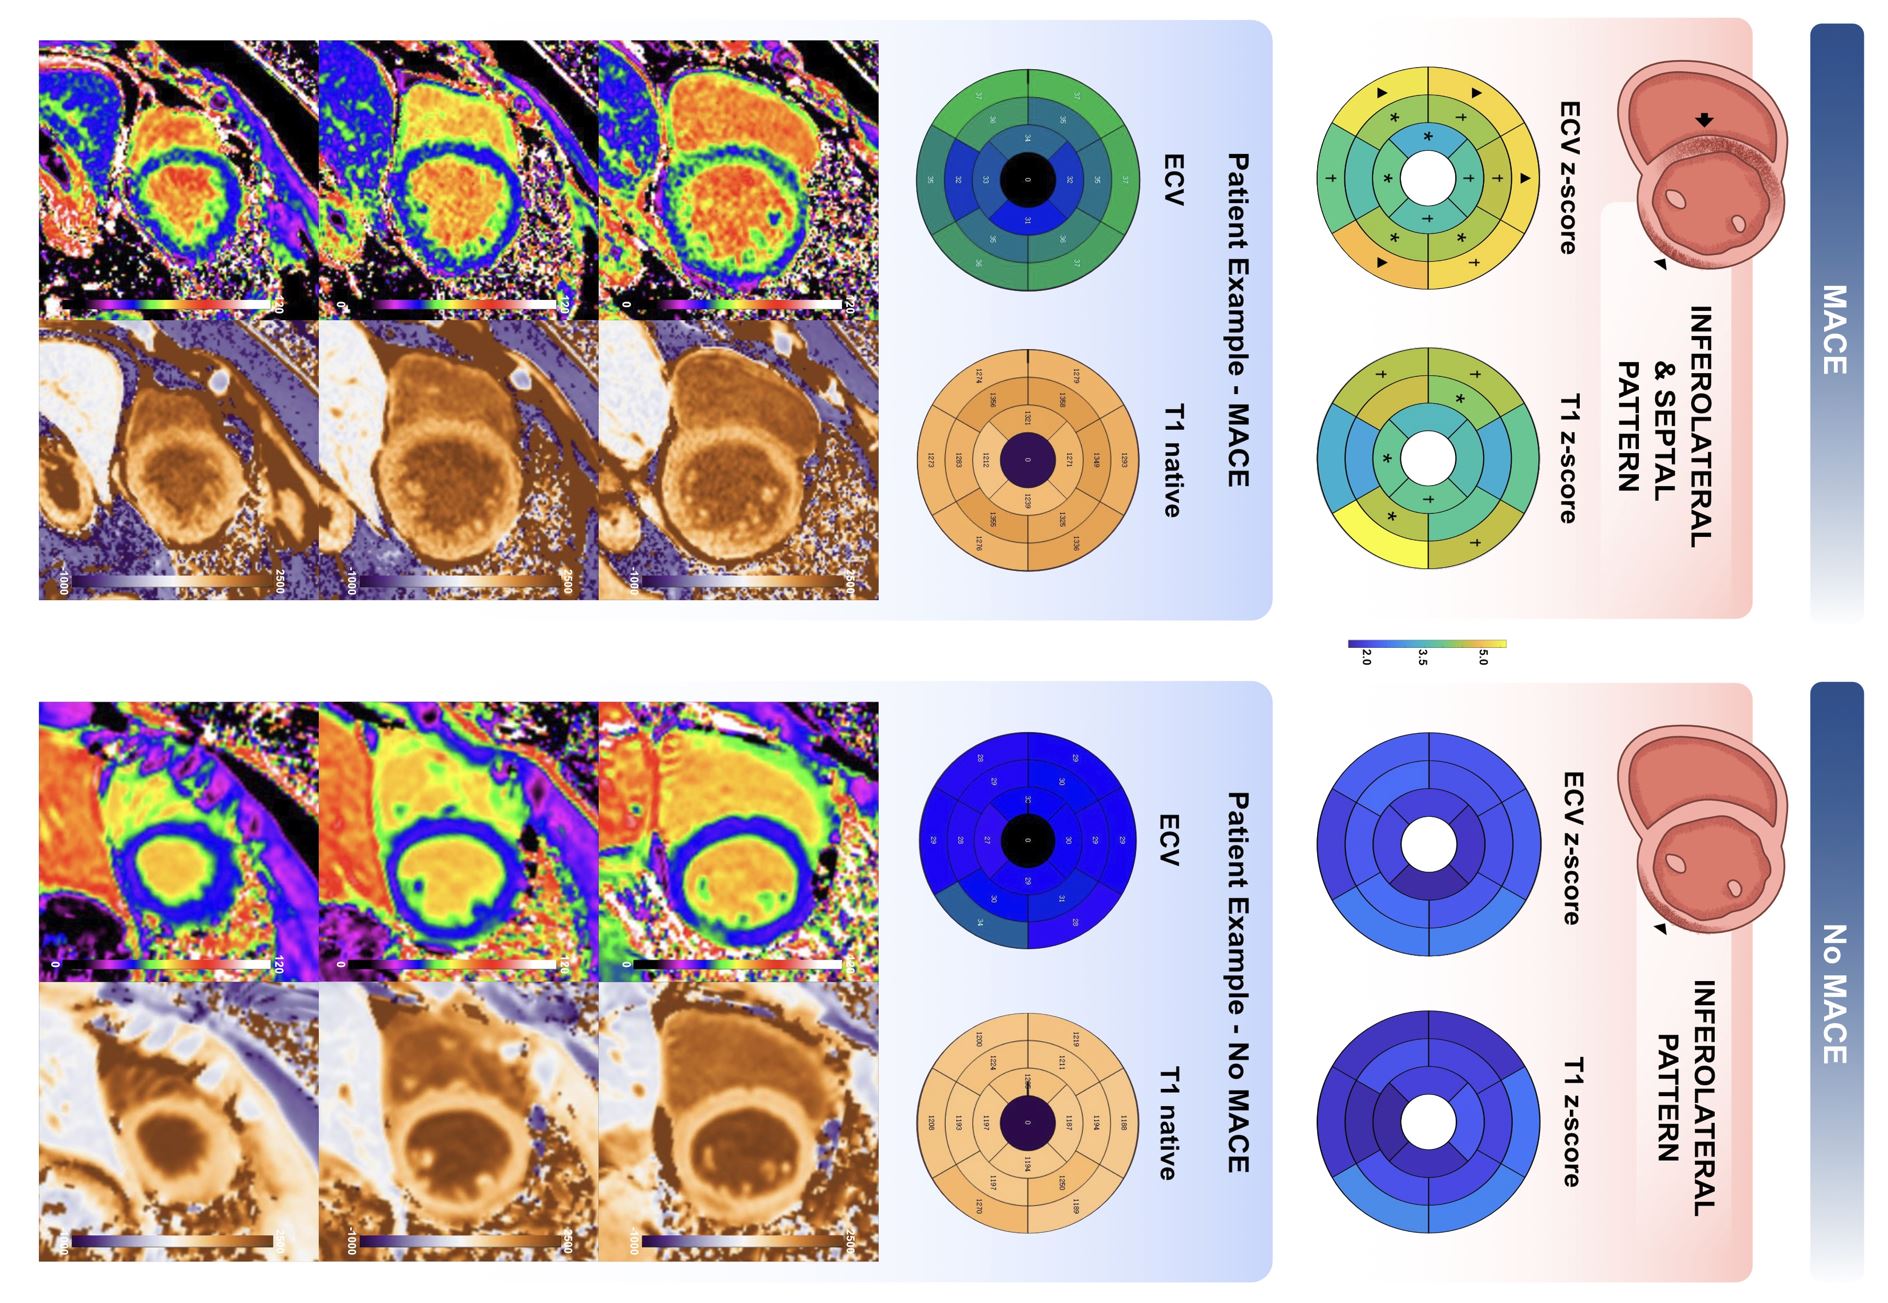
Results: Patients with MACE showed higher global native T1 and ECV z scores and were more likely to have tissue changes in interventricular septum. Quantitative mapping parameters have incremental prognostic value beyond clinical variables and conventional CMR parameters.
Impact: Our study reveals the prognostic predictive ability of native T1 and ECV in myocarditis. The application of mapping techniques will further contribute to the understanding of the pathophysiology of heart disease and will guide the development of effective therapeutic approaches.
Introduction
Myocarditis is a multifaceted, heterogeneous heart disease that has received widespread attention in recent years(1). Long-term follow-up studies of patients with acute myocarditis have shown that approximately 10-52% of patients will regress to dilated cardiomyopathy, and 1-7 % of patients die. The currently recognized prognostic factor is late gadolinium enhancement (LGE), and several large cohort studies have demonstrated the prognostic efficacy of the amount of enhancement and certain specific distributions and locations. However, LGE may not be able to detect subtle diffuse myocardial fibrosis(2). The Lake Louise criteria (LLC) is the recommended diagnostic CMR imaging criteria for patients with suspected myocarditis, and has been revised in 2018 with the implementation of mapping techniques(3,4). T1 mapping and the extracellular volume fraction (ECV) are capable of identifying diffuse and subtle myocardial tissue changes and have been shown to have significant prognostic efficacy in many cardiac diseases, but there is not yet high-quality enquiry-based medical evidence for its value in the prognosis of myocarditis. Furthermore, fewer prognostic studies of myocarditis have been conducted in Asian populations to our knowledge. In this context, our study investigated the predictive value of T1 mapping and ECV in patients with clinically suspected acute myocarditis.Methods
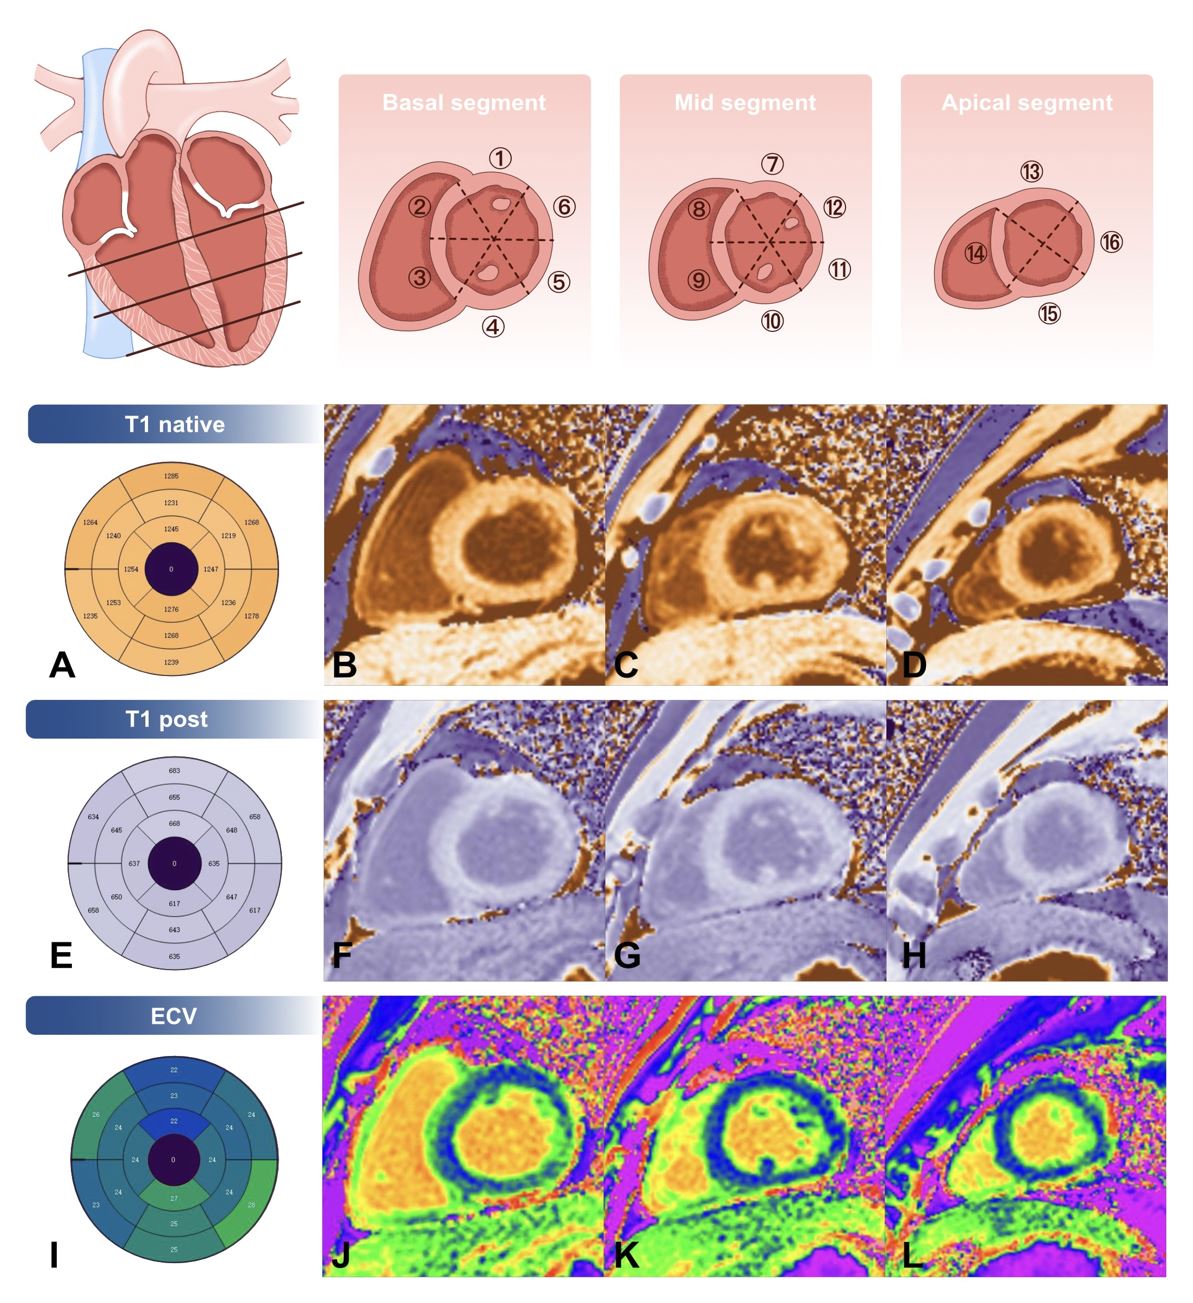
Consecutive patients with suspected myocarditis who underwent CMR were retrospectively enrolled in this study. The inclusion criteria was based upon the clinical and imaging diagnostic criteria given by the position statement of the European Society of Cardiology (ESC) Working Group on Myocardial and Pericardial Diseases (5). Patients were excluded if they had evidence of coronary artery disease or other pre-existing cardiac disease or systemic disease with interpretable symptoms. The identification of composite endpoint events was based on the electronic medical record system of hospital or telephone interviews. The primary end point was a composite of major adverse cardiovascular events (MACE) including cardiac death, hospitalization for heart failure, heart transplantation, recurrent myocarditis, and recorded sustained ventricular arrhythmia. All patients underwent CMR at 3.0 T scanners using a standardized, routine imaging protocol. We averaged the native myocardial T1 measurements and ECV fraction of all 16 segments to yield global T1 and ECV fraction values, respectively (Figure 1). To enable combined analysis of multicenter and multivendor data, the T1 and ECV values were converted to z scores by using the cardiac MRI-specific reference value. The native T1 and ECV values were converted into dichotomous variables according to the cutoff values of 2 standard deviations (SD) above the mean of the reference range, as well as ranking by 2n-times SD of the normal range.Results
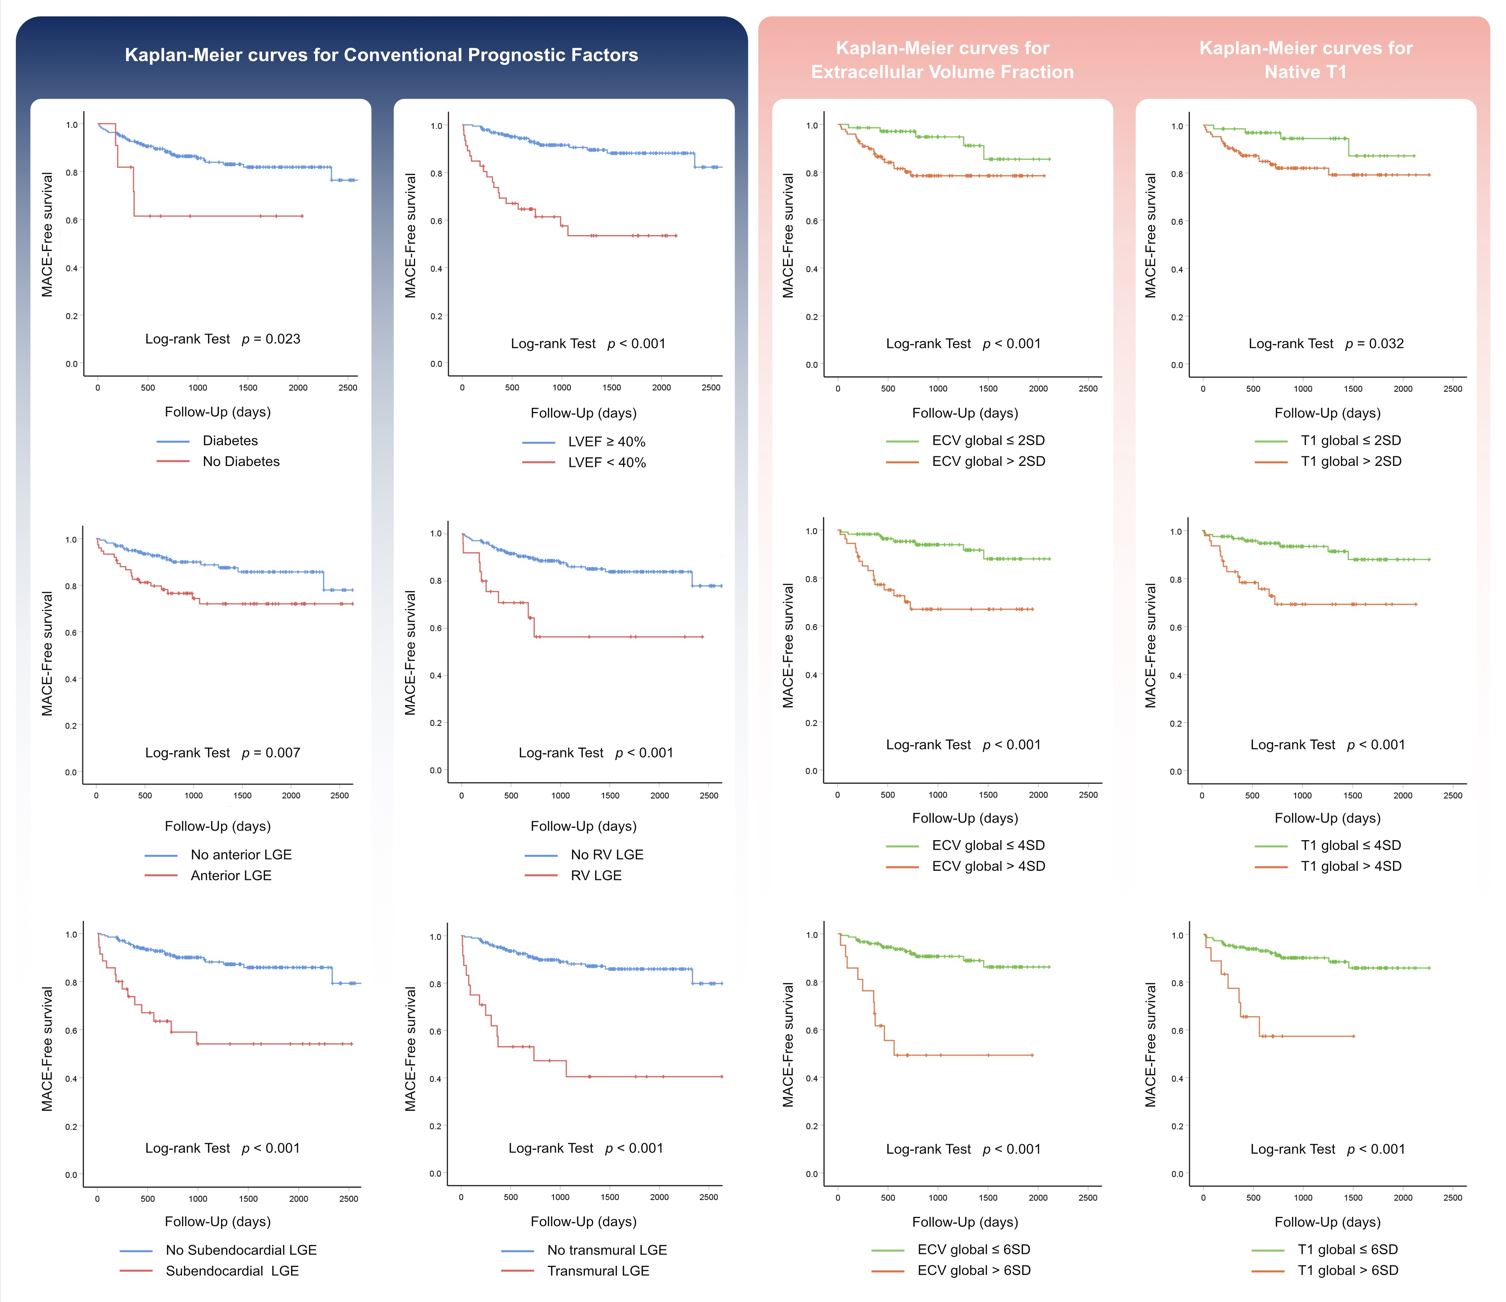
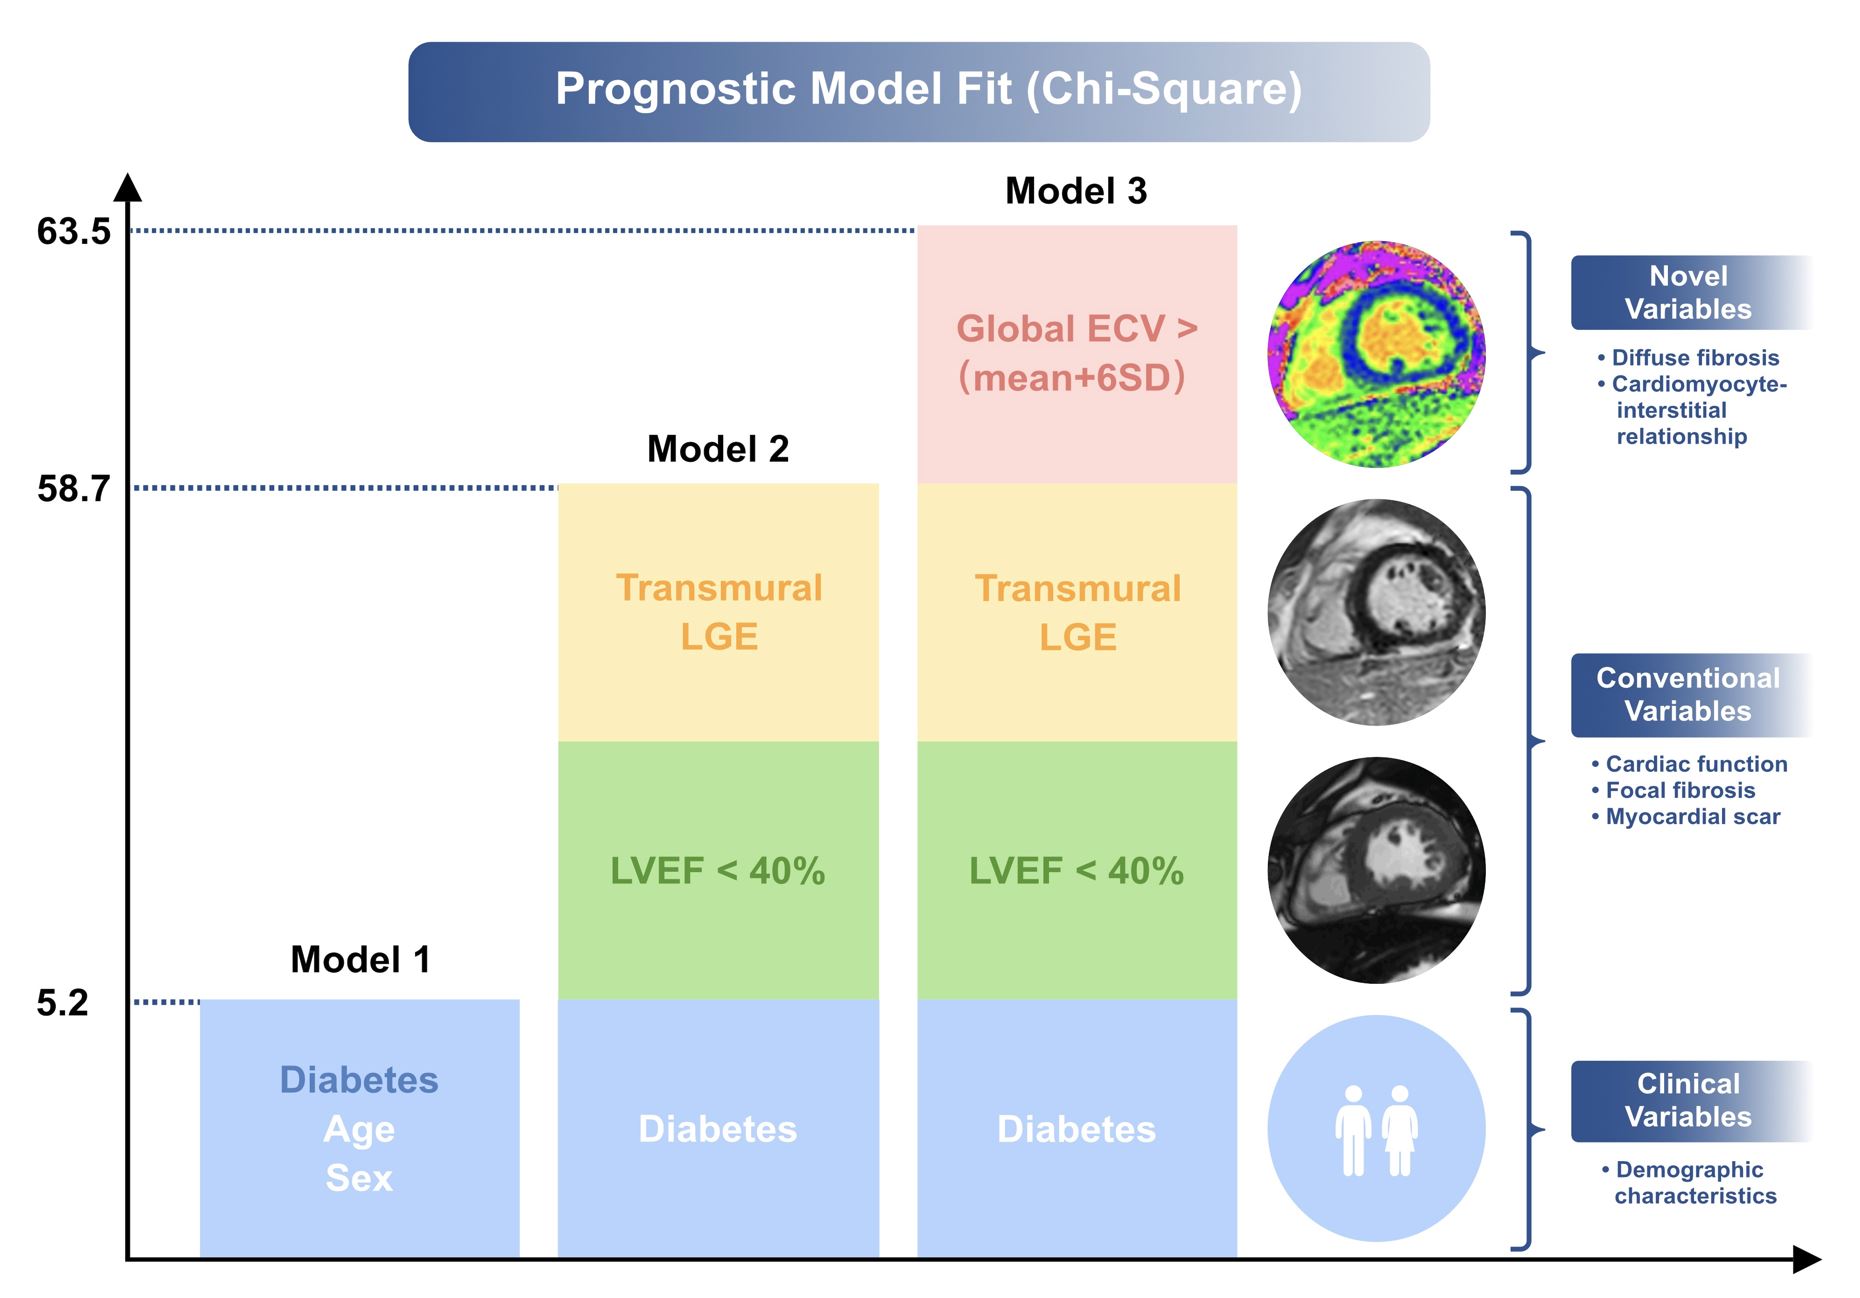
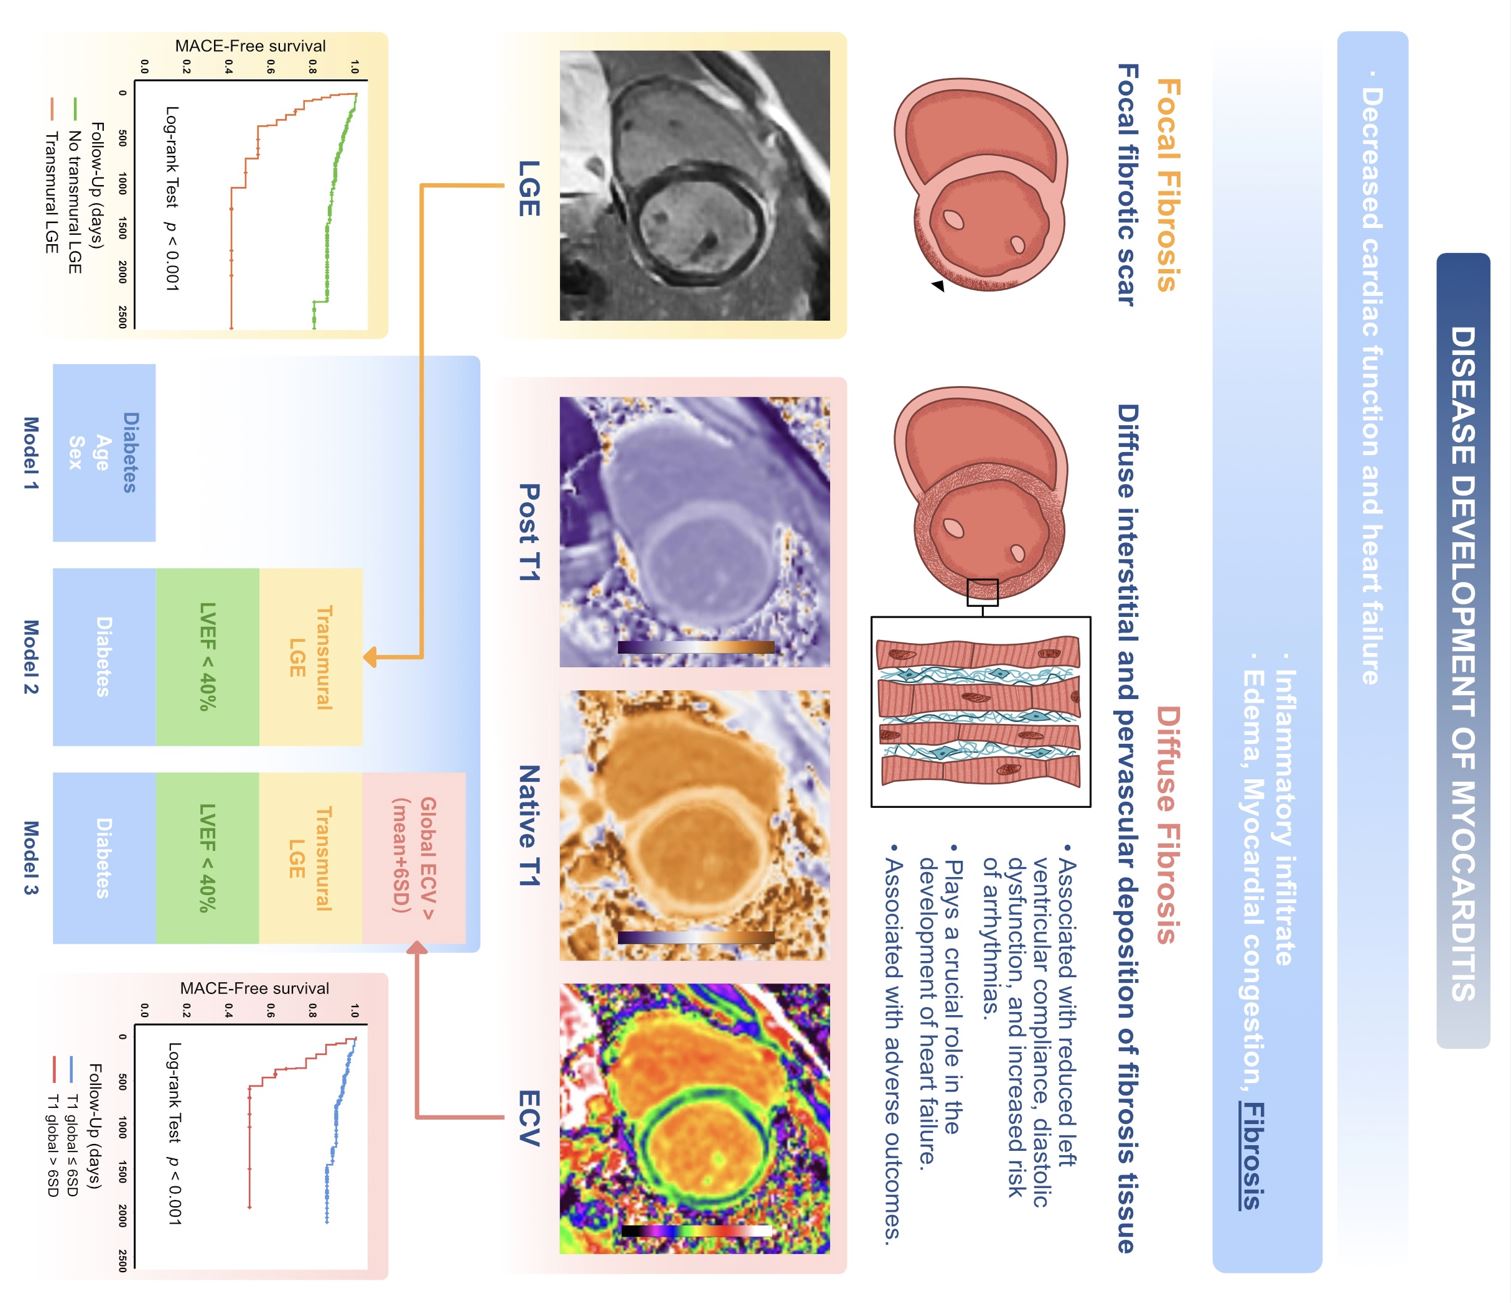
235 consecutive patients met our final inclusion criteria. Median follow-up was 43.0±3.6 months. Of the 235 patients, 37 patients (15.7%) experienced MACE. Of all the patients, 196 had positive LGE (83.4%), with the distribution and pattern of enhancement showed significant differences between the two groups. Anterior LGE, right ventricle LGE, subendocardial LGE and transmural LGE was more frequently observed in patients with MACE. The global native T1 and ECV z scores were significantly higher in the MACE group compared with the No MACE group (p=0.001). Although both groups showed elevated ECV and native T1 z score in the inferolateral wall, as in the typical distribution pattern of LGE in myocarditis, MACE group more frequently manifested with anterior wall and septal cardiac tissue abnormalities (Figure 2). Global native T1 and ECV z score were independently associated with subsequent MACE. Kaplan-Meier survival curves showed that patients with LVEF <40%, transmural LGE, native T1 or ECV higher than the mean plus 2 SD, 4 SD and 6 SD had significantly higher incidence of MACE (Figure 3). In multivariate stepwise analyses, global ECV greater than 6 SD above the mean of the normal range (ECV6SD) was the strongest prognostic factor, followed by LVEF<40% and transmural LGE, respectively. Model 1 including the clinical variables sex, age and diabetes mellitus predicted MACE with a chi-square test of 5.15 (p < 0.001) and Harrel’s C-index of 0.619. Model 2 including diabetes mellitus, LVEF<40% and transmural LGE, the model chi-square test significantly increased to 58.695 (p < 0.001) and C-index to 0.745. By adding ECV6SD to model 2, the model chi-square test increased to 63.47 (p < 0.001) and C-index to 0.796. ECV6SD was the strongest independent prognostic factor in the univariate and multivariate analyses (Figure 4 and Central illustration).Conclusions
Quantitative mapping parameters provide outstanding prognostic predictive capabilities, presenting fresh insights into patient management from a histological standpoint. Given its profound capacity for myocardial tissue characterization, CMR stands out as a vital technique in identifying patients at risk for myocarditis.Acknowledgements
NAReferences
1. Ammirati E, Moslehi JJ. Diagnosis and Treatment of Acute Myocarditis: A Review. JAMA. 2023;329(13):1098–1113. doi: 10.1001/jama.2023.3371.
2. Florian A, Ludwig A, Engelen M, et al. Left ventricular systolic function and the pattern of late-gadolinium-enhancement independently and additively predict adverse cardiac events in muscular dystrophy patients. J Cardiovasc Magn R. 2014;16(1):81. doi: 10.1186/s12968-014-0081-1.
3. Friedrich MG, Sechtem U, Schulz-Menger J, et al. Cardiovascular magnetic resonance in myocarditis: A JACC White Paper. J Am Coll Cardiol. 2009;53(17):1475–1487. doi: 10.1016/j.jacc.2009.02.007.
4. Ferreira VM, Schulz-Menger J, Holmvang G, et al. Cardiovascular Magnetic Resonance in Nonischemic Myocardial Inflammation: Expert Recommendations. J Am Coll Cardiol. 2018;72(24):3158–3176. doi: 10.1016/j.jacc.2018.09.072.
5. Caforio ALP, Pankuweit S, Arbustini E, et al. Current state of knowledge on aetiology, diagnosis, management, and therapy of myocarditis: a position statement of the European Society of Cardiology Working Group on Myocardial and Pericardial Diseases. Eur Heart J. 2013;34(33):2636–2648, 2648a–2648d. doi: 10.1093/eurheartj/eht210.
Figures