1386
Time-dependent diffusion discriminates healthy and hypertrophic mouse hearts ex vivo1Leeds Institute of Cardiovascular and Metabolic Medicine, University of Leeds, Leeds, United Kingdom, 2Cardiff University Brain Research Imaging Centre (CUBRIC), School of Psychology, Cardiff University, Cardiff, United Kingdom
Synopsis
Keywords: Myocardium, Heart, Cardiac diffusion MRI, time-dependent diffusion, free-gradient waveforms, tensor-valued diffusion encoding
Motivation: Oscillating gradient spin-echo (OGSE) diffusion MRI provides information about the cardiac microstructure that is complementary to conventional pulsed gradient spin echo (PGSE).
Goal(s): Using gradient waveforms with different frequencies enables the assessment of diffusion at sub-cellular length scales.
Approach: OGSE diffusion tensor imaging (DTI) was applied in the ex vivo mouse heart to investigate the ability of OGSE to disentangle hypertrophic from healthy hearts.
Results: Our results show that hypertrophic hearts exhibited significantly different OGSE parameters (8 of 10) compared to control hearts. These and DTI observations are in agreement with expected microstructural changes.
Impact: Gradient waveforms with different frequencies enable the assessment of diffusion at sub-cellular length scales. OGSE may potentially serve as an imaging biomarker, to enhance the specificity of measurements with DTI.
Introduction
Cardiac diffusion tensor imaging (cDTI) is a non-invasive tool for myocardial tissue characterization. It has been used in some cardiac diseases such as dilated cardiomyopathy1, amyloidosis2, infarction3, and hypertrophic4-6. Mean diffusivity (MD) and fractional anisotropy (FA) are sensitive to a range of biophysical properties as well as imaging parameters such as diffusion time (td)7. Previous work on ex vivo healthy and ischemic hearts showed the sensitivity of diffusion MRI to diffusion time or frequency8-13. To our best knowledge, we investigate for the first time, the potential of OGSE in an animal model of hypertrophy ex vivo.Methods
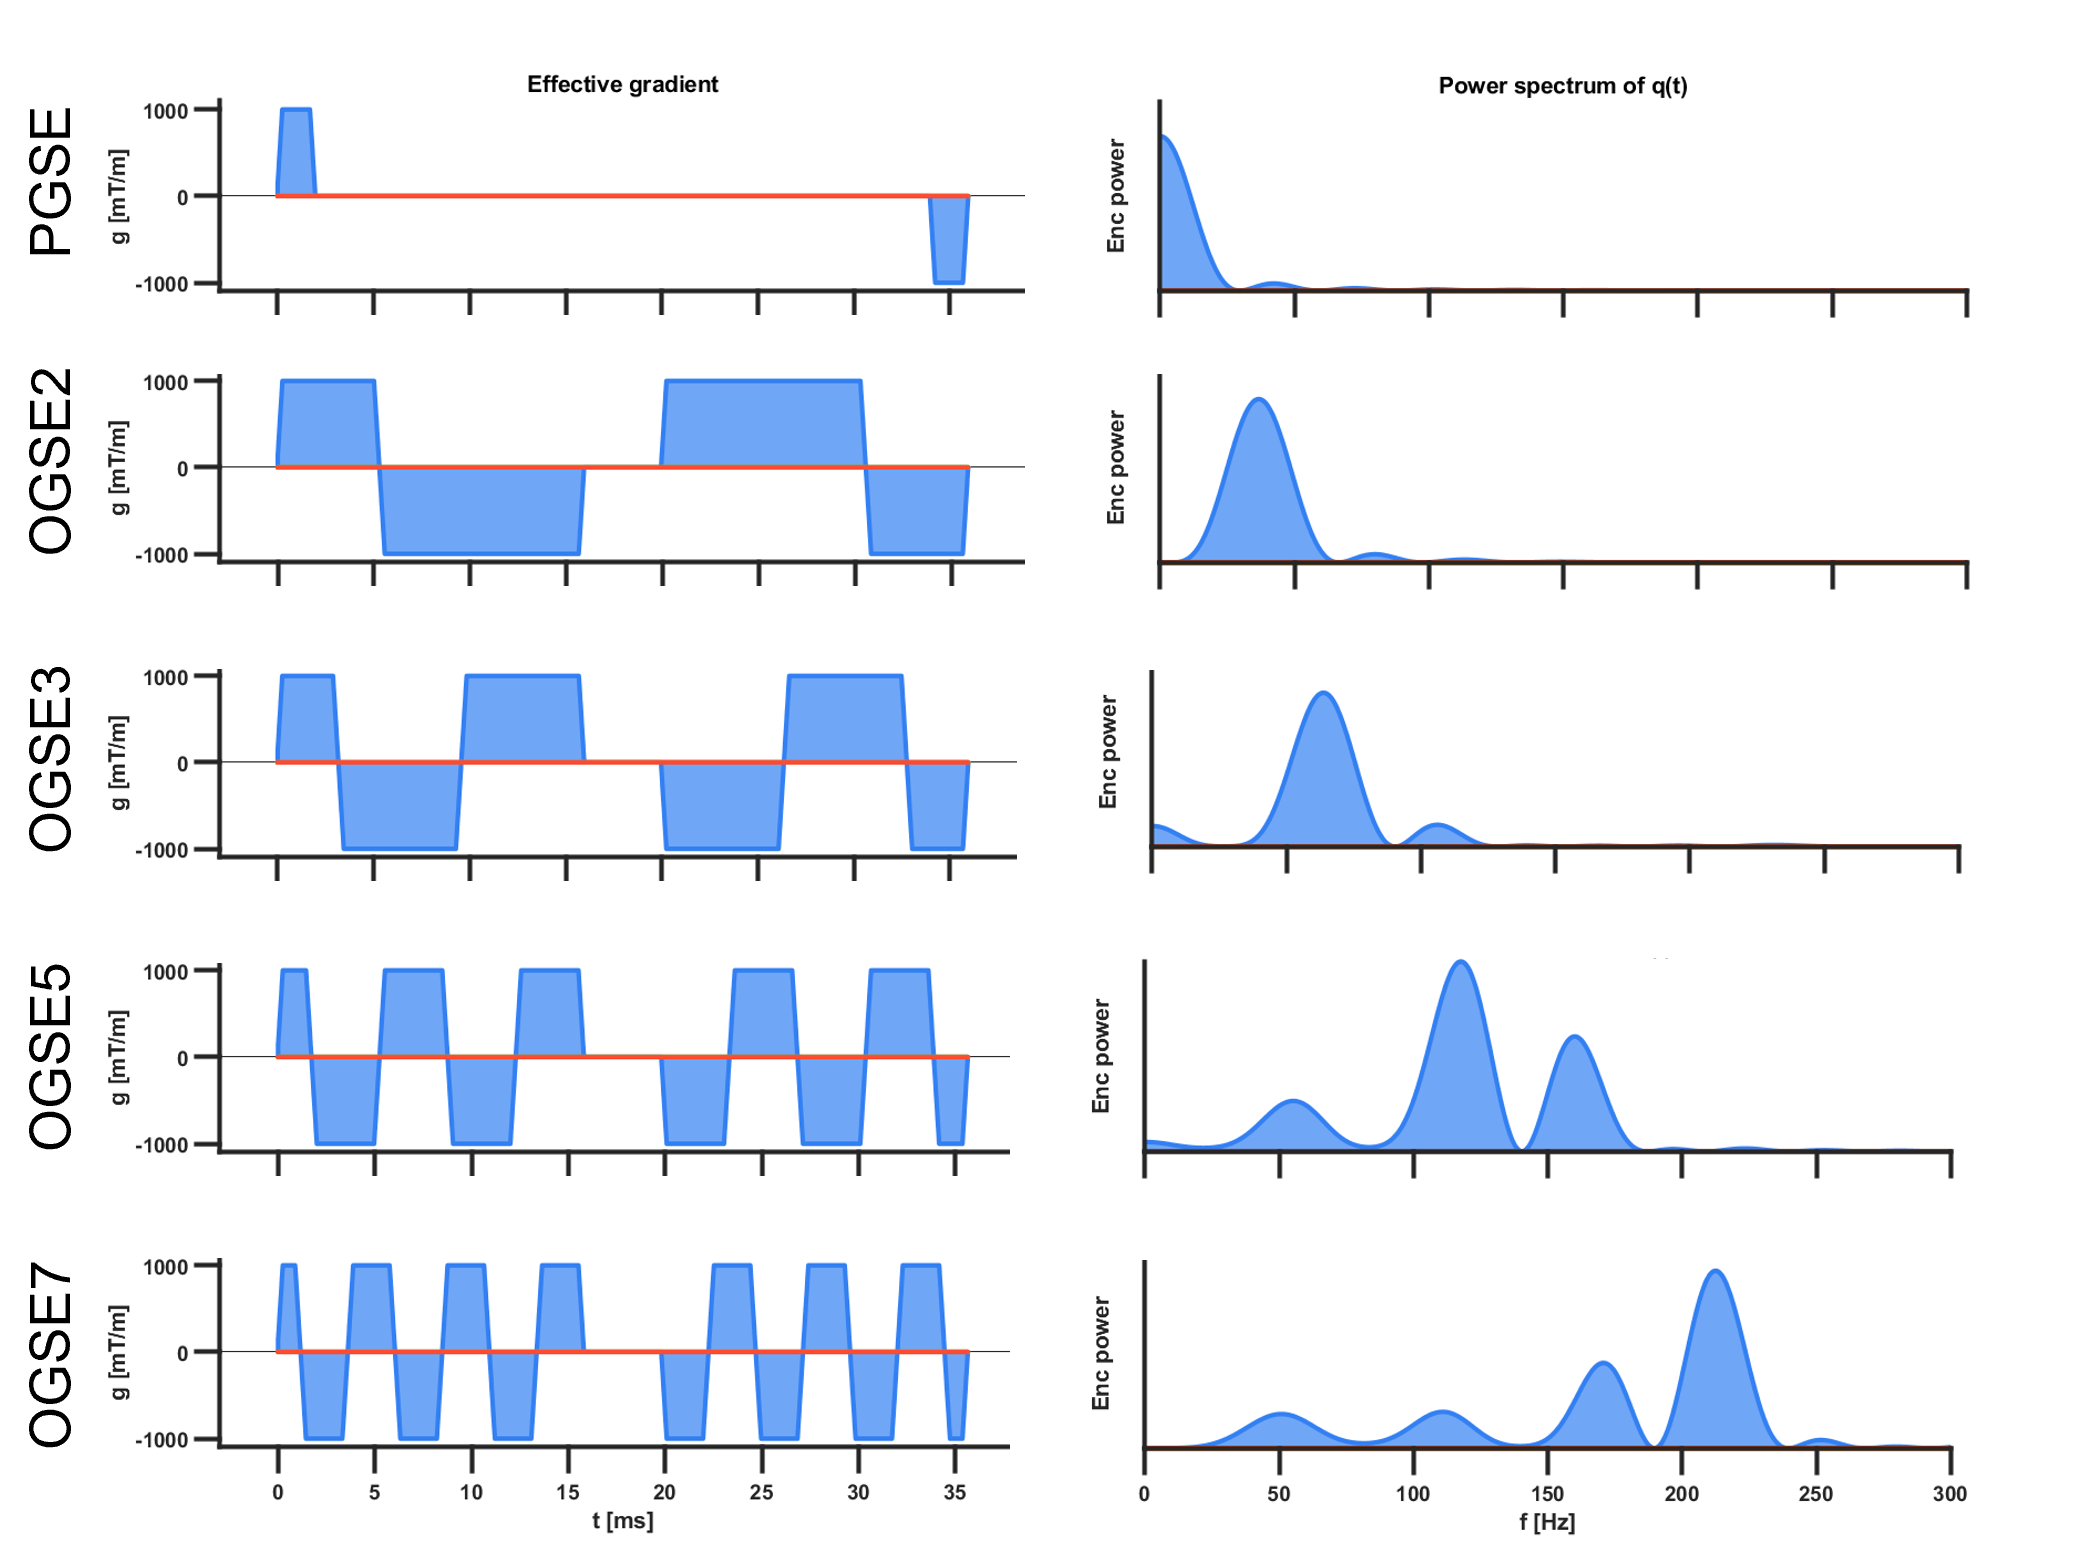
Hearts were excised from C57BL/6 mice, following terminal anesthesia and perfusion fixation in paraformaldehyde (PFA). These were subsequently immersion fixed in PFA and embedded in $$$\mathrm{1\%}$$$ agarose PBS gel for imaging. Mice were divided into two groups: control (N = 3) and transverse aortic constriction (TAC; N = 8). In TAC group, mice underwent lateral thoracotomy. Aortic stenosis was induced using a ligature on the transverse aorta. All animal use was in accordance with UK Home Office authorisation. Data were acquired on a Biospec 7T MRI scanner (Bruker BioSpin MRI GmbH, Ettlingen, Germany) with a 1.5 T/m gradient system and 20 mm diameter transmit-receive volume coil. 3D multi-shot EPI were acquired with TR = 2000 ms, TE = 45 ms, FOV = 10.5 × 10.5 × 12.0 mm, resolution = 219 × 219 × 300 $$$\mathrm{\mu m}$$$, diffusion encoding directions = 3 (b = 0.1 $$$\mathrm{ms/\mu m^2}$$$) and 21 (b = 1.0 $$$\mathrm{ms/\mu m^2}$$$). Six diffusion encoding waveforms were implemented including pulsed gradient spin echo (PGSE) and oscillating gradient spin echo (OGSE) with varying number of lobes (Figure 1)14, and characterised by the mean frequency15 of the power spectrum of the dephasing vector $$$\mathrm{\textbf{q}(t)}$$$. Data were denoised and Gibbs ringing removed in MRtrix16, and DTI parameters MD, FA, and principal eigenvectors $$$\mathrm{\lambda_1, \, \lambda_2}$$$ and $$$\mathrm{\lambda_3}$$$ estimated using non-linear least squares fitting in Matlab. Data were reported across the left ventricular myocardium in a single mid-ventricular short-axis slice. Two-sample t-tests were applied to assess group-wise differences in DTI and OGSE parameters.Results
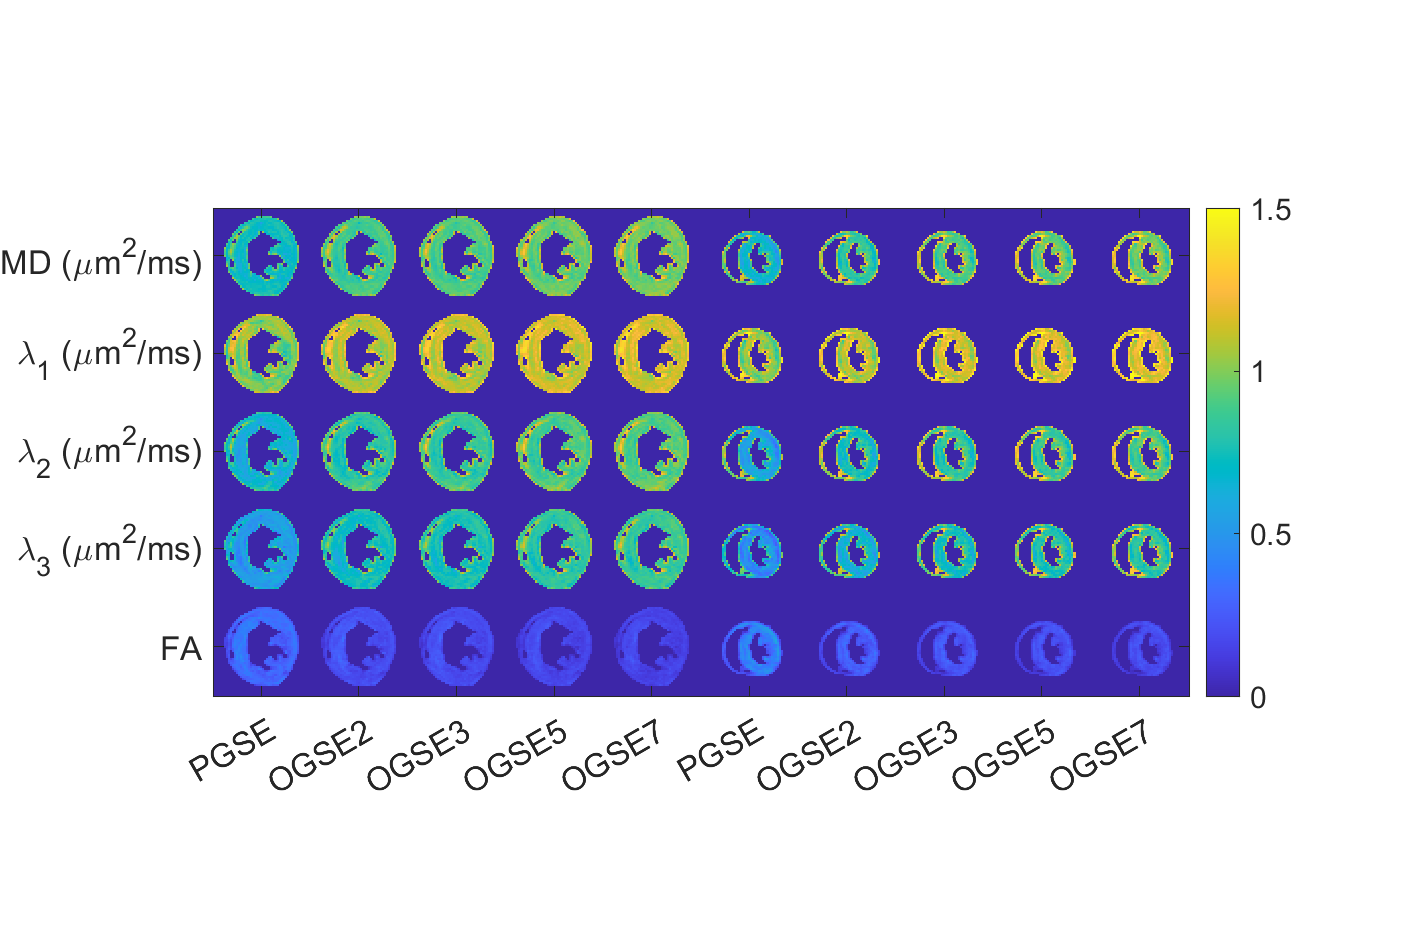
Figure 1 shows effective gradient waveforms (left column) and the corresponding power spectrum of $$$\mathrm{\textbf{q}(t)}$$$ (right column) for PGSE, OGSE2, OGSE3, OGSE5, and OGSE7 waveforms. The mean frequencies ranged from 5 Hz (PGSE) to 173 Hz (OGSE7) as shown in the power spectrum plots (right column).Figure 2 illustrates DTI parameter maps in one representative TAC (left) and control heart (right), acquired using different waveforms.
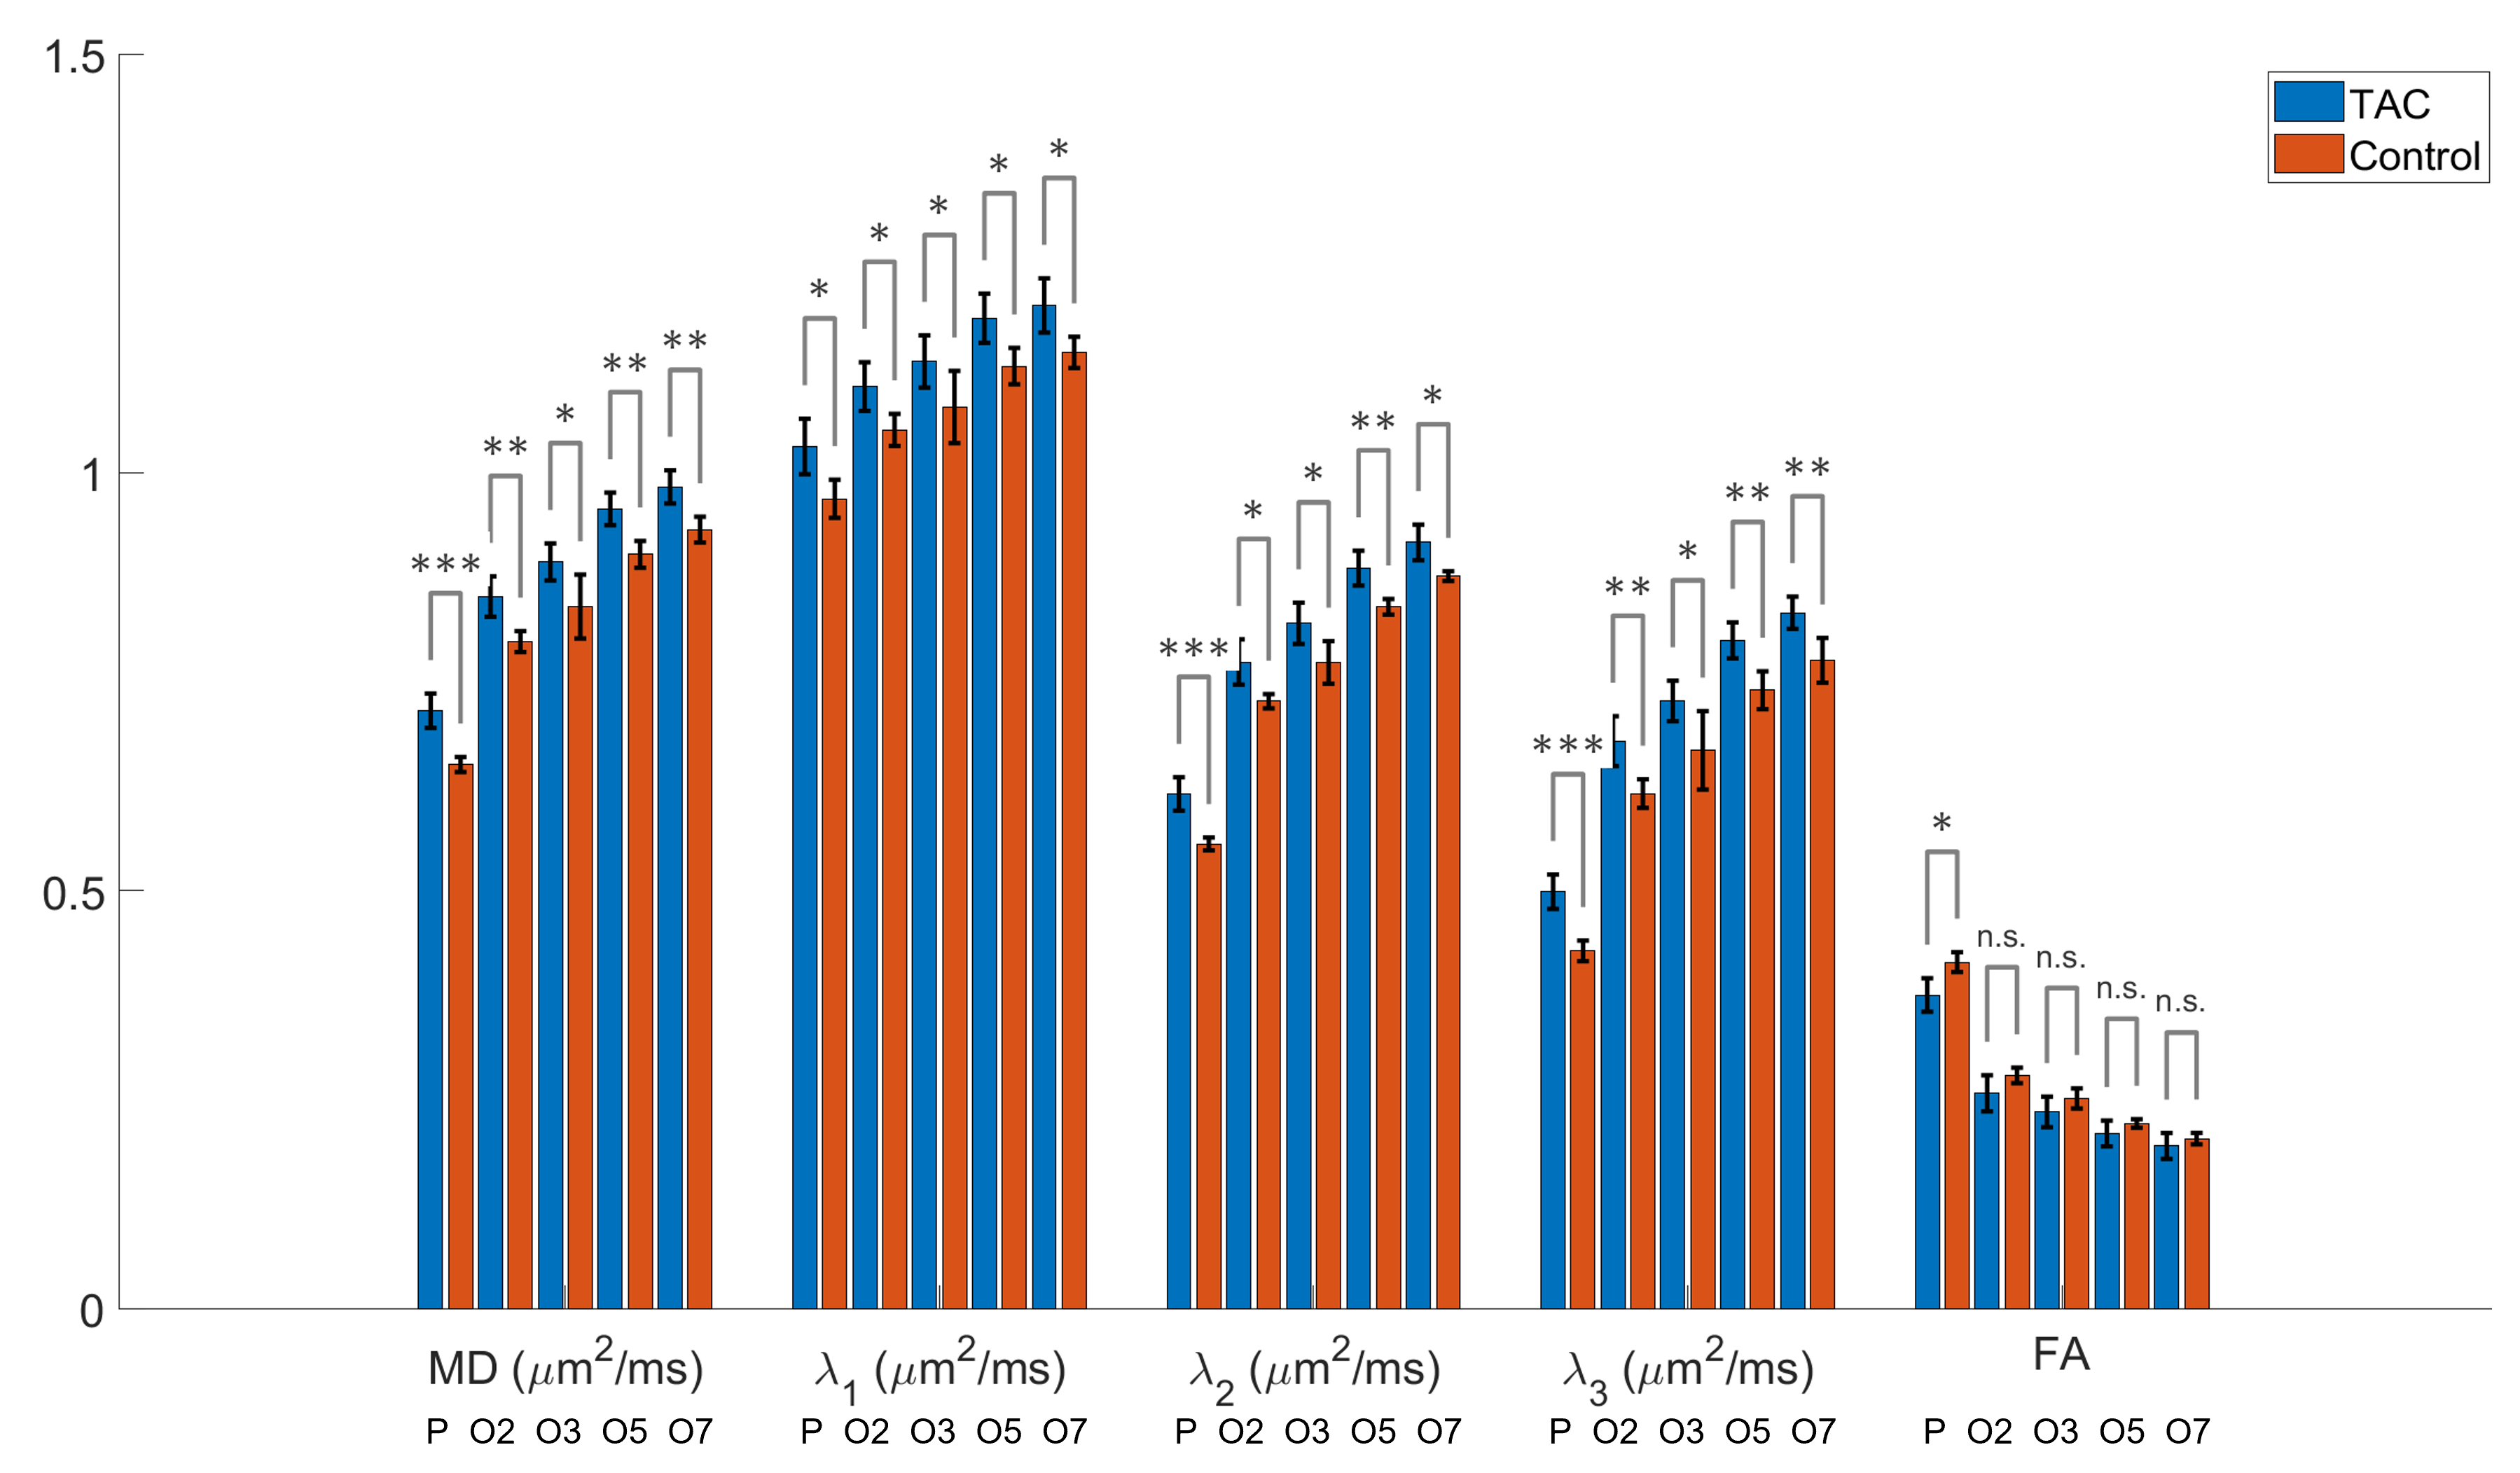
Figure 3 shows DTI parameters across a single mid-ventricular short-axis slice in TAC (blue) and control (red) hearts (mean $$$\mathrm{\pm}$$$ SD over samples) acquired with PGSE, OGSE2, OGSE3, OGSE5 and OGSE7 waveforms. Significant group differences ($$$\mathrm{p < 0.05}$$$) were observed in all instances of MD, FA, $$$\mathrm{\lambda_1, \, \lambda_2}$$$ and $$$\mathrm{\lambda_3}$$$, except for FA using OGSE.
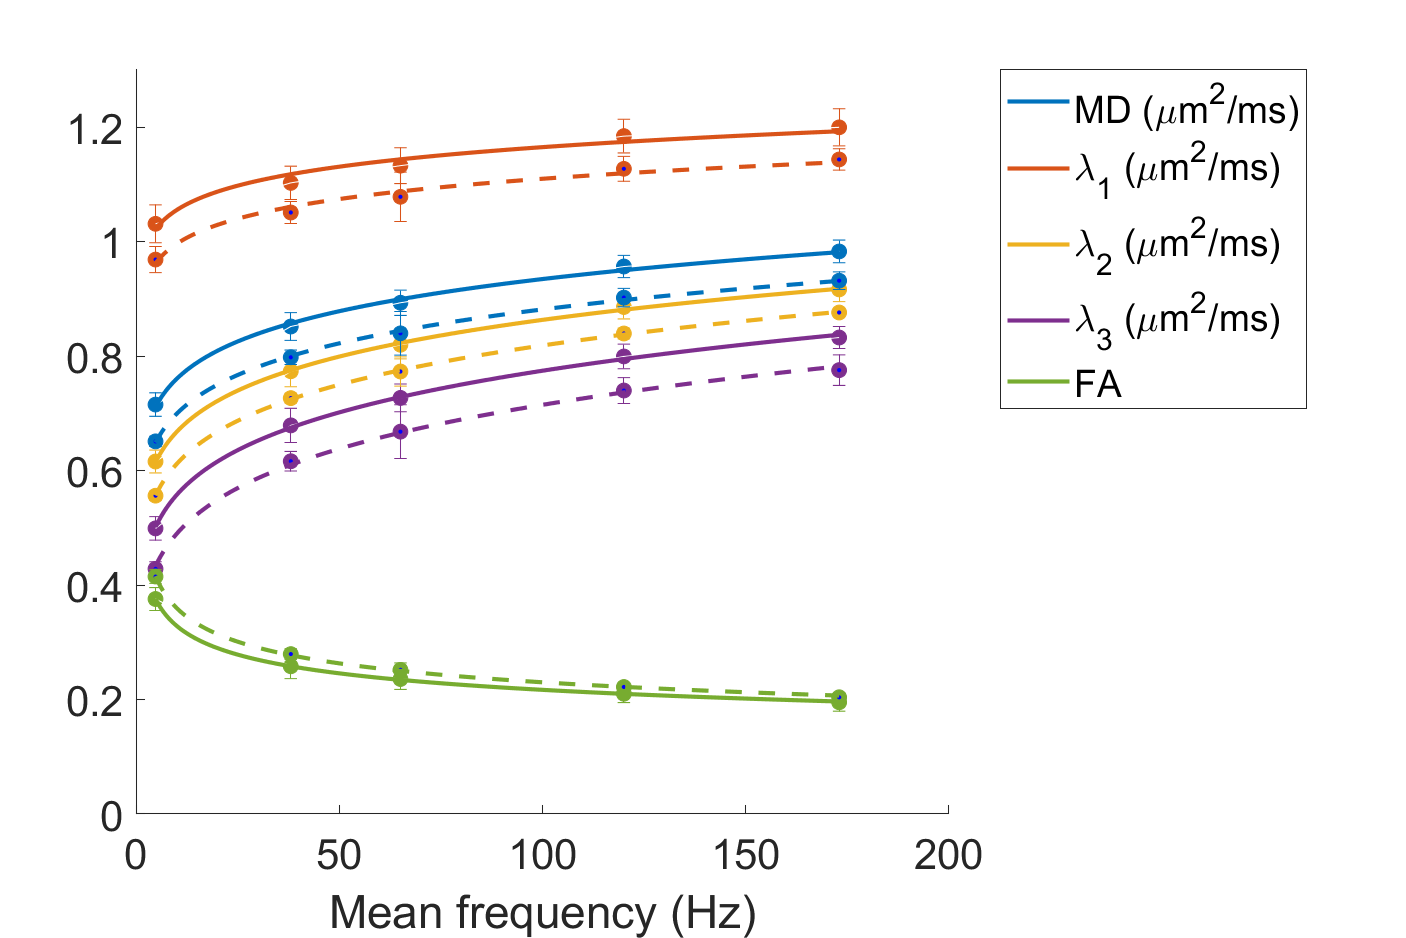
Figure 4 illustrates DTI parameters in a single mid-ventricular short-axis slice, plotted as a function of mean frequency of $$$\mathrm{\textbf{q}(t)}$$$, in TAC and control hearts.
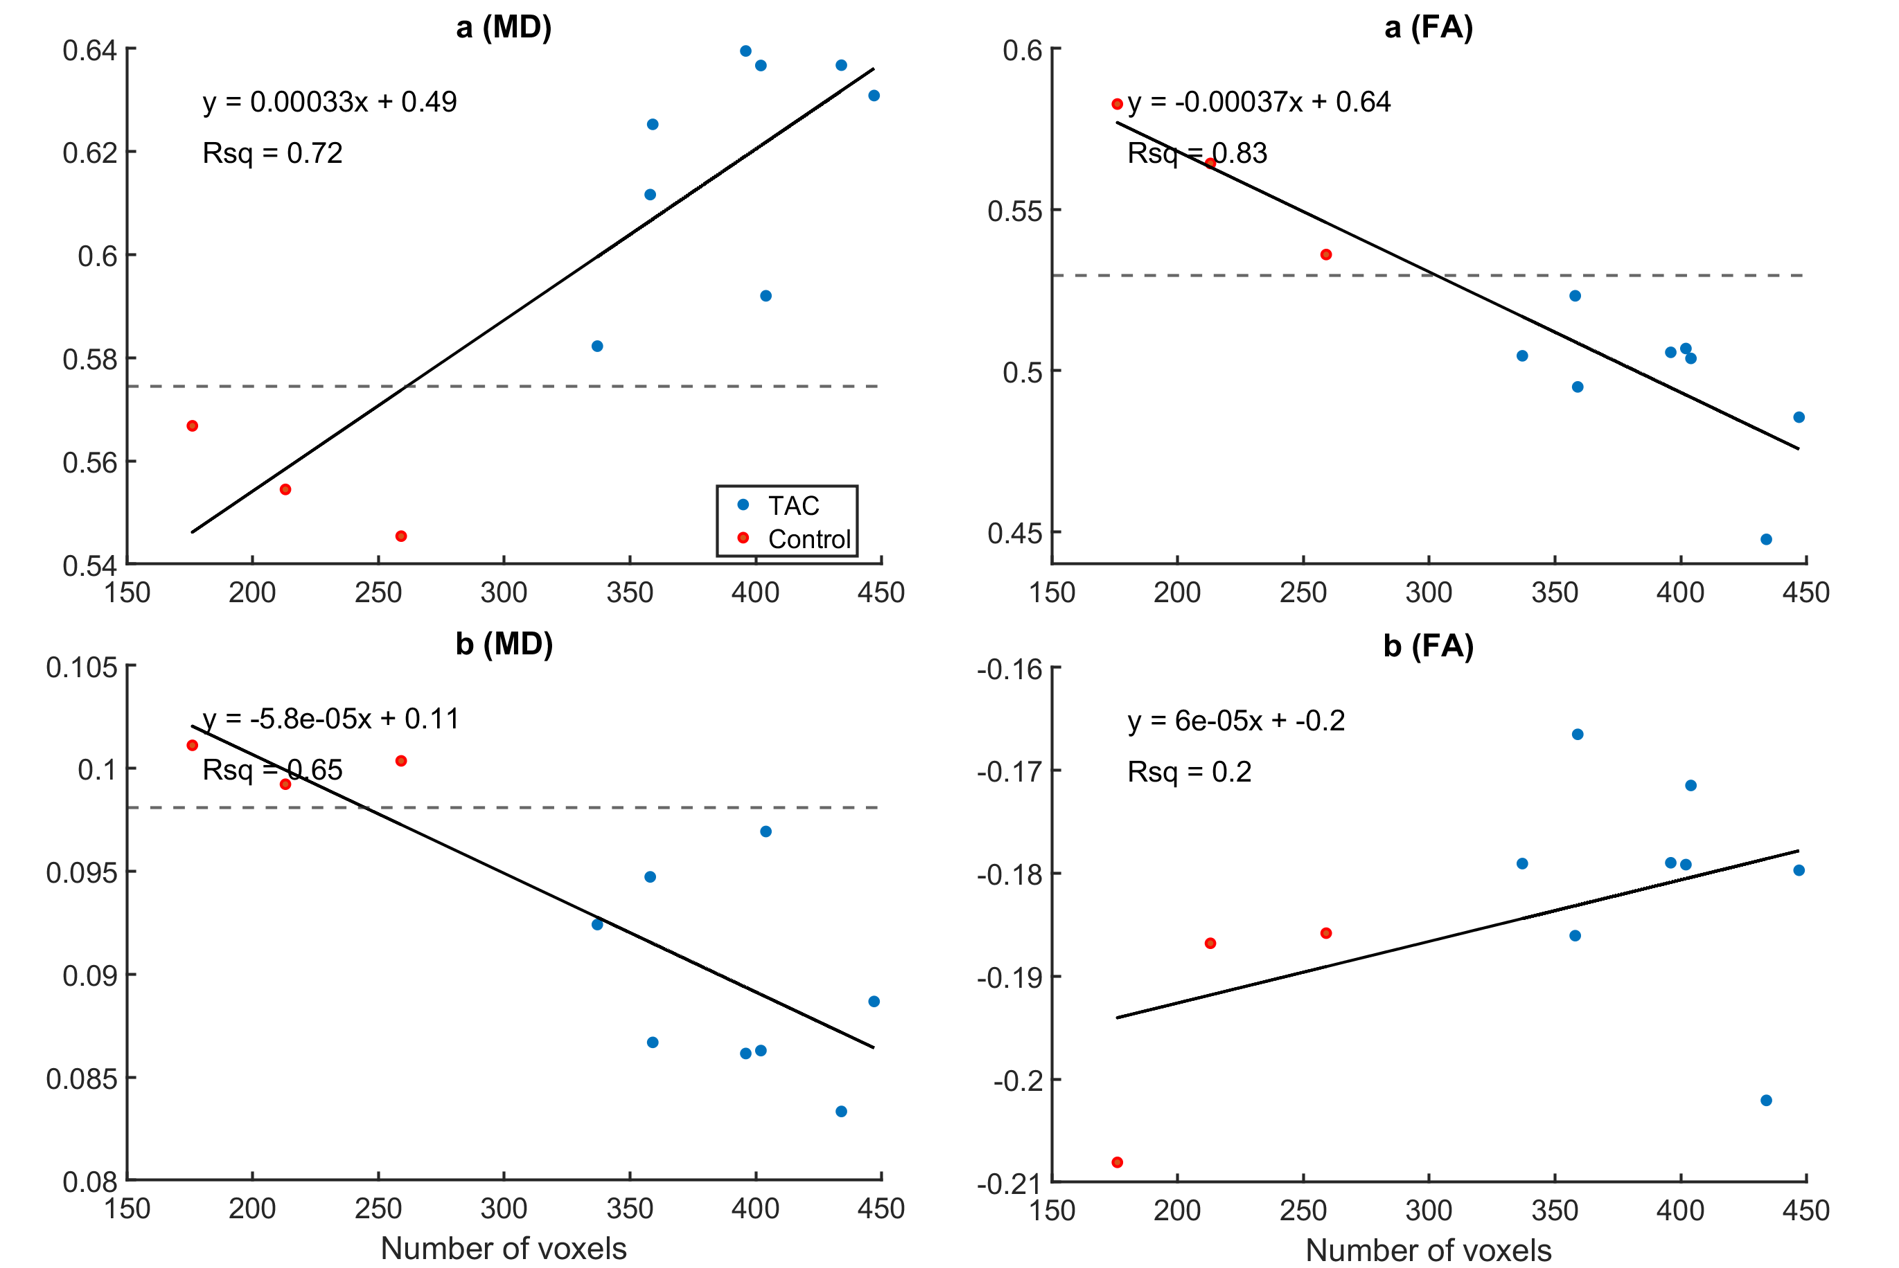
Figure 5 shows the linear regression of coefficients of a power series fit, $$$\mathrm{f(x) = ax^b}$$$ against the number of voxels in the whole LV mask in a single mid-myocardial short-axis slice. Black dashed lines indicate a possible threshold for separating TAC and control hearts. Significant group differences ($$$\mathrm{p < 0.05}$$$) were observed in a (MD, FA, $$$\mathrm{\lambda_1, \, \lambda_2}$$$ and $$$\mathrm{\lambda_3}$$$) and b (MD, $$$\mathrm{\lambda_2}$$$ and $$$\mathrm{\lambda_3}$$$).
Discussion and Conclusion
OGSE has better sensitivity than PGSE to diffusion at short-length scales, and can be used to assess the sizes of cellular and subcellular structures17. In this work, we performed the OGSE investigation of the time dependence of diffusion in the hypertrophic versus control ex vivo mouse heart. OGSE can facilitate early detection of intracellular diffusion changes that precede changes in cell density18, and could potentially provide early biomarkers in cardiac pathologies such as hypertrophy.Acknowledgements
We thank A/Prof Matthew Budde for the custom waveform pulse sequence used. This work was supported by the British Heart Foundation, UK (PG/19/1/34076, CH/16/2/32089, SI/14/1/30718) and the Wellcome Trust (219536/Z/19/Z).References
1. Nielles-Vallespin S, Khalique Z, Ferreira PF, de Silva R, Scott AD, Kilner P,et al. Assessment of myocardial microstructural dynamics by in vivo diffusion tensor cardiac magnetic resonance. Journal of the American College of Cardiology.2017;69(6):661-76.
2. Gotschy A, von Deuster C, van Gorkum RJ, Gastl M, Vintschger E, Schwotzer R,et al. Characterizing cardiac involvement in amyloidosis using cardiovascular magnetic resonance diffusion tensor imaging. Journal of Cardiovascular Magnetic Resonance. 2019;21(1):1-9.
3. Das A, Kelly C, Teh I, Stoeck CT, Kozerke S, Chowdhary A, et al. Acute microstructural changes after ST-segment elevation myocardial infarction assessed with diffusion tensor imaging. Radiology. 2021;299(1):86-96.
4. Das A, Chowdhary A, Kelly C, Teh I, Stoeck CT, Kozerke S, et al. Insight into myocardial microstructure of athletes and hypertrophic cardiomyopathy patients using diffusion tensor imaging. Journal of Magnetic Resonance Imaging. 2021;53(1):73-82.
5. Ariga R, Tunnicliffe EM, Manohar SG, Mahmod M, Raman B, Piechnik SK, et al.Identification of myocardial disarray in patients with hypertrophic cardiomyopathy and ventricular arrhythmias. Journal of the American College of Cardiology.2019;73(20):2493-502.
6. Das A, Kelly C, Teh I, Nguyen C, Brown LA, Chowdhary A, et al. Phenotyping hypertrophic cardiomyopathy using cardiac diffusion magnetic resonance imaging: relationship between microvascular dysfunction and microstructural changes. Euro-pean Heart Journal-Cardiovascular Imaging. 2022;23(3):352-62.
7. Lasič S, Szczepankiewicz F, Dall’Armellina E, Das A, Kelly C, Plein S, et al.Motion-compensated b-tensor encoding for in vivo cardiac diffusion-weighted imaging. NMR in Biomedicine. 2020;33(2):e4213.
8. Kim S, Chi-Fishman G, Barnett AS, Pierpaoli C. Dependence on diffusion time of apparent diffusion tensor of ex vivo calf tongue and heart. Magnetic resonance inmedicine. 2005;54(6):1387-96.
9. Froeling M, Mazzoli V, Nederveen AJ, Luijten PR, Strijkers GJ. Ex vivo cardiacDTI: on the effects of diffusion time and b-value. Journal of cardiovascular magnetic resonance. 2014;16(1):1-2.
10. Teh I, Schneider JE, Whittington HJ, Dyrby TB, Lundell H. Temporal diffusion spectroscopy in the heart with oscillating gradients. In: Proc Intl Soc Mag ResonMed. vol. 3114; 2017.
11. Lasič S, Yuldasheva N, Szczepankiewicz F, Nilsson M, Budde M, Dall’Armellina E,et al. Stay on the beat with tensor-valued encoding: time-dependent diffusion and cell size estimation in ex vivo heart. Frontiers in Physics. 2022;10:167.
12. Teh I, Coveney S, Foster RJ, Szczepankiewicz F, Lasic S, Lundell H, et al. Time-dependent Diffusion in the Human Heart In Vivo. In: Proc Intl Soc Mag Reson Med;2023.
13. Michael ES, Dick CA, Hennel F, Stoeck CT, Pruessmann KP. Diffusion dispersion mapping of ischemic lesions in the ex vivo porcine heart. In: Proc Intl Soc MagReson Med; 2023.
14. Hennel F, Michael ES, Pruessmann KP. Improved gradient waveforms for oscillating gradient spin-echo (OGSE) diffusion tensor imaging. NMR in Biomedicine.2021;34(2):e4434.
15. Phinyomark A, Thongpanja S, Hu H, Phukpattaranont P, Limsakul C. The usefulness of mean and median frequencies in electromyography analysis. Computational intelligence in electromyography analysis-A perspective on current applications and future challenges. 2012;23:195-220.
16. Tournier JD, Smith R, Raffelt D, Tabbara R, Dhollander T, Pietsch M, et al. MR-trix3: A fast, flexible and open software framework for medical image processing and visualisation. Neuroimage. 2019;202:116137.
17. Drobnjak I, Zhang H, Ianus ̧ A, Kaden E, Alexander DC. PGSE, OGSE, and sensitivity to axon diameter in diffusion MRI: Insight from a simulation study. Magnetic resonance in medicine. 2016;75(2):688-700.
18. Colvin DC, Loveless ME, Does MD, Yue Z, Yankeelov TE, Gore JC. Earlier detection of tumor treatment response using magnetic resonance diffusion imaging with oscillating gradients. Magnetic resonance imaging. 2011;29(3):315-23.
Figures