1384
Cardiac QSM for the Detection of Intra-Myocardial Haemorrhage: an Initial Experience1Biomedical Engineering and Imaging Science, King's College London, London, United Kingdom
Synopsis
Keywords: Myocardium, Susceptibility
Motivation: T2*-contrast is not-specific to iron in the heart, with edema having a competing and contradictory effect to iron. Quantitative susceptibility mapping (QSM) may improve identification of intra-myocardial haemorrhage (IMH), through greater specificity to iron.
Goal(s): To present our initial experience of using QSM for the assessment of IMH.
Approach: 10 patients were scanned with QSM, 5 without myocardial infarcts to perform AHA-segmental analysis and 5 with scar to demonstrate the identification of IMH with QSM.
Results: The mean AHA-segment susceptibility was 0.00±0.02ppm and precision 0.05±0.03ppm in the non-infarct-group. Four of the patients with scar had IMH, which was successfully identified with QSM.
Impact: Cardiac quantitative susceptibility mapping successfully visualized intra-myocardial haemorrhage in four patients, and found no haemorrhage in one further patient, in agreement with the gold standard T2/T2* techniques.
Background
The current gold standard technique for assessing the level of iron in the heart is T2* weighted imaging or T2* mapping [1]. Although these techniques are currently used for detecting the presence of intra-myocardial haemorrhage (IMH), T2*-contrast is not specific to iron, with edema having a competing and contradictory effect to iron, meaning that iron co-located with edema can be missed[2].Quantitative susceptibility mapping (QSM) measures the magnetic susceptibility of tissue. A species’ magnetic susceptibility is dependent on its atomic/molecular electronic structure, particularly the number of un-paired electrons it possesses, giving iron a high susceptibility compared to cardiac tissue[3]. This makes QSM an ideal, highly specific, contrast mechanism for the identification of iron, particularly in patients with STEMI where it can mitigate the confounding effect of edema and fibrosis, compared to conventional imaging, thereby offering potentially improved specificity and accuracy[2].
In this work we present scans of 10 patients, 5 of which exhibiting myocardial infarction to illustrate the efficacy of the technique.
Methods
10 volunteer patients were scanned with QSM in addition to their clinically necessary scan. Of these 5 had myocardial scar following an infarction. All patients were scanned with late-gadolinium-enhanced (LGE) imaging after the QSM sequence and T1/T2/T2* mapping where clinically indicated.All MRI acquisitions were performed at 1.5T (MAGNETOM Aera/Sola, Siemens Healthineers, Erlangen, Germany) with subjects in the supine position. The QSM acquisition consisted of a multi-echo-3D-GRE research sequence. The acquisition parameters were 5-echoes, TE1=3.2ms, ∆TE=2.9ms, field of view (FOV)=288x384x100mm3 (anterior-posterior x left-right x head-foot, PE direction: anterior-posterior), voxel size=1.5x1.5x5 mm3 , flip-angle=15° , bandwidth=543Hz/Px, segments=10, GRAPPA factor=2, partial Fourier=75 %. The shim-box was set to tightly bound the heart.
QSM maps were reconstructed using the MEDI toolbox (version 01/15/2020)[4] in MATLAB (version R2019b, MathWorks, Natick MA). An overview is shown in Figure 1. Cardiac maps were reconstructed with a region of interest corresponding to the left-ventricle only, to reduce susceptibility artefacts in the septum. The total-field was found with a linear fit to the phase-images and processed with the SPURS algorithm (including T2*-IDEAL) to simultaneously unwrap the total field and remove the fat signal[5]. The local field shift was then extracted with the projection onto dipole fields algorithm[6]. For the MEDI reconstruction, regularization was set as λ=100 (optimal by L-curve analysis) for the non-IMH cohort, and confirmed as optimal in one IMH case. Spherical-mean-value smoothing was not used.
Results
The results of the five non-infarction patient cohort are shown in Figure 2. With λ=100 the mean segment value was 0.00±0.02 ppm and precision was 0.05±0.03 ppm. Compared to the 10 healthy volunteer cohort presented in [7], there was no significant difference in AHA segmental mean or precision (Welch’s t-test, p=0.78 and 0.69 respectively).Figure 3 shows reconstructed QSM, LGE and T2 mapping images from a patient with a significant, transmural, STEMI. The T2 maps show a large hyper-intense region of edema in the infero-lateral position, with a small hypo-intense area of IMH. The LGE images show a transmural hyper-intense scar in the infero-lateral position with a hypo-intensity, indicating disruption to the microvasculature, co-located with the IMH seen on the T2 map. At λ=100 a hyper-intense region is clearly visualized on the QSM map, with regions outside of the hyper-intense region not showing significant susceptibility artefacts. Higher λ values appear to produce greater artefact content and noise, as expected from [7] while the peak intensity of the IMH reduces with lower λ (increased regularization).
Figure 4 shows LGE, T2, T2* and QSM maps for four further patients presenting with STEMI and suspected IMH. The scars are all visualised in the LGE images, with the associated edema visualized in the T2 map. Three of the cases in Figure 4 show IMH co-localized with the hyper-intense scar regions identified with LGE and hypo-intense regions on the T2/T2* maps. In the final case, no IMH was visualized with T2/T2* or QSM, suggesting that no IMH was present.
Discussion
The susceptibility and precision of the five non-infarction patients indicates that the technique is not unduly adversely affected by the differences between patient and healthy volunteer cohorts, and provides confidence in the applicability of the technique to patient populations.The 5 patients with infarction demonstrate the agreement of QSM with conventional mapping techniques when detecting IMH. In all cases where IMH was present, QSM was in agreement with T2 and T2*.
Conclusion
Cardiac QSM shows promise for the detection of IMH in patients.Acknowledgements
Biomedical Research Centre at Guy's and St Thomas' National Health Service (NHS) Foundation Trust; British Heart Foundation (BHF), Grant/Award Numbers:(PG/19/11/34243), (PG/21/10539); Engineering and Physical Sciences Research Council (EPSRC), Grant/Award Number: (EP/R010935/1); King's College London; National Institute for Health Research (NIHR); This research was funded in whole, or in part, by the Wellcome Trust (WT 203148/Z/16/Z).References
[1] Carpenter et al. On T2* Magnetic Resonance and Cardiac Iron, Circulation. 123:1519–1528, 2011.
[2] Moon et al. Iron imaging in myocardial infarction reperfusion injury. Nat Commun 11: 3273, 2020.
[3] Wang et al. 1/T2 and Magnetic Susceptibility Measured in a Gerbil Cardiac Iron Overload Model. Radiology, 234:749-755, 2005.
[4] MEDI toolbox version 20200115 developed by Yi Wang’s group from Cornell MRI Research Lab: https://pre.weill.cornell.edu/mri/pages/qsm.html
[5] Dong et al. Simultaneous Phase Unwrapping and Removal of Chemical Shift (SPURS) Using Graph Cuts: Application in Quantitative Susceptibility Mapping. IEEE Trans Med Imag. 2015, 34(2):531-540.
[6] Liu et al. A novel background field removal method for MRI using projection onto dipole fields (PDF). NMR Biomed. 24(9):1129-36 (2011).
[7] Tyler et al. Characterization of Cardiac Quantitative Susceptibility Mapping (QSM). Proc. Intl. Soc. Magn. Reson. Med. 2023.
Figures
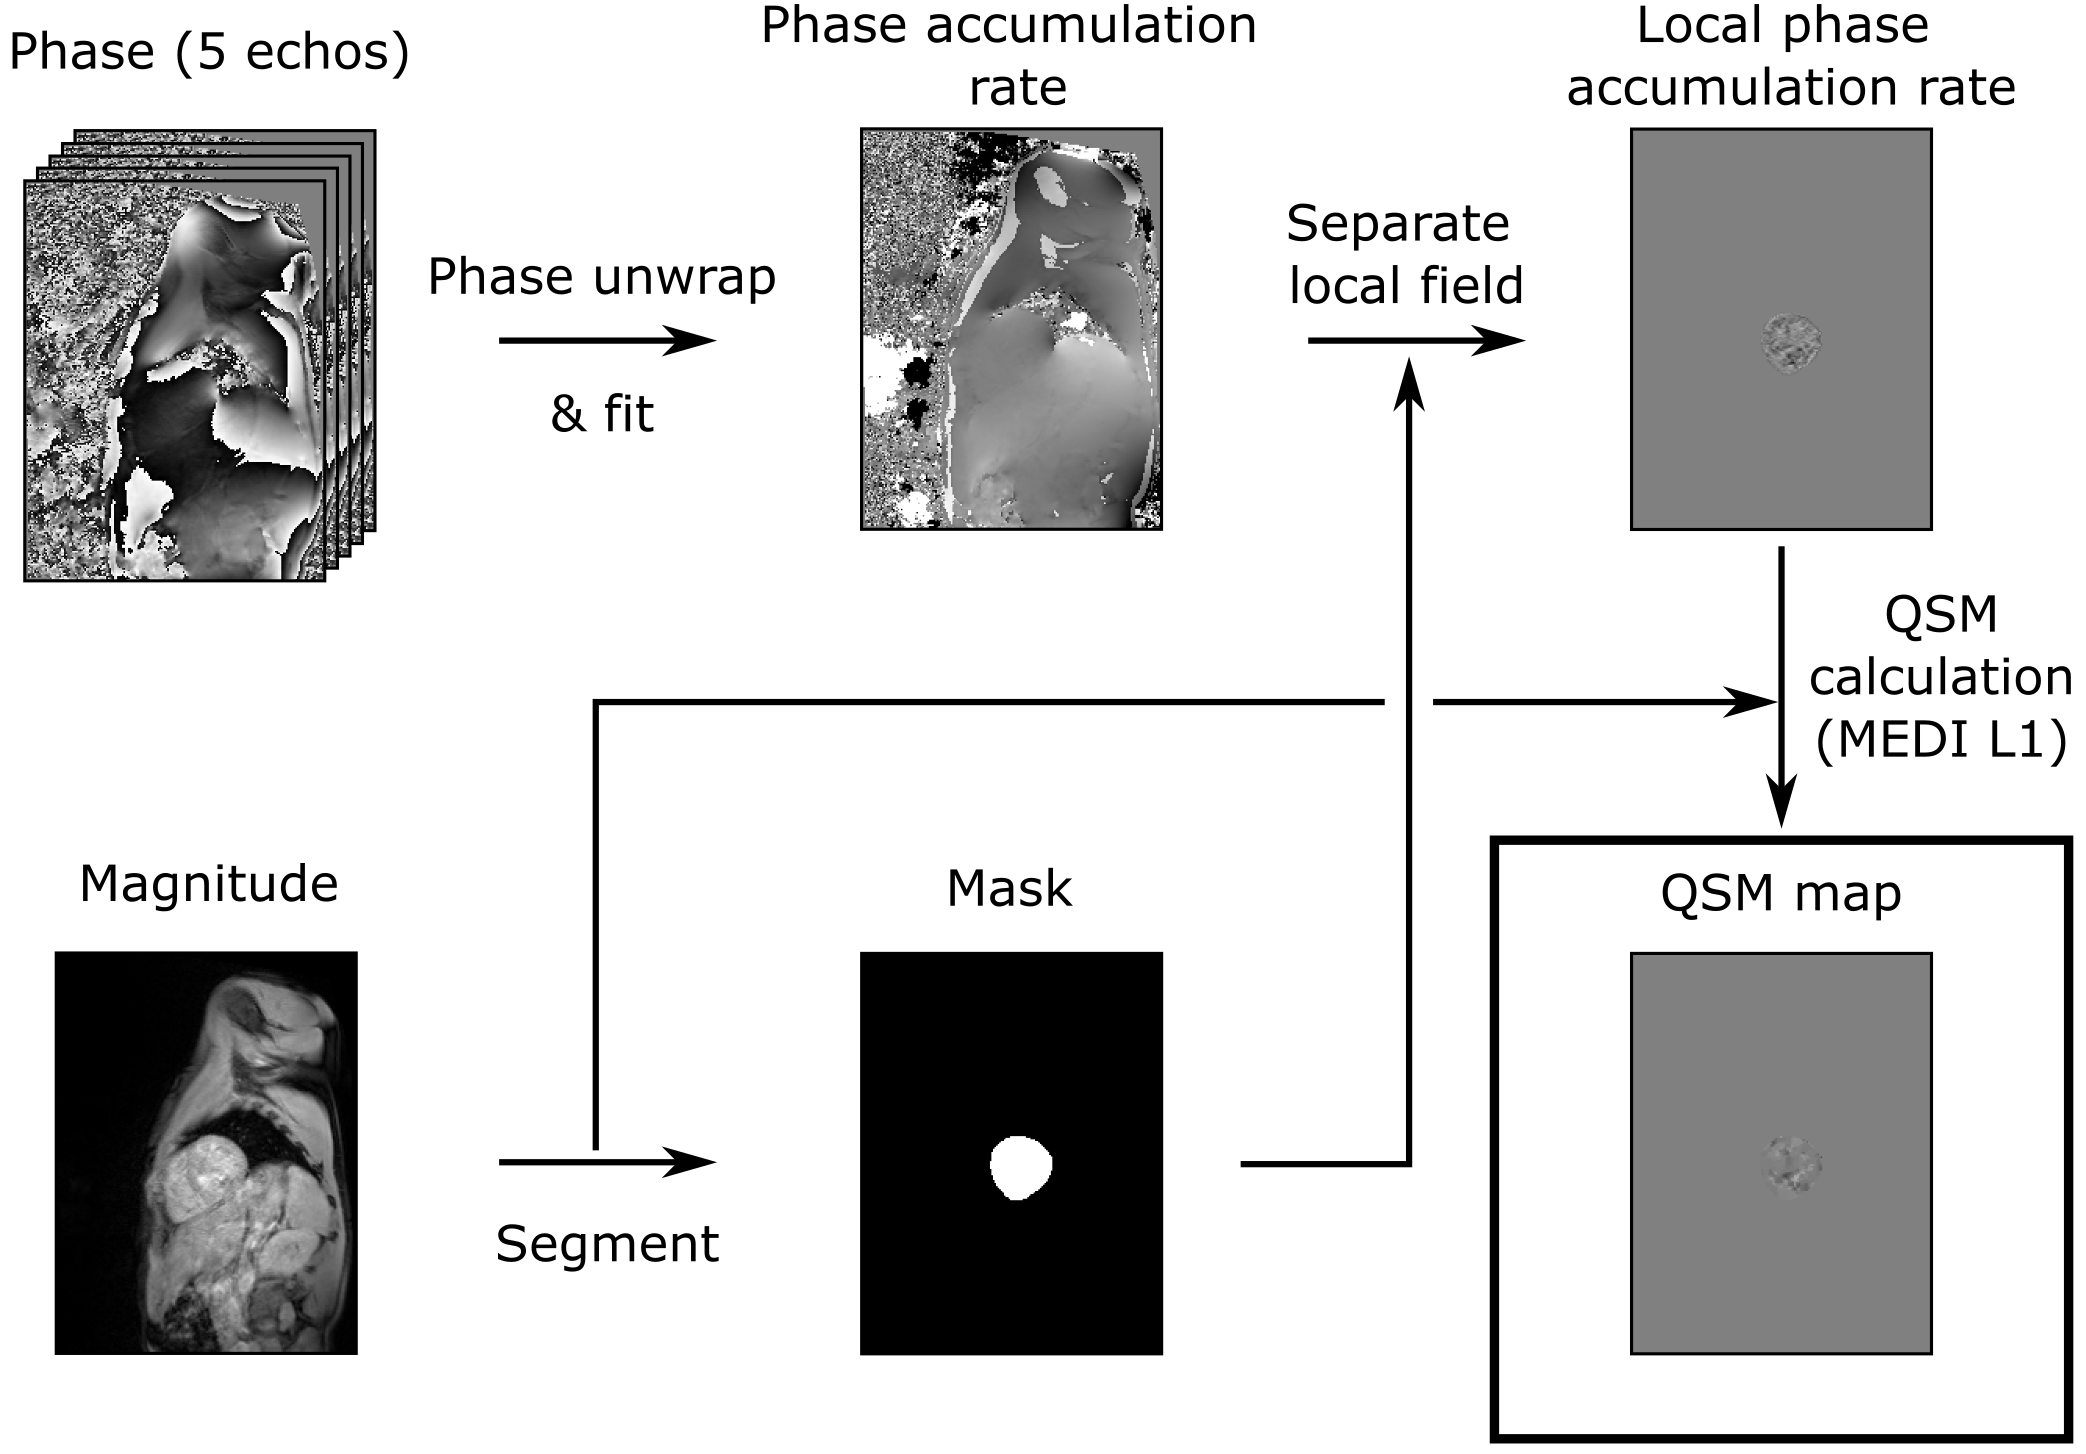
Figure 1: Illustration of the cardiac QSM. A linear fit (against echo time) is applied to the phase images to calculate a map of rate of phase accumulation. Phase wraps are removed from the total field map and fat signal removed with the SPURS algorithm. The magnitude images are segmented to produce a mask corresponding to the left ventricle, which is used to separate the local field. The QSM map is calculated from this using the MEDI L1 algorithm.
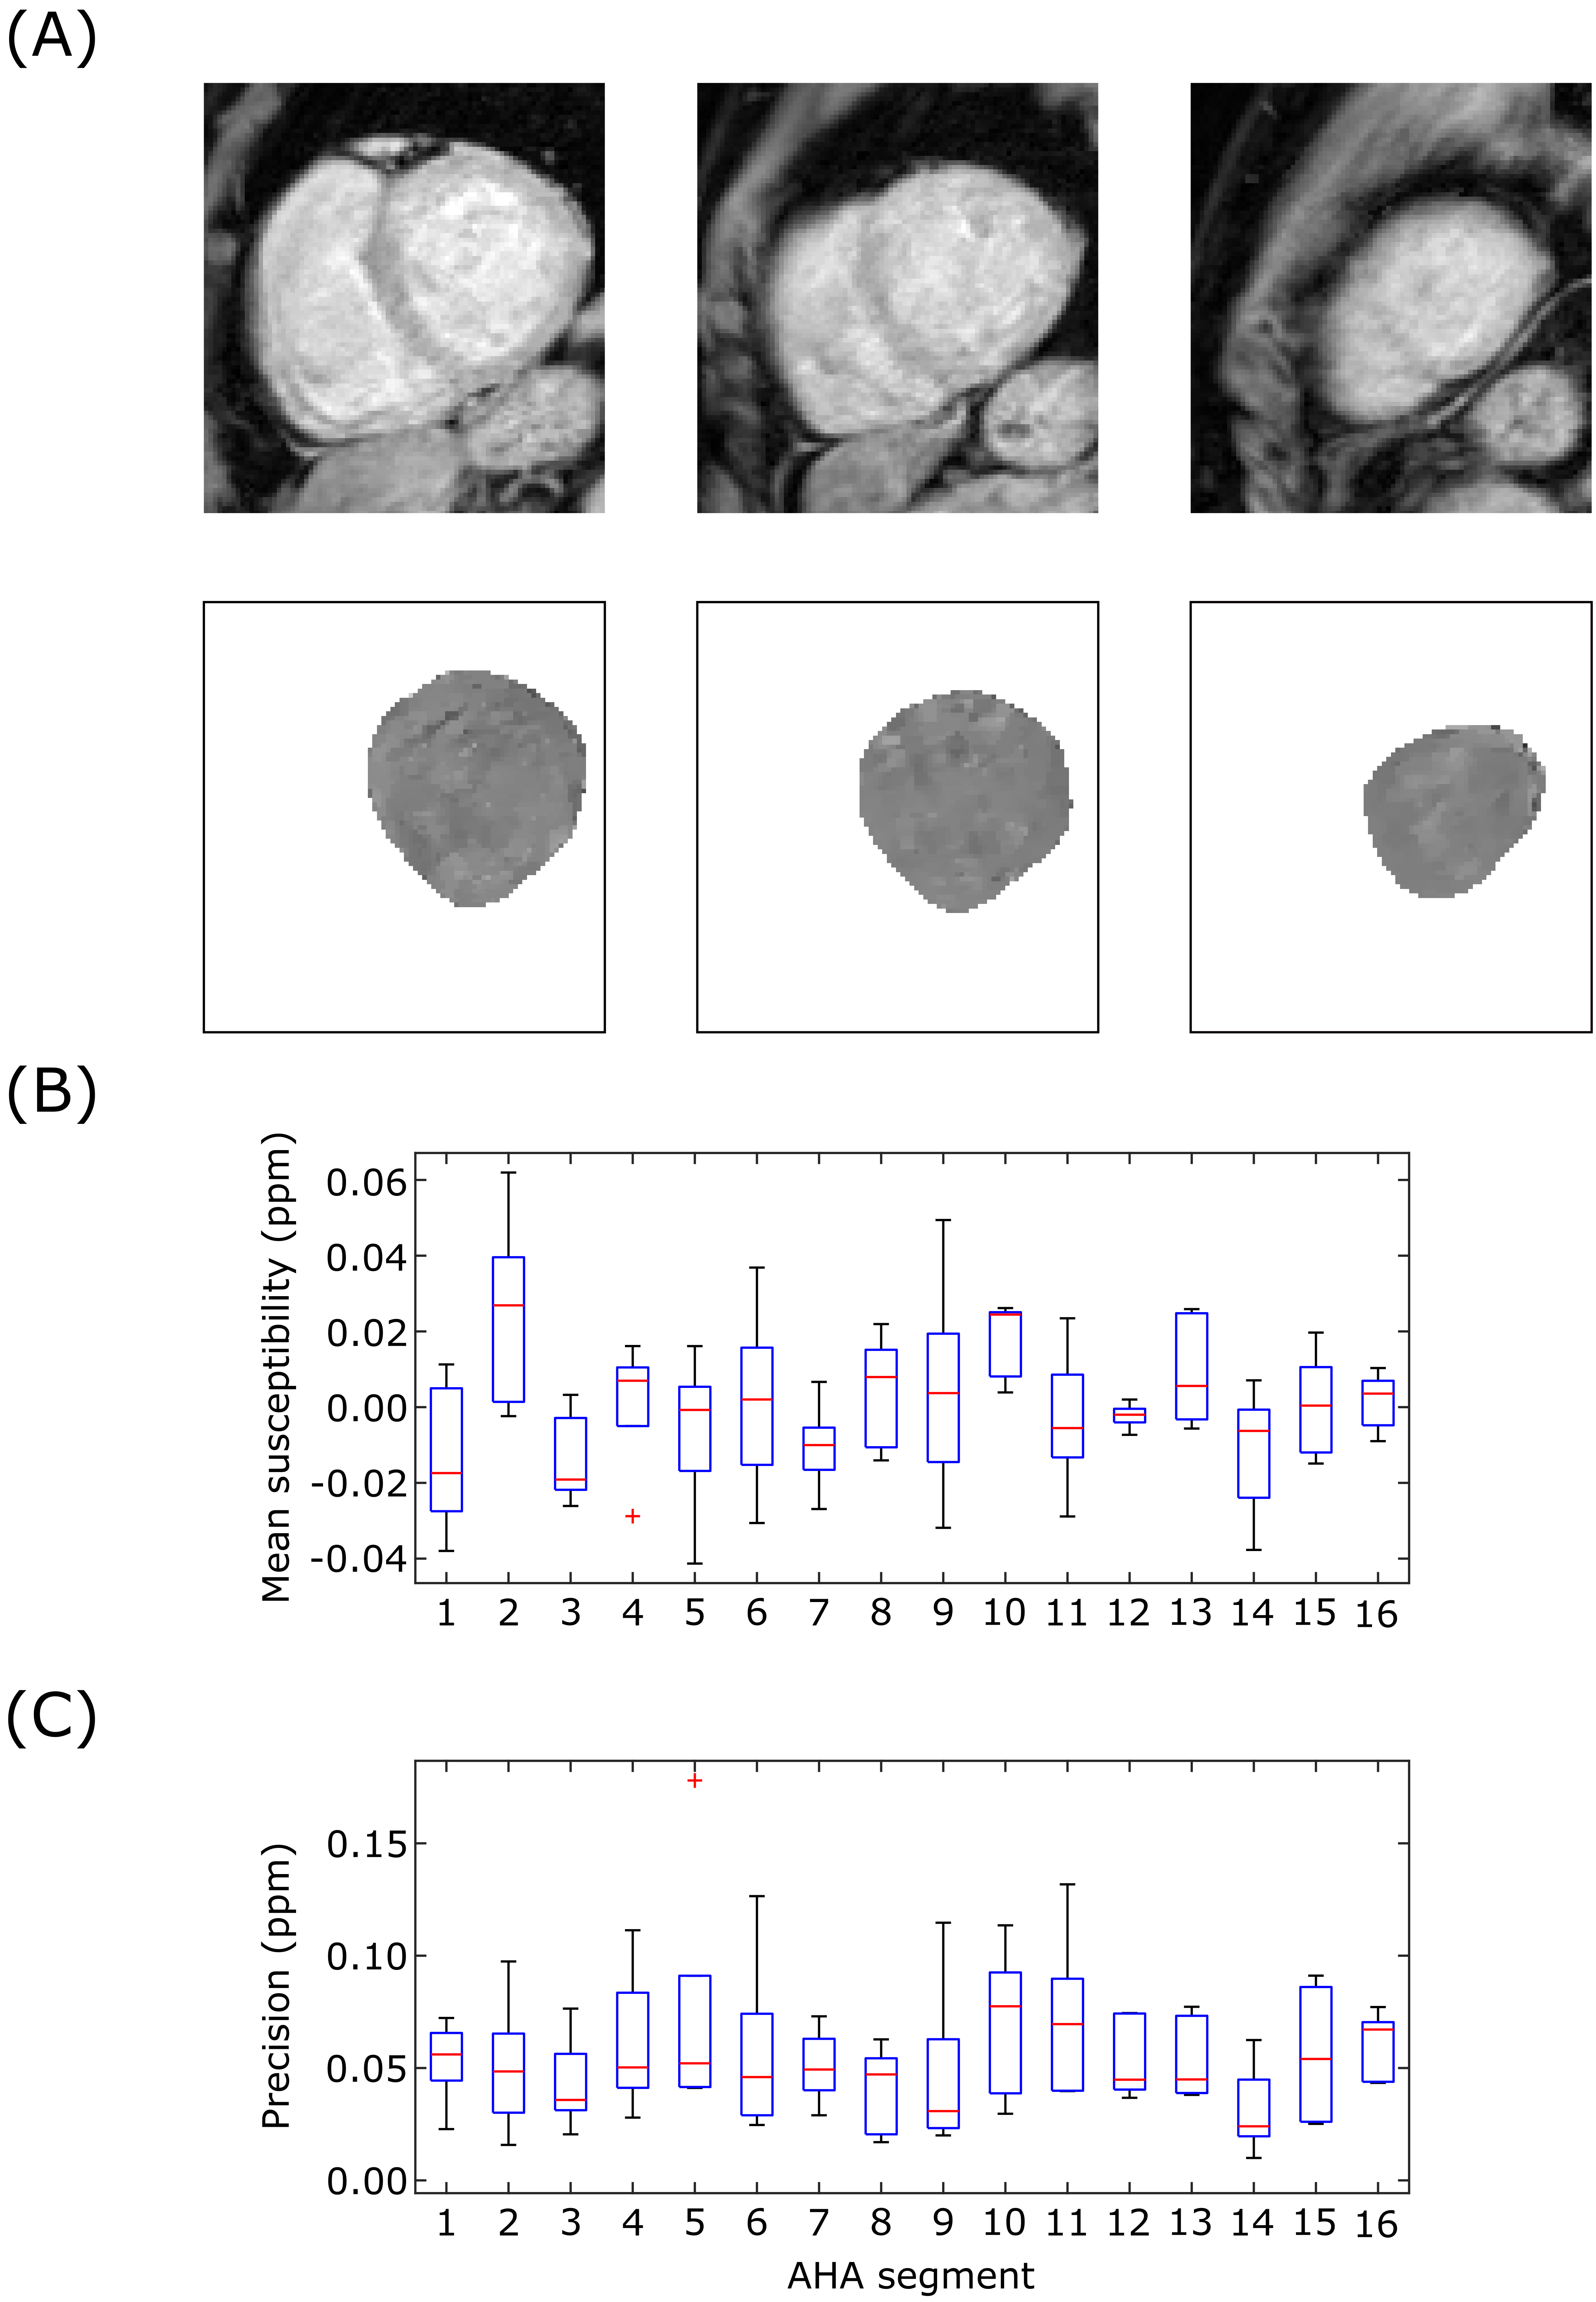
Figure 2: Characterization of cardiac QSM in patients without myocardial scar (λ = 100). (A) Example images of one patient showing basal, mid and apical slices of a cardiac QSM map. (B) AHA segment mean susceptibility. (C) Precision (spatial standard deviation) of AHA segment.
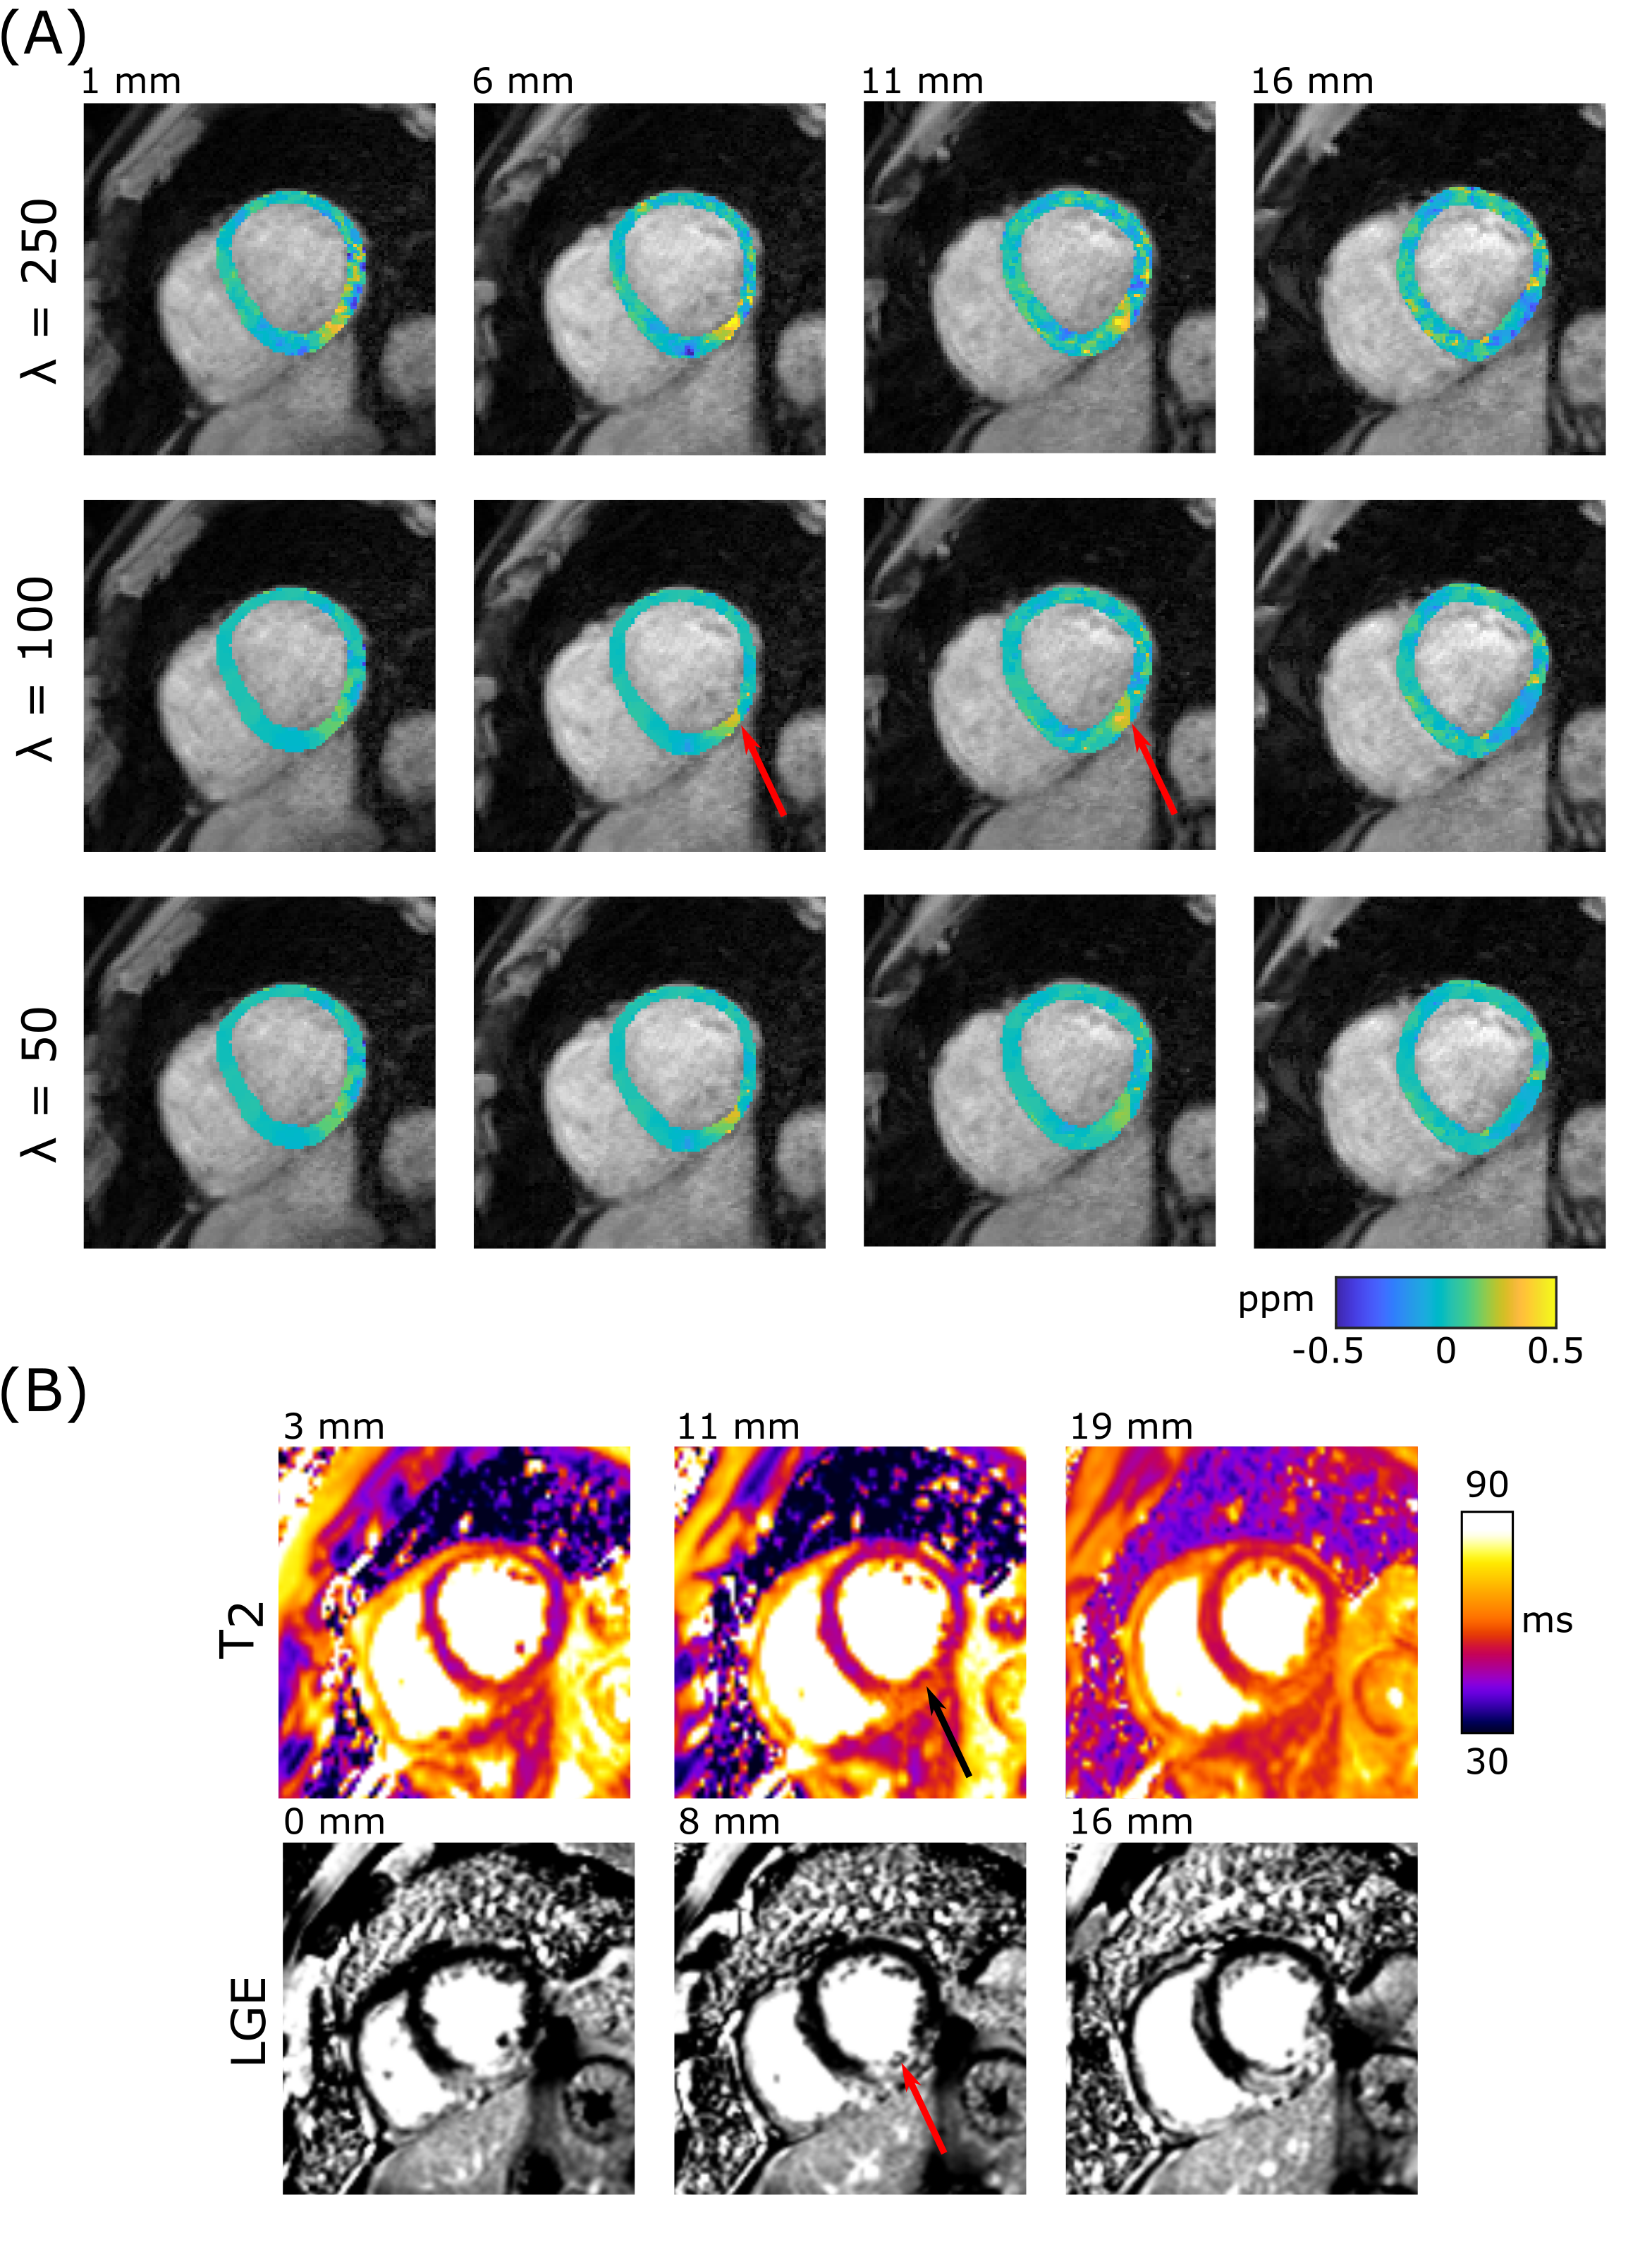
Figure 3: (A) Susceptibility maps for a patient exhibiting an IMH. There is a clear focal susceptibility elevation in the myocardium, (red arrow) which is consistent with the signal seen in the LGE images and T2 maps consistent with an IMH. Increased regularization (lower λ) reduced noise in the map, however the peak signal intensity of the haemorrhage was also reduced. (B) T2 and LGE PSIR images of the infarct.
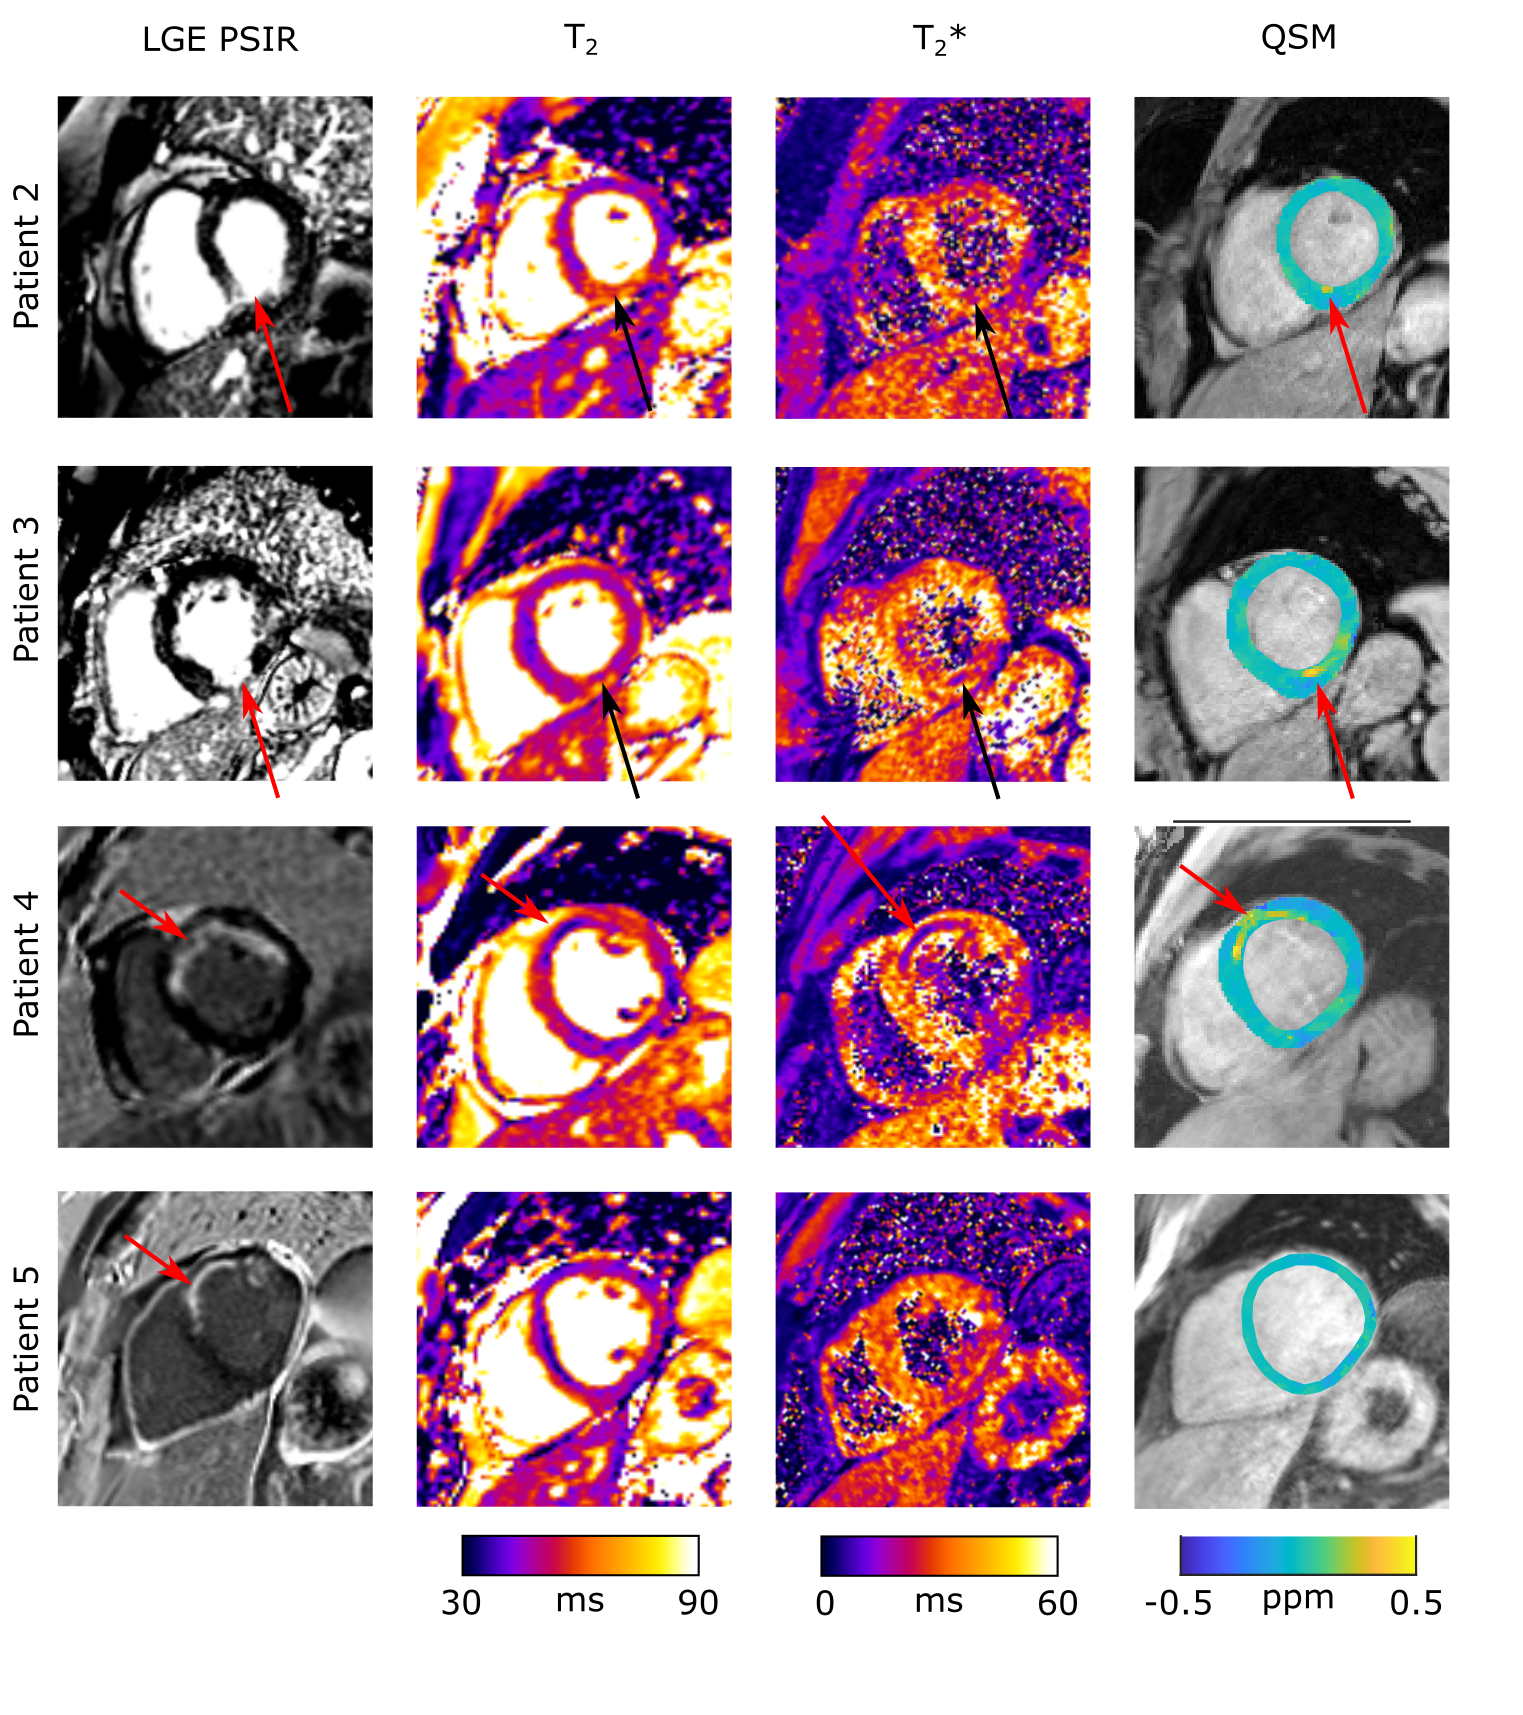
Figure 4: LGE, T2, T2* and QSM maps for 4 patients exhibiting myocardial scar. In patients 2,3,4 the T2 maps show a hyper intense region of edema, containing hypo intense areas, indicative of IMH and T2* maps show hypo intense regions indicating iron deposition associated with IMH. This is matched by the QSM maps which show hyper intense regions, corresponding to the regions of haemorrhage identified by T2* maps. In patient 5, IMH is not identified by T2/T2* or QSM.