1383
In vivo mapping of the intra-cortical vasculature and layer-specific changes in Δχ and ΔR2* of human cerebral cortex using USPIO-MRI at 7T1Bernard and Irene Schwartz Center for Biomedical Imaging, Department of Radiology, New York University Grossman School of Medicine, New York, NY, United States, 2Center for Advanced Imaging Innovation and Research (CAI2R), Department of Radiology, New York University Grossman School of Medicine, New York, NY, United States, 3Vilcek Institute of Graduate Biomedical Sciences, New York University Grossman School of Medicine, New York, NY, United States, 4Department of Neurology, Wayne State University School of Medicine, Detroit, MI, United States, 5Department of Radiology, Wayne State University School of Medicine, Detroit, MI, United States
Synopsis
Keywords: Blood Vessels, Blood vessels
Motivation: In vivo imaging of intra-cortical vessels of human brain, including penetrating arteries, veins and capillary density are still scarce.
Goal(s): To reconstruct the in vivo intra-cortical vessels of the human brain and estimate the cortical layer-specific changes in susceptibility (χ) in the presence of superparamagnetic iron oxides.
Approach: With aid of Ferumoxytol at 7T, high resolution gradient echo imaging was implemented to reconstruct pre-/post-SWI, R2* and χ maps.
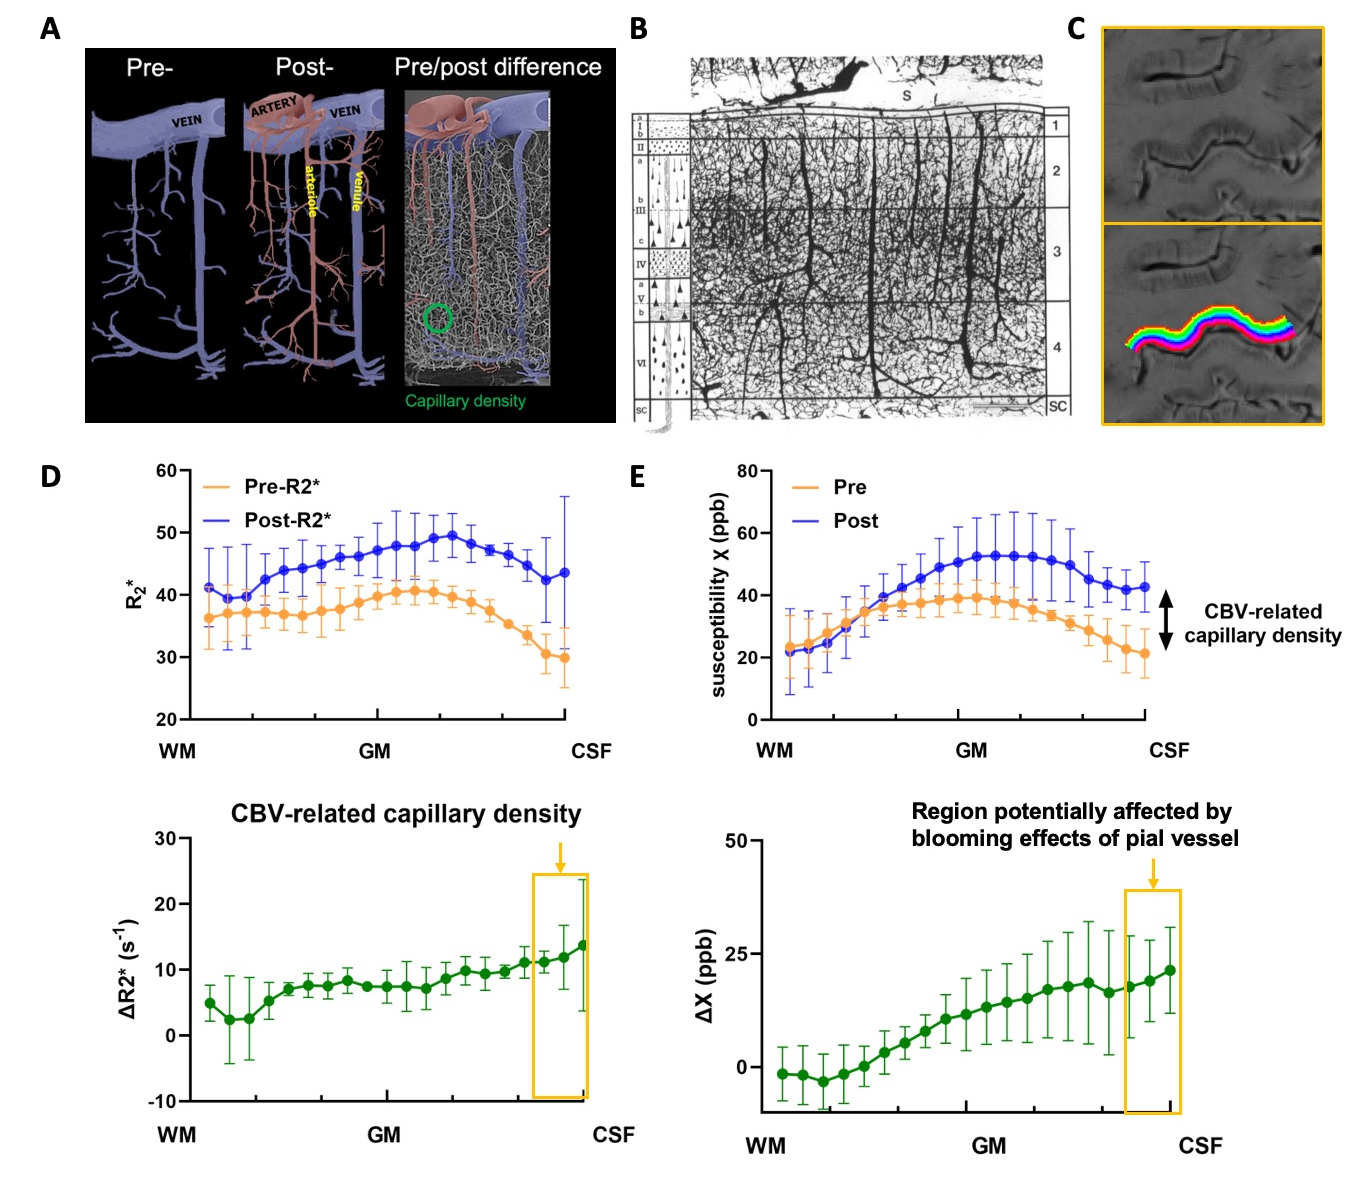
Results: Intra-cortical penetrating arteries and veins can be differentiated by pre- and post-contrast SWI. Changes in R2* and χ revealed variations reflective of capillary density across different layers, which is in agreement with histological findings.
Impact: This study provides in vivo imaging characterization of intra-cortical vessels of human brain using high-resolution Ferumoxytol-enhanced SWI at 7T. Utilizing changes in R2* and χ enables us delve deeper into the laminar distribution of capillary density across various cortical layers.
Introduction
With ultrahigh-field susceptibility imaging, in vivo mapping of small vascular structures and functions has become feasible, enabling us to study the intra-cortical vessels and laminar vascular imaging while also paving a new approach to study neural activity in cortical layers1-3. However, the laminar profile of the BOLD signal is often confounded by the inherent vascular contamination4 and blood volume variations5 across different cortical layers. In vivo differentiation of the vasculature within the cortical layers provides important anatomical reference to understand the signal origin of BOLD across different layers. However, the in vivo imaging of intra-cortical vessels remains limited, with post-mortem histological staining being the primary source of studies6. In addition, the post-mortem studies only depict late stage vascular anatomy, and lacks physiological data and references for functional analysis. At ultrahigh-field strength, susceptibility weighted imaging (SWI) empowers us to probe the cortical regions in vivo with superior resolution and vascular sensitivity7. Moreover, the administration of ultrasmall superparamagnetic iron oxide (USPIO) contrast agents can greatly improve SWI sensitivity in capturing vessels at microscale due to their blooming effect8-10. Furthermore, when the capillary networks are saturated with Ferumoxytol, the cortical capillary density can be estimated by analyzing the relaxation (ΔR2*) or susceptibility differences (Δχ) from pre- and post-contrast data after eliminating the visible vasculatures from SWI11-13. Therefore, in this study, we first present imaging characterization of the intracortical vessel distribution detected on Ferumoxytol-enhanced SWI at 7T, and then estimate the changes caused by the capillary density across different cortical layers using ΔR2* and Δχ maps derived from 7T gradient echo data.Materials and methods
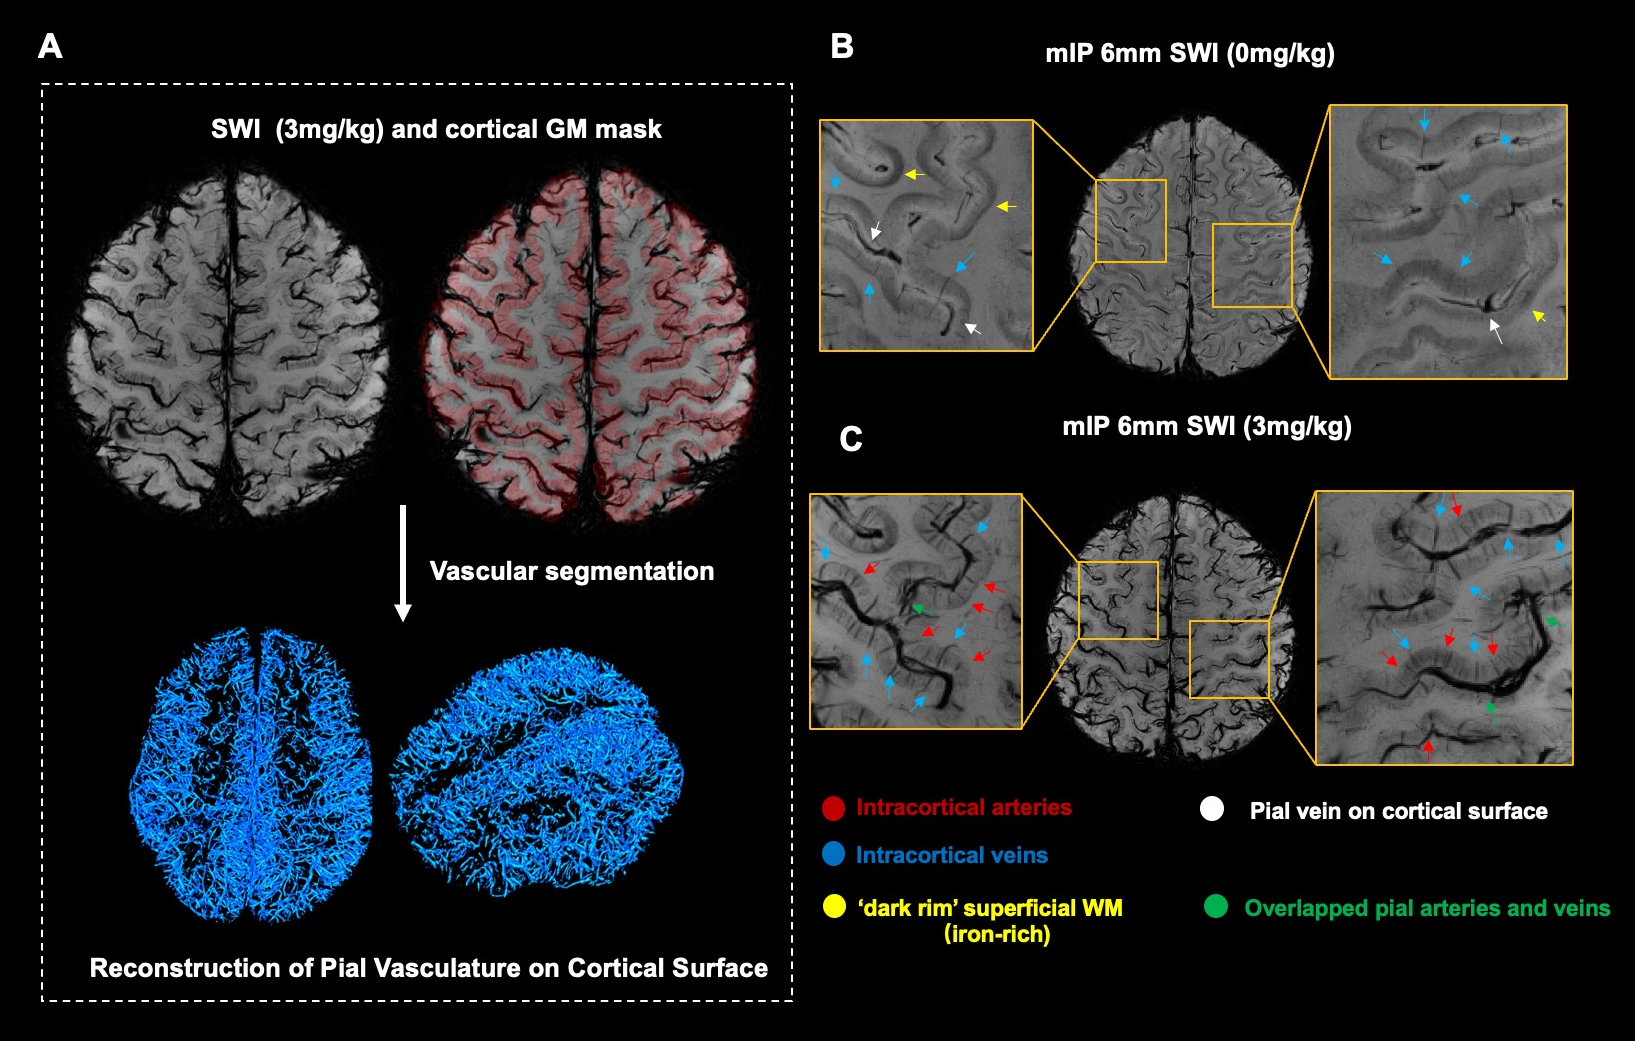
Six healthy volunteers (average age: 38.2±16.2 years, F/M = 3/3) participated in this study involving Ferumoxytol-enhanced 7T MRI. The scan consisted of two sessions: the first for pre-contrast imaging and the second for post-contrast imaging. In the first session, we acquired dual-echo gradient echo SWI (TE1/TE2/TR=7.5/15/22ms, matrix size: 176×216×256, voxel size 0.25×0.25×1mm3) to generate pre-contrast SWI, R2* and quantitative susceptibility mapping (QSM) data using the iSWIM algorithm14. T1-MPRAGE data (voxel size: isotropic 1mm, TE/TR=3.24/2300ms) were also acquired for tissue and cortical structural segmentation using MRIclouds (https://braingps.mricloud.org/). The second session replicated the SWI sequence, with volunteers receiving 3mg/kg Ferumoxytol of IV infusion. The vasculature in the cortex was registered to T1 space and overlaid on SWI data to perform vascular segmentation and create a 3D reconstruction of the pial vasculature throughout the entire brain (Figure 1A). To assess the layer specific profile of R2* and QSM images, LayerNii toolbox (https://github.com/layerfMRI/LAYNII) was used to delineate twenty layers in primary motor cortex (M1) using both pre- and post-contrast data. To evaluate the blooming effects of USPIO in pial vessels, Δχ of the first three layers near the CSF-GM boundary was excluded and with the remaining layers analyzed.Results
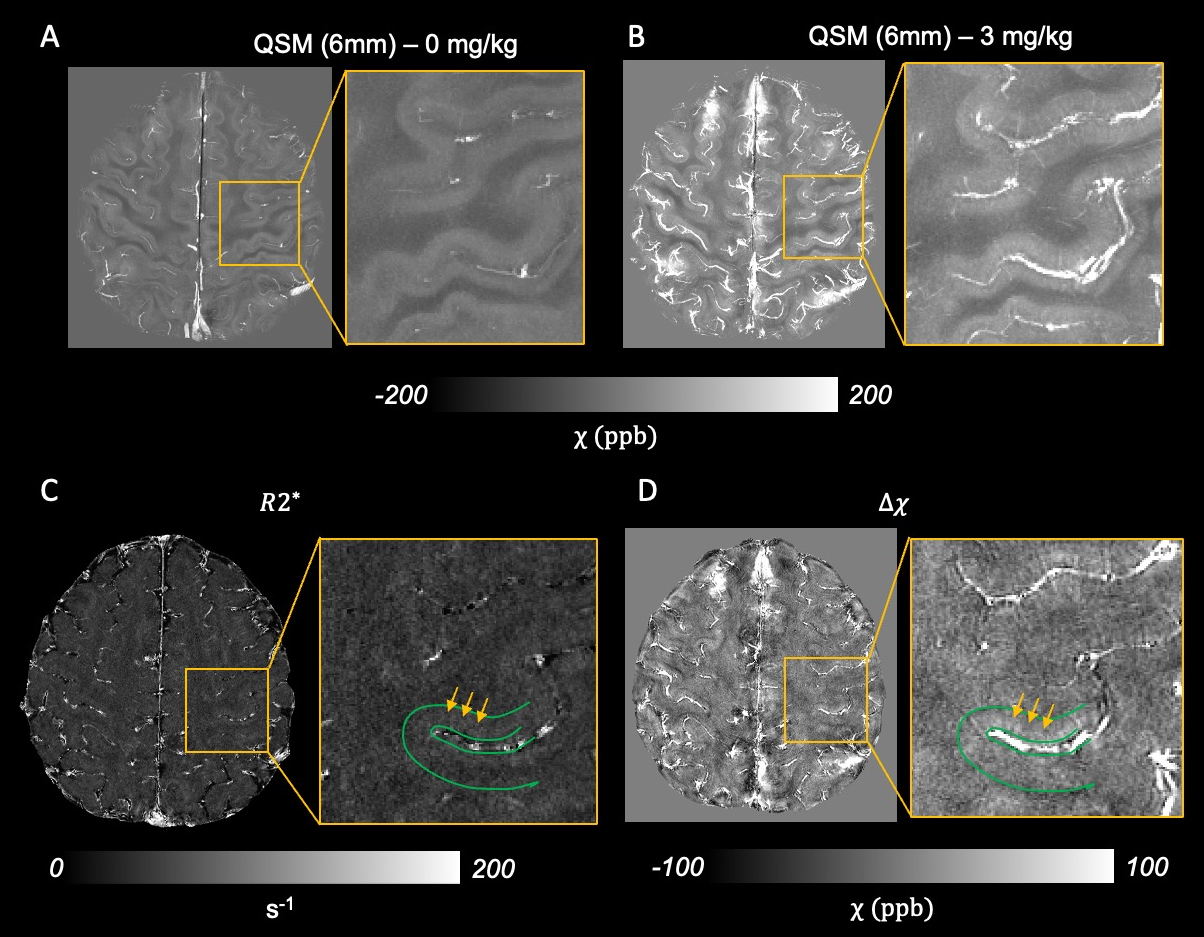
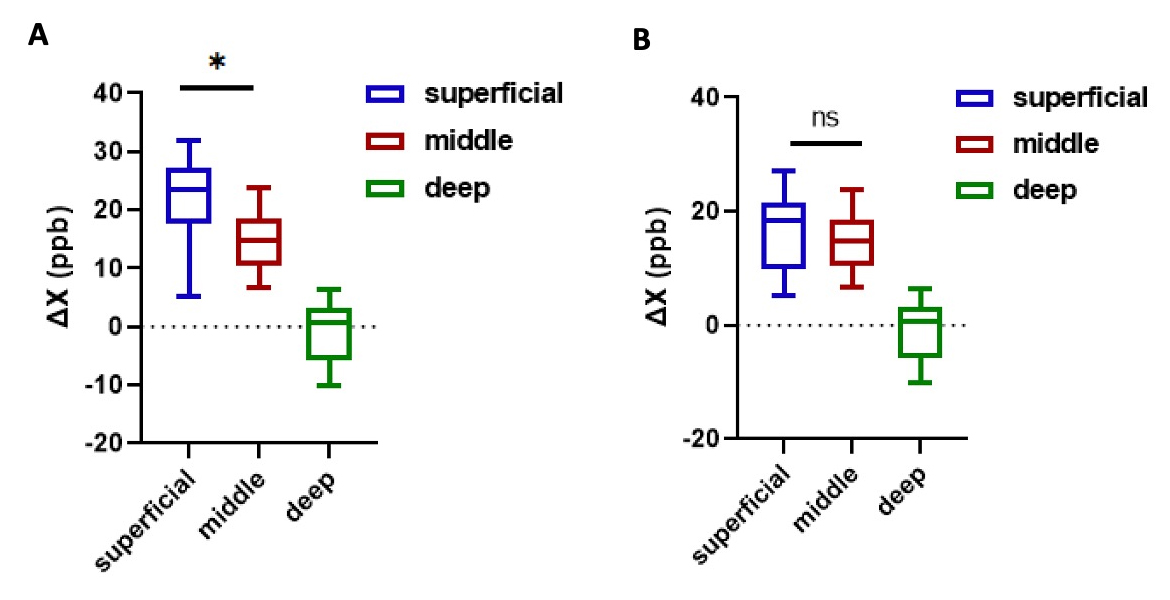
As shown in Figure 1, 3D reconstruction reveals the rendered pial vasculature from post-contrast SWI, highlighting enhanced pial arteries and veins on the cortical surface. The intricate intra-cortical penetrating arteries and veins across various cortical layers are observed, which facilitate the circulation of arterial and venous blood. In Figure1 B, the pre-contrast SWI delineates only venous structures, displaying pial veins (white arrow) and intra-cortical veins (blue arrow). In the post-contrast data, both intracortical arteries and veins are mapped on the SWI images. By analyzing ΔR2* and Δχ between pre- and post-contrast data (Figure 2), we depicted variations in capillary density across different layers with increasing Δχ and R2* towards the superficial layers (Figure 3). Additionally, we assessed the blooming effect of Ferumoxytol in the pial vasculature, suggesting that capillary density may be overestimated in the superficial layers near the CSF (Figure 4).Conclusion and discussion
Our results provide initial imaging evidence of the intricate penetrating arteries and veins for the human cerebral cortex in vivo. By using high resolution SWI and QSM data reconstructed from gradient echo images, we were able to examine susceptibility changes across various cortical layers with sufficient resolution. The quantitative R2* and Δχ analyses allowed us to further explore the laminar distribution of capillary density, aligning with prior research findings15. As shown in Figure 1B and 1C, the SWI contrast between different layers is diminished following Ferumoxytol administration, this is likely due to the elevated susceptibility in the capillary bed induced by the contrast agent. In summary, the proposed methods provide a detailed depiction of the microvasculature within the cortical layers. Further studies combining high resolution SWI with fMRI are essential to gain insight into the impact of capillary density on the BOLD signal across diverse cortical layers.Acknowledgements
No acknowledgement found.References
1. Polimeni, Jonathan R., et al. "Laminar analysis of 7 T BOLD using an imposed spatial activation pattern in human V1." Neuroimage 52.4 (2010): 1334-1346.
2. Koopmans, Peter J., et al. "Multi-echo fMRI of the cortical laminae in humans at 7 T." Neuroimage 56.3 (2011): 1276-1285.
3. Puckett, Alexander M., et al. "The spatiotemporal hemodynamic response function for depth-dependent functional imaging of human cortex." Neuroimage 139 (2016): 240-248.
4. Kok, Peter, et al. "Selective activation of the deep layers of the human primary visual cortex by top-down feedback." Current Biology 26.3 (2016): 371-376.
5. Huber, Laurentius, et al. "Cortical lamina-dependent blood volume changes in human brain at 7 T." Neuroimage 107 (2015): 23-33.
6. Duvernoy, Henri M., S. L. V. J. Delon, and J. L. Vannson. "Cortical blood vessels of the human brain." Brain research bulletin 7.5 (1981): 519-579.
7. Deistung, Andreas, et al. "Susceptibility weighted imaging at ultra high magnetic field strengths: theoretical considerations and experimental results." Magnetic Resonance in Medicine: An Official Journal of the International Society for Magnetic Resonance in Medicine 60.5 (2008): 1155-1168.
8. Buch, Sagar, et al. "Vascular mapping of the human hippocampus using Ferumoxytol-enhanced MRI." Neuroimage 250 (2022): 118957.
9. Buch, Sagar, et al. "Subvoxel vascular imaging of the midbrain using USPIO-Enhanced MRI." Neuroimage 220 (2020): 117106.
10. Shen, Yimin, et al. "Detecting sub-voxel microvasculature with USPIO-enhanced susceptibility-weighted MRI at 7 T." Magnetic resonance imaging 67 (2020): 90-100.
11. Kim, Seong‐Gi, et al. "Cerebral blood volume MRI with intravascular superparamagnetic iron oxide nanoparticles." NMR in Biomedicine 26.8 (2013): 949-962.
12. D'Arceuil, Helen, et al. "Ferumoxytol enhanced resting state fMRI and relative cerebral blood volume mapping in normal human brain." Neuroimage 83 (2013): 200-209.
13. Christen, Thomas, et al. "High‐resolution cerebral blood volume imaging in humans using the blood pool contrast agent ferumoxytol." Magnetic resonance in medicine 70.3 (2013): 705-710.
14. Tang, J., et al. "Improving susceptibility mapping using a threshold‐based K‐space/image domain iterative reconstruction approach." Magnetic resonance in medicine 69.5 (2013): 1396-1407.
15. Shao, Xingfeng, et al. "Laminar perfusion imaging with zoomed arterial spin labeling at 7 Tesla." NeuroImage 245 (2021): 118724.
Figures