1382
Assessing Cerebral Microvascular Compliance with High-Resolution VASO MRI at 7T1University of Southern California, Los Angeles, CA, United States
Synopsis
Keywords: Vascular, Cardiovascular, vessel compliance, white matter, laminar, deep white matter
Motivation: Compliance of the cerebral microvasculature is critical for brain hemodynamics but remains challenging to measure due to the complex cerebral vascular architecture and limitations in imaging technology.
Goal(s): This study aims to utilize high-resolution VASO MRI across cardiac cycles to quantify microvascular compliance at 7T.
Approach: Vascular compliance (VC) was defined as the ratio of CBV changes to changes in blood pressure across a cardiac cycle, which was proportional to the change in rCBV.
Results: The middle layer of grey matter exhibits lower VC than superficial and deep layers. While higher VC was observed in the white matter (WM), especially deep WM.
Impact: The proposed high-resolution VASO MRI offers a promising noninvasive method for estimating cerebral microvascular compliance.
Introduction
Vascular compliance(VC), a key parameter in cardiovascular physiology, refers to the ability of blood vessels to expand and contract in response to changes in blood pressure and volume. In the context of cerebral circulation, VC plays a significant role in modulating cerebral blood flow(CBF) and is integral to the brain's autoregulatory capacity. Changes in VC can lead to a range of clinical implications, notably in depression1, stroke2, small vessel disease3, and dementia4. Understanding VC in the brain is not only essential for elucidating the pathogenesis of various neurovascular disorders but also holds potential in improving diagnostic capabilities and therapeutic interventions. However, direct measurement and characterization of VC, especially in the cerebral microvasculature, remain challenging due to the limitations in imaging technologies and the complexity of the brain's vascular architecture. In this study, we used a fast sub-millimeter VASO(Vascular Space Occupancy) technique to estimate VC in the microvasculature of grey and white matter.Methods
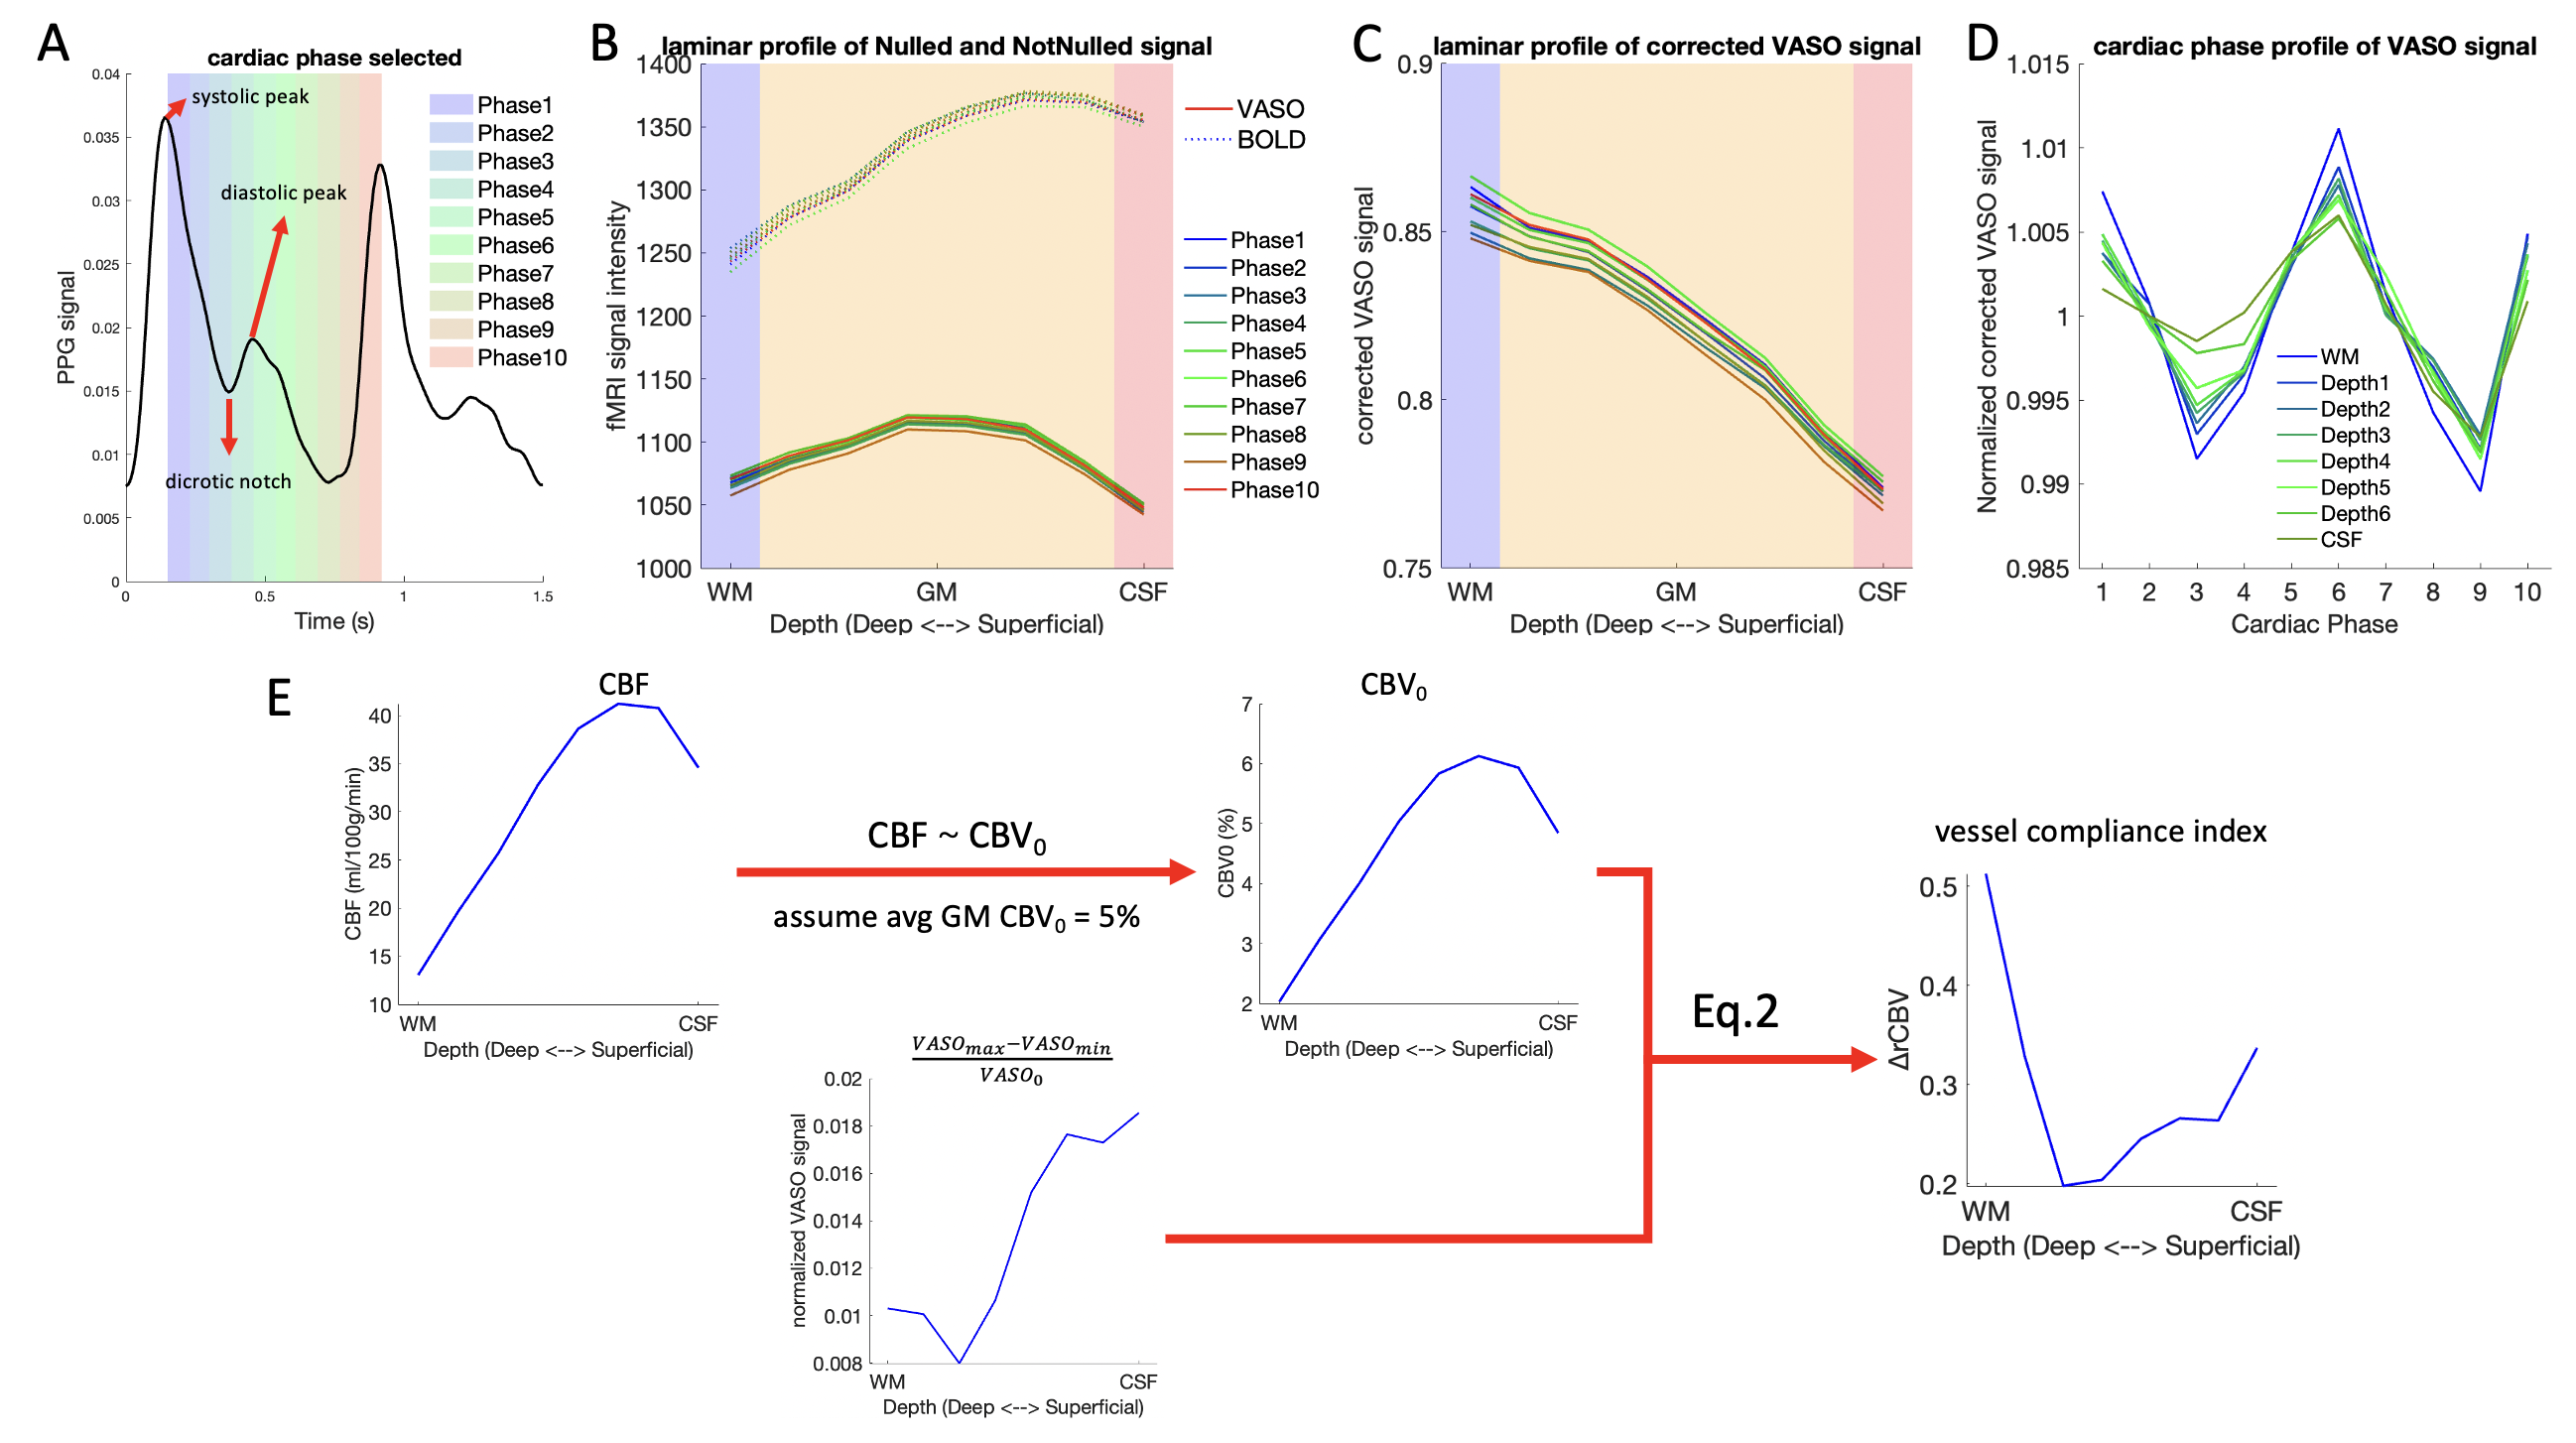
Four participants(1 female, age=28±0.8 years) underwent MRI scans on a Siemens 7T Terra scanner with an 8TX/32Rx head coil. T1-weighted anatomical volumes were acquired using a MP2RAGE sequence with iso-0.7mm resolution. Functional data were acquired with a VASO sequence5(iso-0.9mm, matrix=148x148x18, TI/volumeTR/pairTR/TE=1179/895/2695/14.3ms), while the pulse signal was simultaneously recorded using Biopac system. A high-resolution(iso-1.25mm) 3D TFL-pCASL sequence6 was also acquired for resting CBF(FOV=220x200x100mm, matrix size=176x160x80, TE=3ms, TR=6-7s, FA=8°, 1.5s label and post-label delay).Data preprocessing was performed using AFNI, FreeSurfer and mripy-package(https://github.com/herrlich10/mripy). The cardiac cycle was divided into 10 equal phases, and the VASO and associated BOLD images were retrospectively binned into the 10 cardiac phases which were divided to correct for BOLD effects(Fig.1A). We calculated the cortical depth according to the equal-volume-algorithm and divided it into 6 equal layers.
According to literature7 VC=ΔV/ΔP, where V is the blood volume and P is blood pressure. Assuming that ΔP of each voxel is constant, then VC~ΔV=rCBVmax-rCBVmin. rCBVmax and rCBVmin are the maximum and minimum values of relative CBV in a cardiac cycle respectively. The relative cerebral blood volume(rCBV) can be calculated as:
$$rCBV=\frac{CBV}{CBV_{0}}=\frac{1}{CBV_{0}}-\left(\frac{1}{CBV_{0}}-1\right)\frac{VASO}{VASO_{0}}\ [1]$$
where CBV0 and VASO0 refers to resting state CBV and VASO signal respectively. We can define an vessel compliance index(VCI) which is proportional to rCBV changes across a cardiac cycle: $$VCI\sim rCBV_{max}-rCBV_{min}=\left(\frac{1}{CBV_{0}}-1\right)\frac{VASO_{max}-VASO_{min}}{VASO_{0}}\ [2]$$
By assuming CBV0 is proportional to CBF0 measured by ASL, and the average CBV0 of gray matter8 is about 5%, we can estimate the laminar profile of CBV0 and VCI in different brain areas(Fig.1E).
Results and Discussion
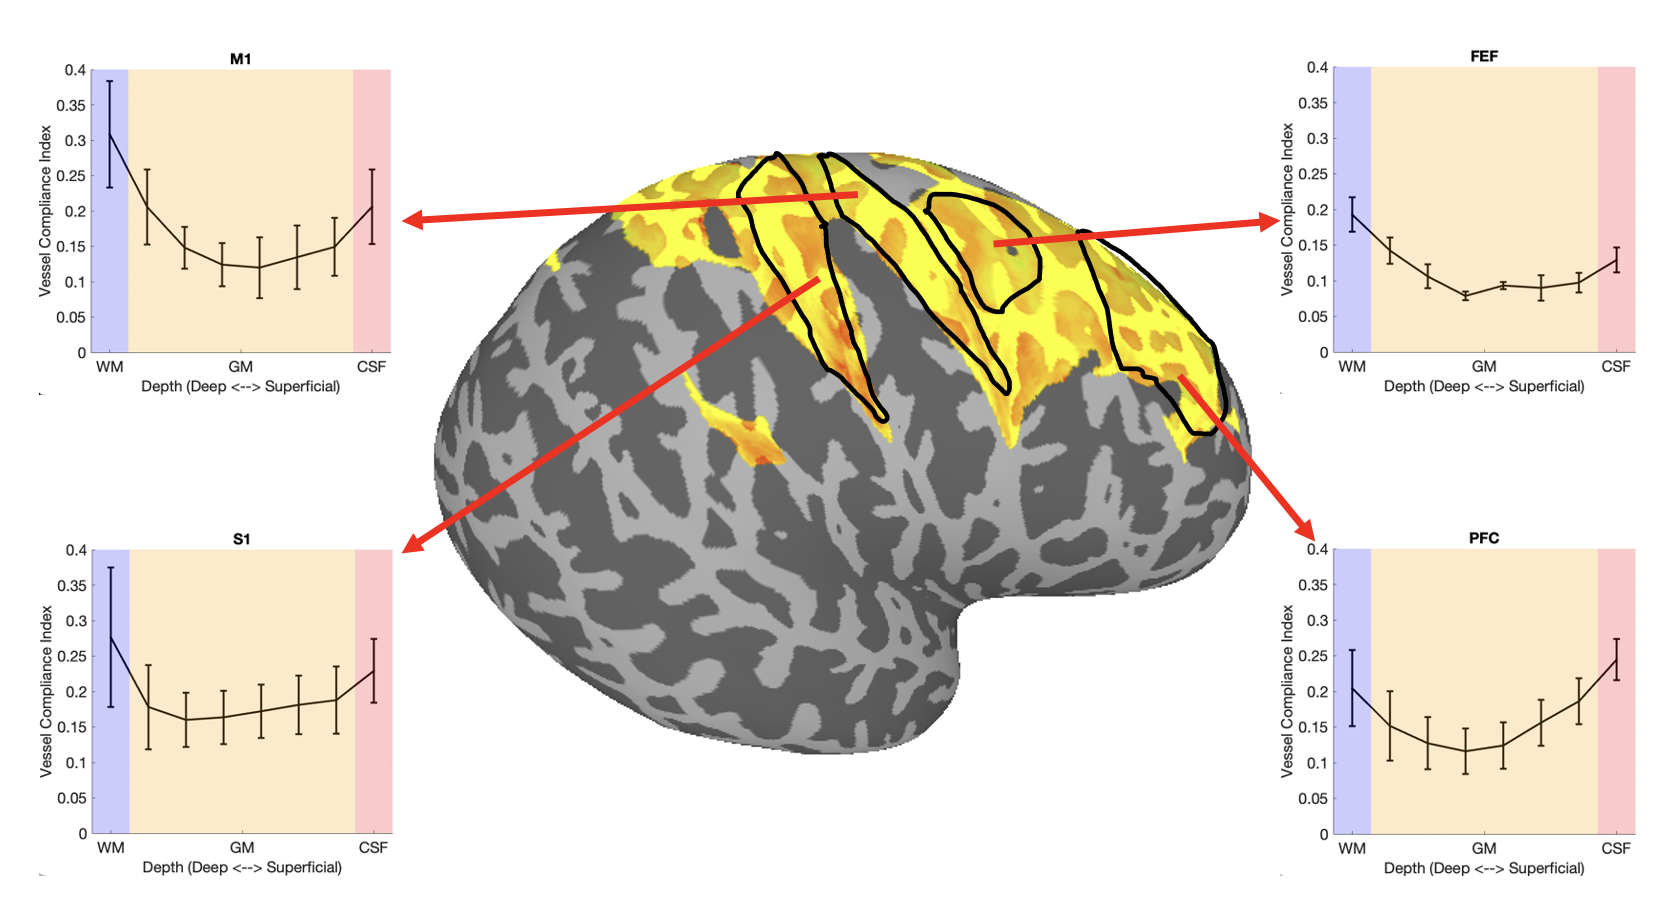
Fig.1A shows 2 cardiac cycles of recorded pulse signal and 10 equal cardiac phases for binning VASO images. Fig.1B shows the laminar profile of raw VASO(solid line) and associated BOLD(dashed line) signal of a representative subject, and Fig.1C shows the laminar profile of corrected VASO signal. Fig.1D shows VASO signal variations across cardiac cycles in WM, CSF and 6 GM layers, according to which the VCI can be calculated(Fig.1E).Fig.2 shows the laminar profiles of VCI in S1, M1, frontal eye-field(FEF) and prefrontal cortex(PFC) respectively, including superficial WM. It can be seen that the VCI is the lowest around the middle layer. This is consistent with the observation that the middle layer of most brain areas is mainly the input cortex and has higher capillary density9. The VC of capillaries is relatively weak, resulting in a low VCI in the middle layer. The VCI of CSF and superficial WM is generally higher than that in GM. It is known that CSF contains larger pial arterioles/venules while WM is supplied by medullary arteries with less capillary distribution.
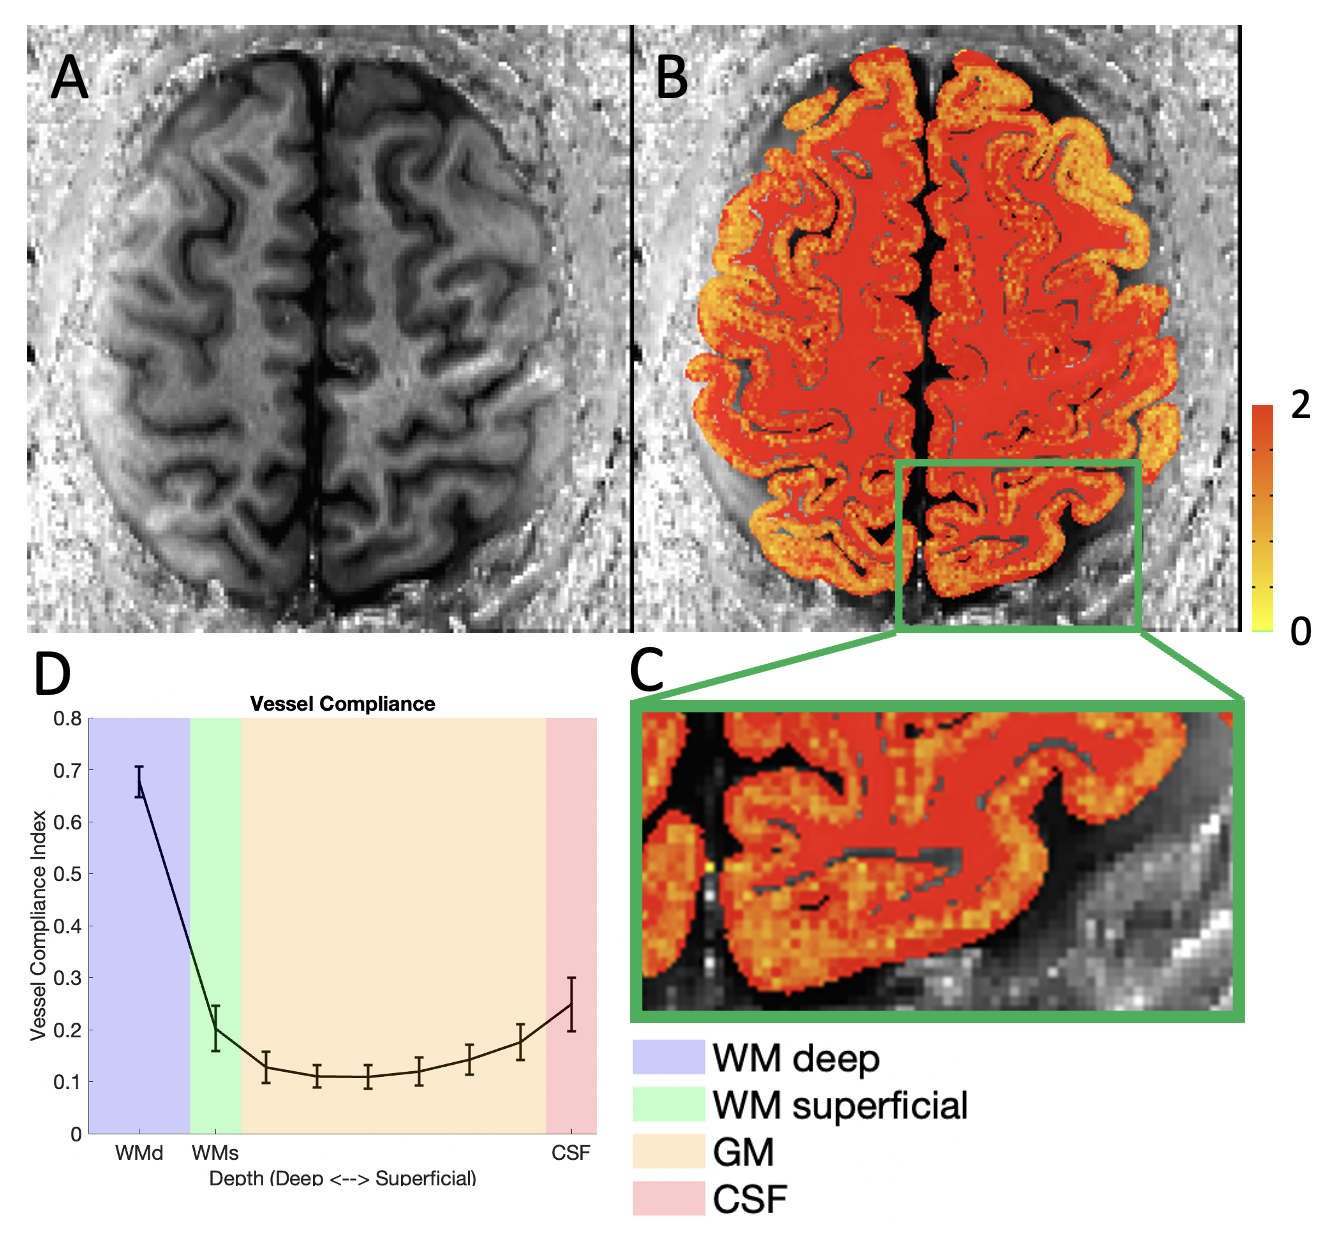
We further explored VCI in deep WM. Fig.3A shows the corrected VASO image and Fig.3B is the VCI map. We can clearly see that the VC in the WM is significantly higher than that in the GM. Fig.3C of enlarged view clearly shows that the CSF and GM superficial layers have higher VC than the GM middle layer. Fig.3D is the laminar profile of the whole FOV. This result reveals that WM, especially deep WM, has higher VC. Our finding is consistent with the fact that deep WM has low capillary density than GM and is supplied by distal end of medullary arteries, which makes deep WM particularly susceptibility to hypoperfusion and cerebral small vessel disease.
Conclusion
A fast high-resolution VASO sequence was utilized to estimate cerebral microvascular compliance. It was discovered that the vessel compliance is lower in the middle layer of the cortex than superficial and deep layers. while vessels in cerebrospinal fluid (CSF) and white matter (WM) displayed higher compliance, with those in deep WM showing particularly high compliance.Acknowledgements
The authors thank Drs. Laurentius Huber and Ruediger Stirnberg for sharing the VASO sequence. This work was supported by US NIH grants R01-EB032169 and R01-EB028297References
1. Thomas O, Cain J, Nasralla M, Jackson A. Aortic Pulsatility Propagates Intracranially and Correlates with Dilated Perivascular Spaces and Small Vessel Compliance. Journal of Stroke and Cerebrovascular Diseases 2019;28(5):1252-1260.2.
2. Laurent S, Katsahian S, Fassot C, Tropeano AI, Gautier I, Laloux B, Boutouyrie P. Aortic stiffness is an independent predictor of fatal stroke in essential hypertension. Stroke 2003;34(5):1203-6.3.
3. Jay Cohn. Arterial Compliance to Stratify Cardiovascular Risk: More Precision in Therapeutic Decision Making. the American Journal of Hypertension 2001;14:258S-263S.4.
4. Dhoat S, Ali K, Bulpitt C J, Rajkumar C. Vascular compliance is reduced in vascular dementia and not in Alzheimer's disease. Age Ageing 2008;37(6):653-9.5.
5. Huber L, Ivanov D, Krieger SN, Streicher MN, Mildner T, Poser BA, Moller HE, Turner R. Slab-selective, BOLD-corrected VASO at 7 Tesla provides measures of cerebral blood volume reactivity with high signal-to-noise ratio. Slab-selective, BOLD-corrected VASO at 7 Tesla provides measures of cerebral blood volume reactivity with high signal-to-noise ratio. Magnetic Resonance in Medicine 2014;72:137–148.6.
6. Zhao C, Shao X, Shou Q, Ma SJ, Gokyar S, Graf C, Stollberger R, Wang DJ. Whole-Cerebrum distortion-free three-dimensional pseudo-continuous arterial spin labeling at 7T. Neuroimage 2023;277:120251.7.
7. Mark EW, Per KE, Joseph RM. The pulsating brain: A review of experimental and clinical studies of intracranial pulsatility. Fluids and Barriers of the CNS 2011;8:5.8.
8. Leenders KL, Perani D, Lammertsma AA, Heather JD, Buckingham P, Healy MJ, Gibbs JM, Wise RJ, Hatazawa J, Herold S, et al. Cerebral blood flow, blood volume and oxygen utilization. Normal values and effect of age. Brain 1990;113:27-47.9.
9. Schmid F, Barrett MJP, Jenny P, Weber B. Vascular density and distribution in neocortex. Neuroimage 2019;197:792-805.
Figures