1379
Venous vessel size imaging derived from a breath-hold task1Department of Diagnostic and Interventional Radiology, Heidelberg University Hospital, Heidelberg, Germany, 2Heidelberg University, Heidelberg, Germany, 3Divison of Radiology, German Cancer Research Center, Heidelberg, Germany, 4Divison of Medical Physics in Radiology, German Cancer Research Center, Heidelberg, Germany
Synopsis
Keywords: Blood Vessels, Blood vessels
Motivation: Vessel size imaging, which provides a measure for the vessel radius, is usually performed by injection of contrast agent. Venous vessel radius imaging is also possible by exploiting hypercapnia and hyperoxia. However, these respiratory challenges need external devices such as special masks and monitors.
Goal(s): The question would be if we could measure vessel size wihtout contrast agent in a simple setup.
Approach: In this study, we employ a breath-hold task that doesn’t need external devices to mimic hypercapnia for the measurement of venous vessel size.
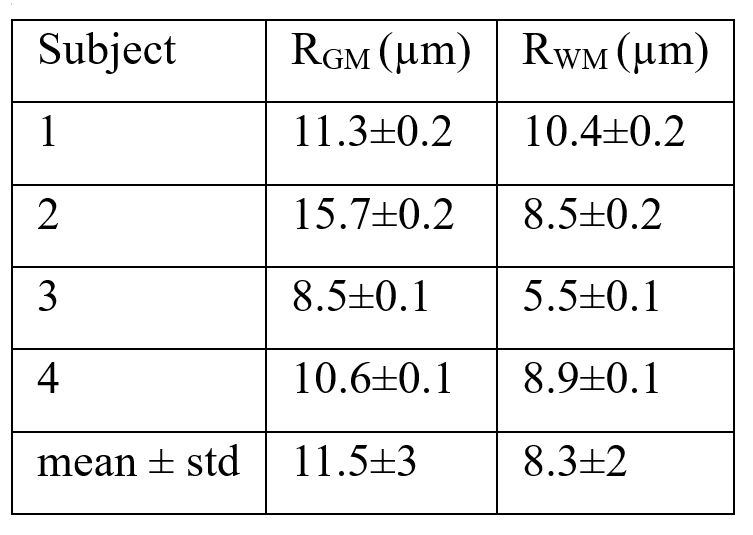
Results: Mean venous vessel radii in GM and WM are 11.5±3 and 8.3±2 µm from initial tests.
Impact: Mean venous vessel radii during hypercapnia were 7.3±0.3 µm in GM and 6.6±0.5 µm in WM, respectively, from a previous study. Our results are close to these parameters. This study presents the feasibility of VSI using a breath-hold task.
INTRODUCTION
Vessel size imaging (VSI) MRI is a technique for the noninvasive measurement of vessel radii (1,2). VSI was first proposed by Tropres et al. (3) using an injection of a paramagnetic contrast agent (CA) to exploit the intrinsic contrast difference between gradient-echo (GE) and spin-echo (SE) signals which depend on the blood vessel radius. During CA pass through, the GE and SE signals change depending on the respective changes in the relevant transverse relaxation rates, ΔR2* and ΔR2, respectively. However, changes in R2* and R2 can not only be induced by the injection of contrast agent, but also by altering the BOLD contrast through hypoxia, hypercapnia or hyperoxia (4). Using this noninvasive and contrast-free approach, based on the BOLD effect, is an attractive alternative approach due to its completely noninvasive nature. In this work, we examine VSI based on a breath-hold task to mimic externally induced hypercapnia.METHODS
Four healthy volunteers (2 female, 2 male, aged 33 ± 6 years) were examined prospectively using a 20-channel head coil on a 3T scanner (Magnetom Prisma, Siemens Healthineers, Erlangen, Germany). All participants provided written informed consent, and the study was approved by the institutional ethics committee. To measure VSI, a breath-hold (BH) respiratory challenge was integrated into an existing brain imaging protocol: for block-designed BH tasks, 110 measurements were obtained, which included five and a half BH/FB (free breathing) cycles with 20 measurements (32s) per cycle and 10 measurements (17s) per half cycle. A spin- and gradient-echo (SAGE) EPI sequence was developed to catch both GE and SE signals. Specific sequence and data analysis parameters were as follows: FOV=220×220 mm2, matrix size=64×64×28, resolution=3.4×3.4×3.5 mm3, slice gap = 0.7 mm, in-plane iPAT factor=2, multiband factor=2, bandwidth = 1776 Hz/px, TEGE/TESE/TR= 27.08/90/1700 ms. Assuming a monoexponential signal decay, ΔR2* and ΔR2 were calculated according to (4):$$\Delta R_{2}^*=-\frac{ln(S_{GE}(BH)/S_{GE}(FB))}{TE_{GE}}$$
$$\Delta R_{2}=-\frac{ln(S_{SE}(BH)/S_{SE}(FB))}{TE_{SE}}$$
where SGE(BH), SGE(FB), SSE(BH) and SSE(FB), are the GE and SE signal intensities during BH and FB, respectively. Finally, the vessel size index was calculated according to:
$$q=\frac{\Delta R_{2}^*}{\Delta R_{2}}$$
To find the relationship between vessel radii R and vessel size index q, a numerical simulation was performed (5). Randomly oriented infinite cylinders with different vessel radius R were defined with blood volume fraction of 4%. The off-resonance frequency Δω(r) was calculated based on an average blood oxygenation of ϒ ≈ 0.6 for FB and 0.75 for BH (4), with hematocrit (Hct)≈0.4 and field strength B0 = 3 T. The phase evolution of virtual spin packets placed randomly throughout the tissue was simulated in the rotating frame of ω0 = γB0, based on the local off-resonance frequencies Δω(r) encountered during a 3D discrete-time, continuous-space random walk with tunable time steps and Gaussian distributed step size to model water diffusion. This random-walk implementation was motivated by the Bloch–Torrey equation, which governs the NMR signal evolution with proton diffusion effects. In our simulations, the vessels acted as impermeable diffusion barriers toward the virtual spin packets and we omitted longitudinal relaxation with T1. The simulation parameters were as follows: virtual voxel sizes 200 μm; mean extravascular spin packet density of 5 μm−3; water proton diffusion coefficient D = 1 μm2/ms; diffusion time step δt = 0.1 ms; T2,tissue=83.5ms; T2,blood (FB)=32.3ms; T2,blood (BH)=53.2ms; resolution of grid with calculated field distortion: 0.8×0.8×0.8 μm3.
RESULTS
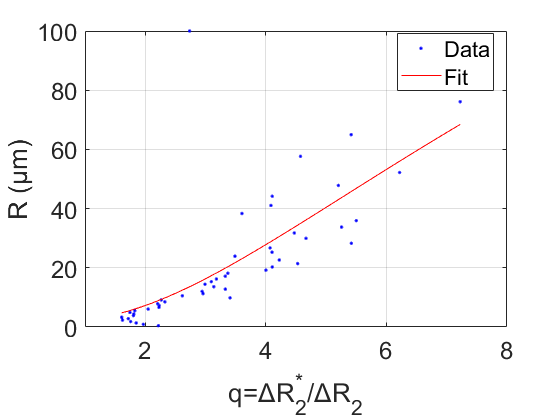
The dependence of mean vessel radius R on the vessel size index q is shown in Fig. 1. A calibration curve was constructed by fitting a sixth-order logarithmic equation:$$R(q)=\sum_{n=0}^{6}P_{n}ln^n(q)$$
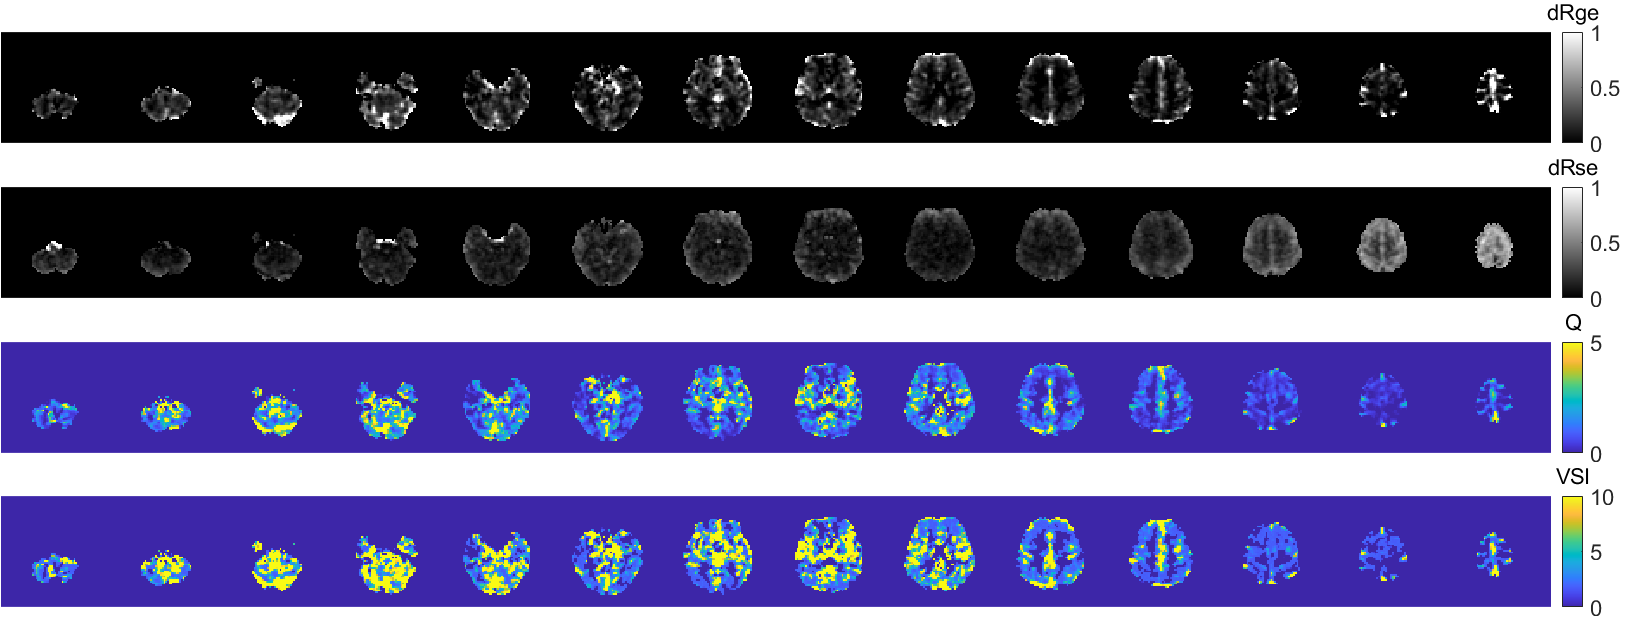
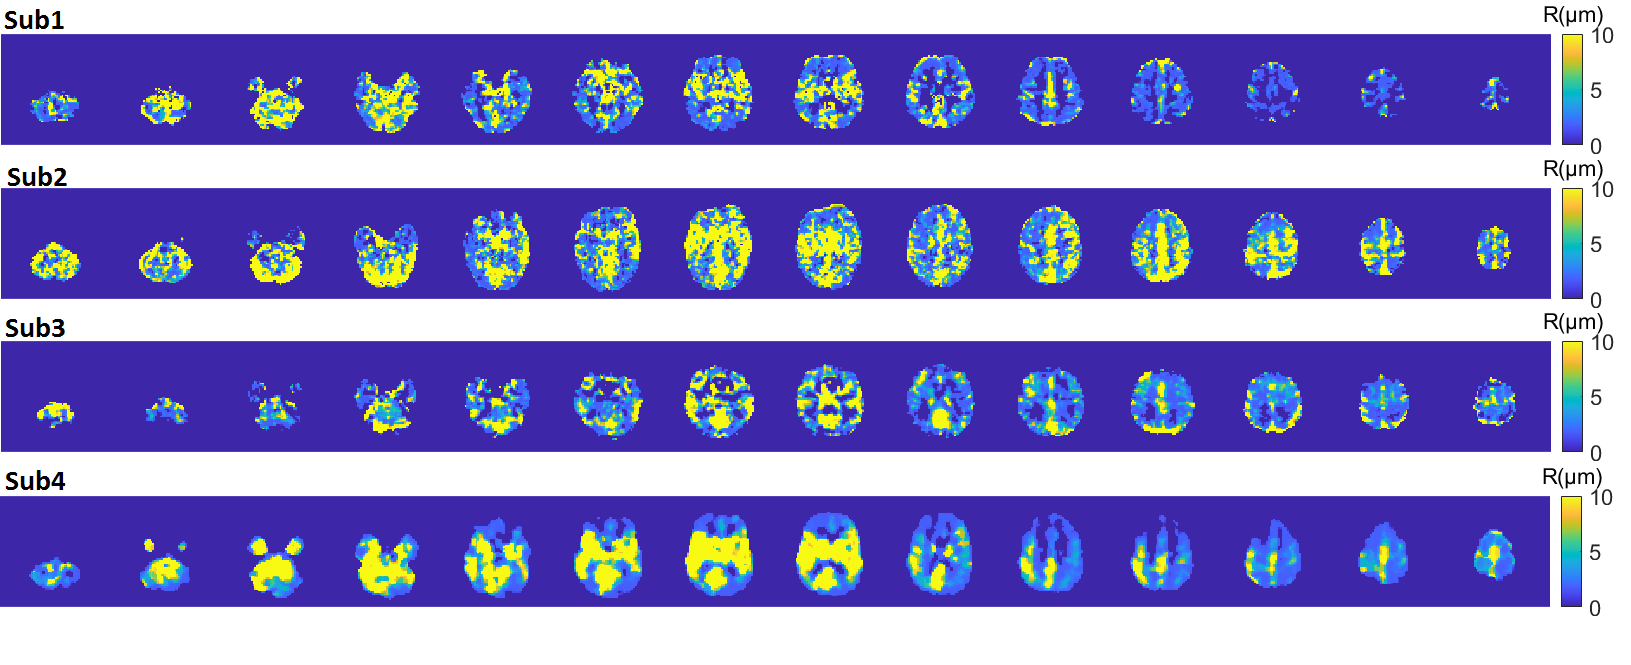
The fit was performed by nonlinear least squares implemented in MATLAB. Robust regression residuals using the bisquare weight function was applied. Pn was fitted as [2.35, 2.54, 3.57, 2.70, 2.12, 0.53, -0.37]. Fig. 2 shows the calculated ΔR2* (dRge) and ΔR2 (dRse) maps in response to BH. Parameter q is the ratio between them, and VSI in µm is calculated based on q and the fitting equation. Fig. 3 shows venous vessel radii from four subjects. The mean venous vessel radii in gray matter (GM) and white matter (WM) in each individual subject are shown in Table 1. Mean venous vessel radii in GM and WM are 11.5±3 and 8.3±2 µm, respectively.
DISCUSSION
Mean venous vessel radii during hypercapnia were 7.3±0.3 µm in GM and 6.6±0.5 µm in WM, respectively, from a previous study (4). Our results are close to these parameters. In the future, multi-echo SAGE for quantitative measurements of T2 and T2* is needed to quantify oxygenation level and relaxation times used in numerical simulations.CONCLUSION
This study presents the feasibility of VSI using a breath-hold task.Acknowledgements
No acknowledgement found.References
1. Emblem KE, Mouridsen K, Bjornerud A, Farrar CT, Jennings D, Borra RJ, Wen PY, Ivy P, Batchelor TT, Rosen BR, Jain RK, Sorensen AG. Vessel architectural imaging identifies cancer patient responders to anti-angiogenic therapy. Nat Med 2013;19(9):1178-1183.
2. Stadlbauer A, Zimmermann M, Heinz G, Oberndorfer S, Doerfler A, Buchfelder M, Rossler K. Magnetic resonance imaging biomarkers for clinical routine assessment of microvascular architecture in glioma. J Cereb Blood Flow Metab 2017;37(2):632-643.
3. Tropres I, Grimault S, Vaeth A, Grillon E, Julien C, Payen JF, Lamalle L, Decorps M. Vessel size imaging. Magnet Reson Med 2001;45(3):397-408.
4. Shen Y, Pu IM, Ahearn T, Clemence M, Schwarzbauer C. Quantification of venous vessel size in human brain in response to hypercapnia and hyperoxia using magnetic resonance imaging. Magn Reson Med 2013;69(6):1541-1552.
5. Hahn A, Bode J, Schuhegger S, Kruwel T, Sturm VJF, Zhang K, Jende JME, Tews B, Heiland S, Bendszus M, Breckwoldt MO, Ziener CH, Kurz FT. Brain tumor classification of virtual NMR voxels based on realistic blood vessel-induced spin dephasing using support vector machines. NMR Biomed 2022;35(4):e4307.
Figures