1376
A quantitative 2D time-of-flight (qTOF) MR angiography technique for measuring single-vessel blood flow and diameter1Department of Physics, Carleton University, Ottawa, ON, Canada, 2Department of Mechanical & Aerospace Engineering, Carleton University, Ottawa, ON, Canada, 3University of Ottawa Institute of Mental Health Research, Royal Ottawa Mental Health Centre, Ottawa, ON, Canada
Synopsis
Keywords: Blood Vessels, Blood vessels, Velocity & flow; Vessel size
Motivation: To address the gap in MRI techniques for assessing cerebral small vessels with slow flow non-invasively.
Goal(s): To develop a quantitative 2D time-of-flight (qTOF) technique for measuring blood velocity and the size of cerebral small vessels.
Approach: We developed an analytic qTOF framework to generate realistic TOF model images, which are optimized to match the acquired TOF images for extracting blood velocity and vessel size.
Results: The proposed qTOF framework was validated in simulation and phantom studies, and demonstrated in vivo. Incorporating a second acquisition improved blood velocity and vessel size estimation. Flow velocities were comparable to those measured by phase-contrast MRI.
Impact: A quantitative Time-of-Flight technique was developed to provide insights into blood flow and the size of cerebral small vessels, and dynamically in response to changing brain activity, helping to elucidate the role of cerebral small vessels in healthy brain function.
Introduction
Cerebral small vessels (<500-µm diameter) are critical for regulating blood flow and nutrient exchange across the brain. Cerebral small vessel dysfunction is associated with several neurological disorders1,2. However, little is known about cerebral small vessels owing to our limited ability to resolve them non-invasively with conventional imaging approaches3. Previously, single-slice phase-contrast (PC) MR angiography (MRA) was developed to measure blood velocity and the size of small vessels of human brains at 3T and 7T4,5 and to map stimulus-induced CBF responses in small vessels of rats6. Nevertheless, accurately estimating slow flows in PC-MRA requires prolonged flow-encoding modules, compromising the SNR and introducing BOLD contamination due to the increased echo-time. On the other hand, time-of-flight (TOF)-MRA offers higher SNR. Although it’s commonly used for visualizing vessel anatomy, TOF-MRA can convey flow information, as evidenced by blood flow measured in large arteries using TOF in mice7,8. Leveraging the TOF contrast, we developed a single-slice quantitative TOF (qTOF)-MRA technique for assessing blood flow and vessel size in small vessels. We tested the qTOF method in simulation, in a phantom, and in one healthy volunteer.Methods
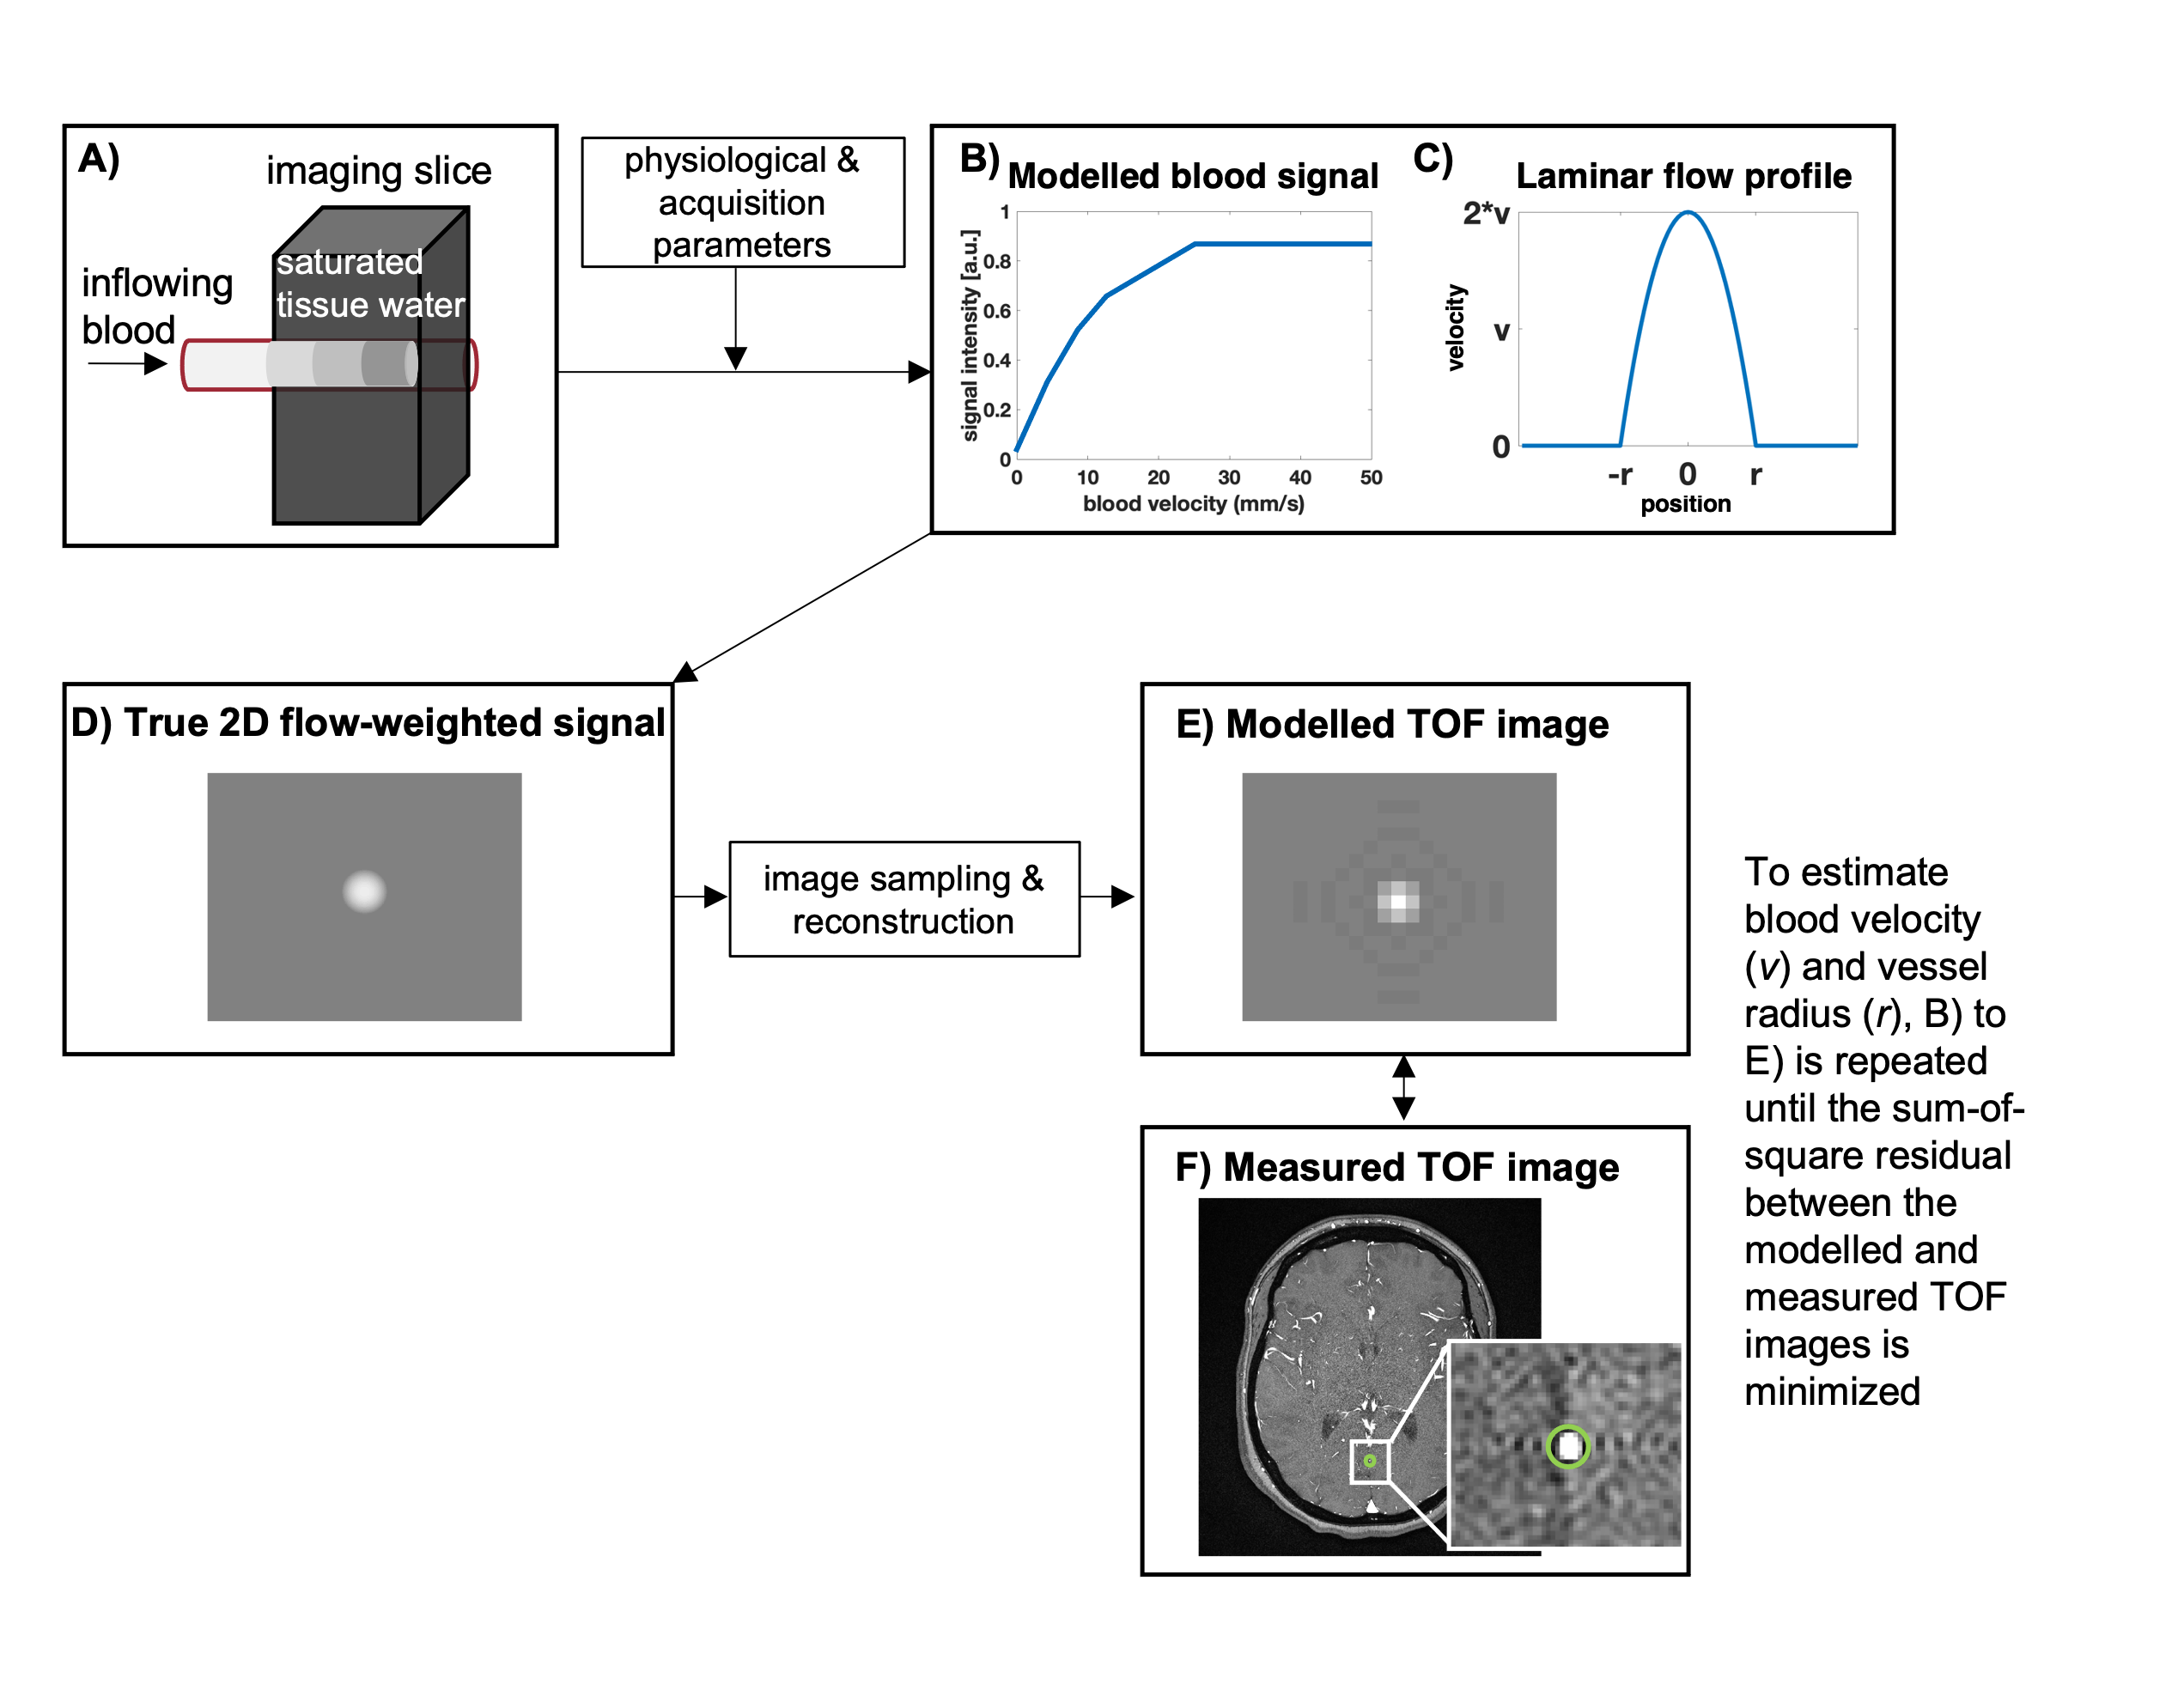
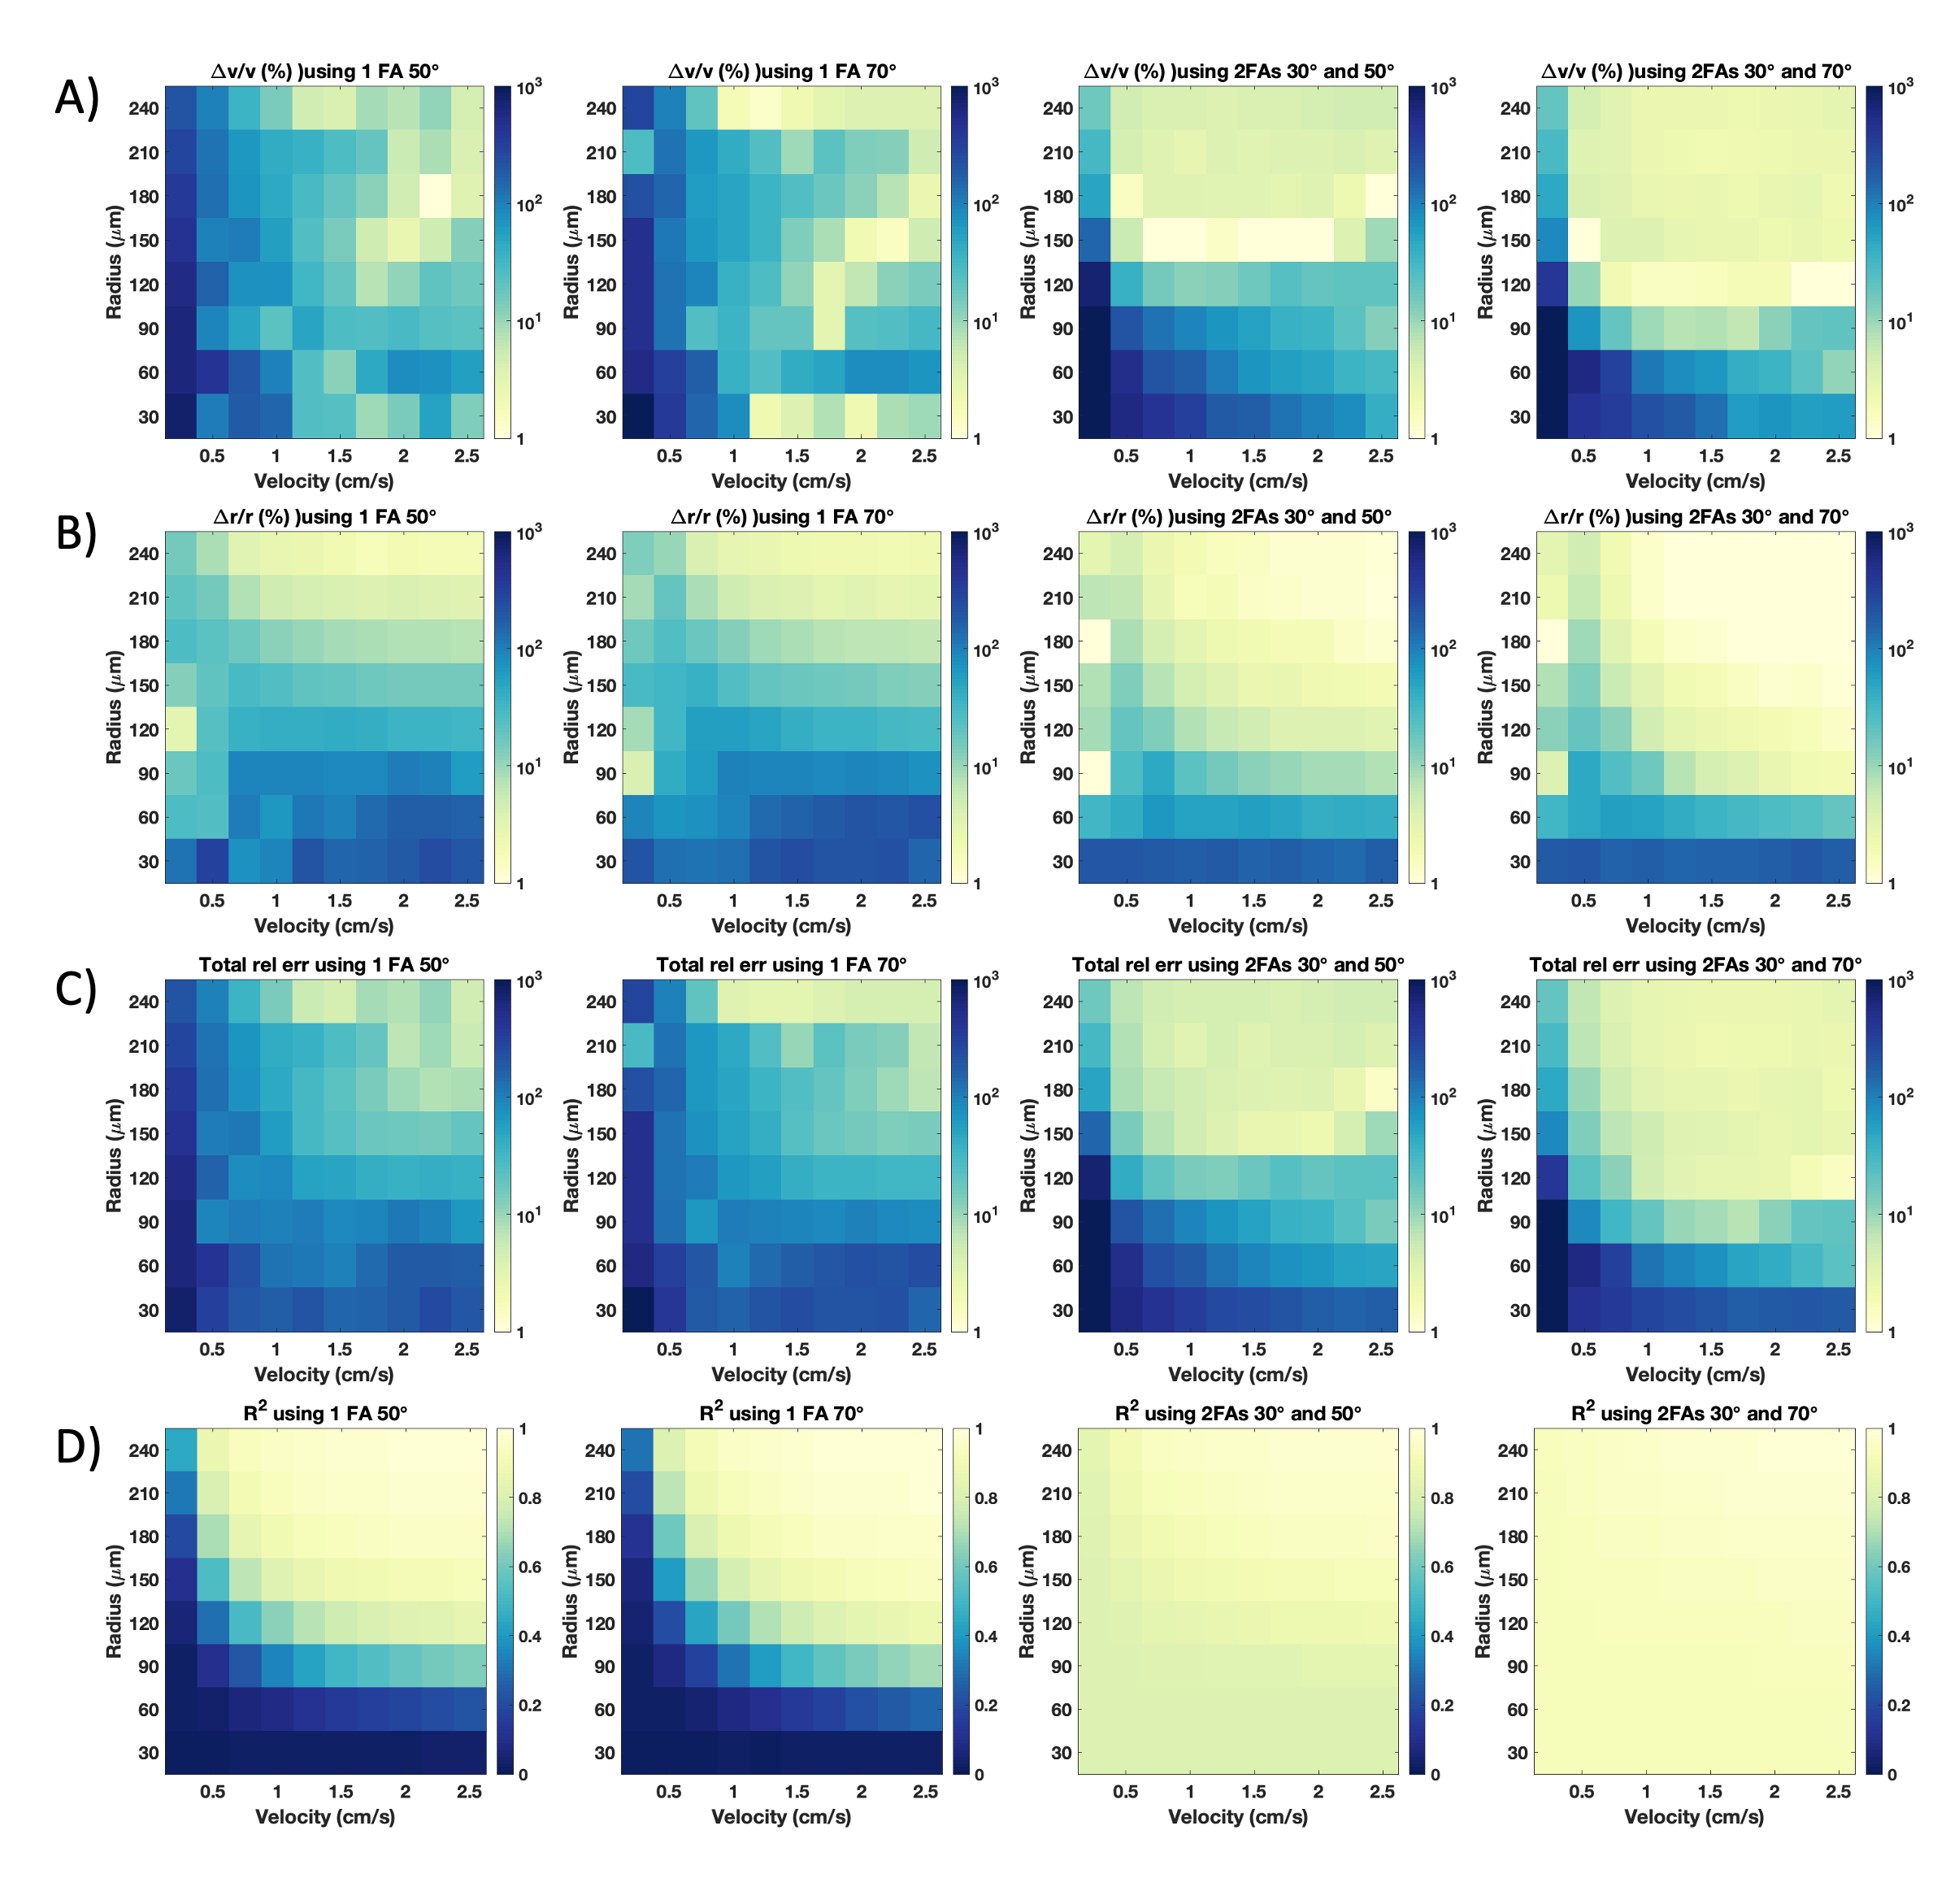
Using the flow-related signal enhancement of TOF-MRA7,8 we adapted an approach from PC-MRA4 to estimate the blood velocity (v) and vessel radius (r) using TOF images. Our qTOF framework models a single-vessel TOF image for extracting blood velocity and vessel radius from the acquired TOF image (Figure 1).Simulation studies: To validate the qTOF framework, TOF images of single vessels with varying radii and blood velocities were simulated with an SNR matching the phantom scan (see next). We then estimated velocities and radii using the qTOF framework and computed their relative errors. Moreover, given the inflow sensitivity to flip angle (FA), we investigated the impact of utilizing multiple acquisitions at varying FAs on the fitting accuracy.
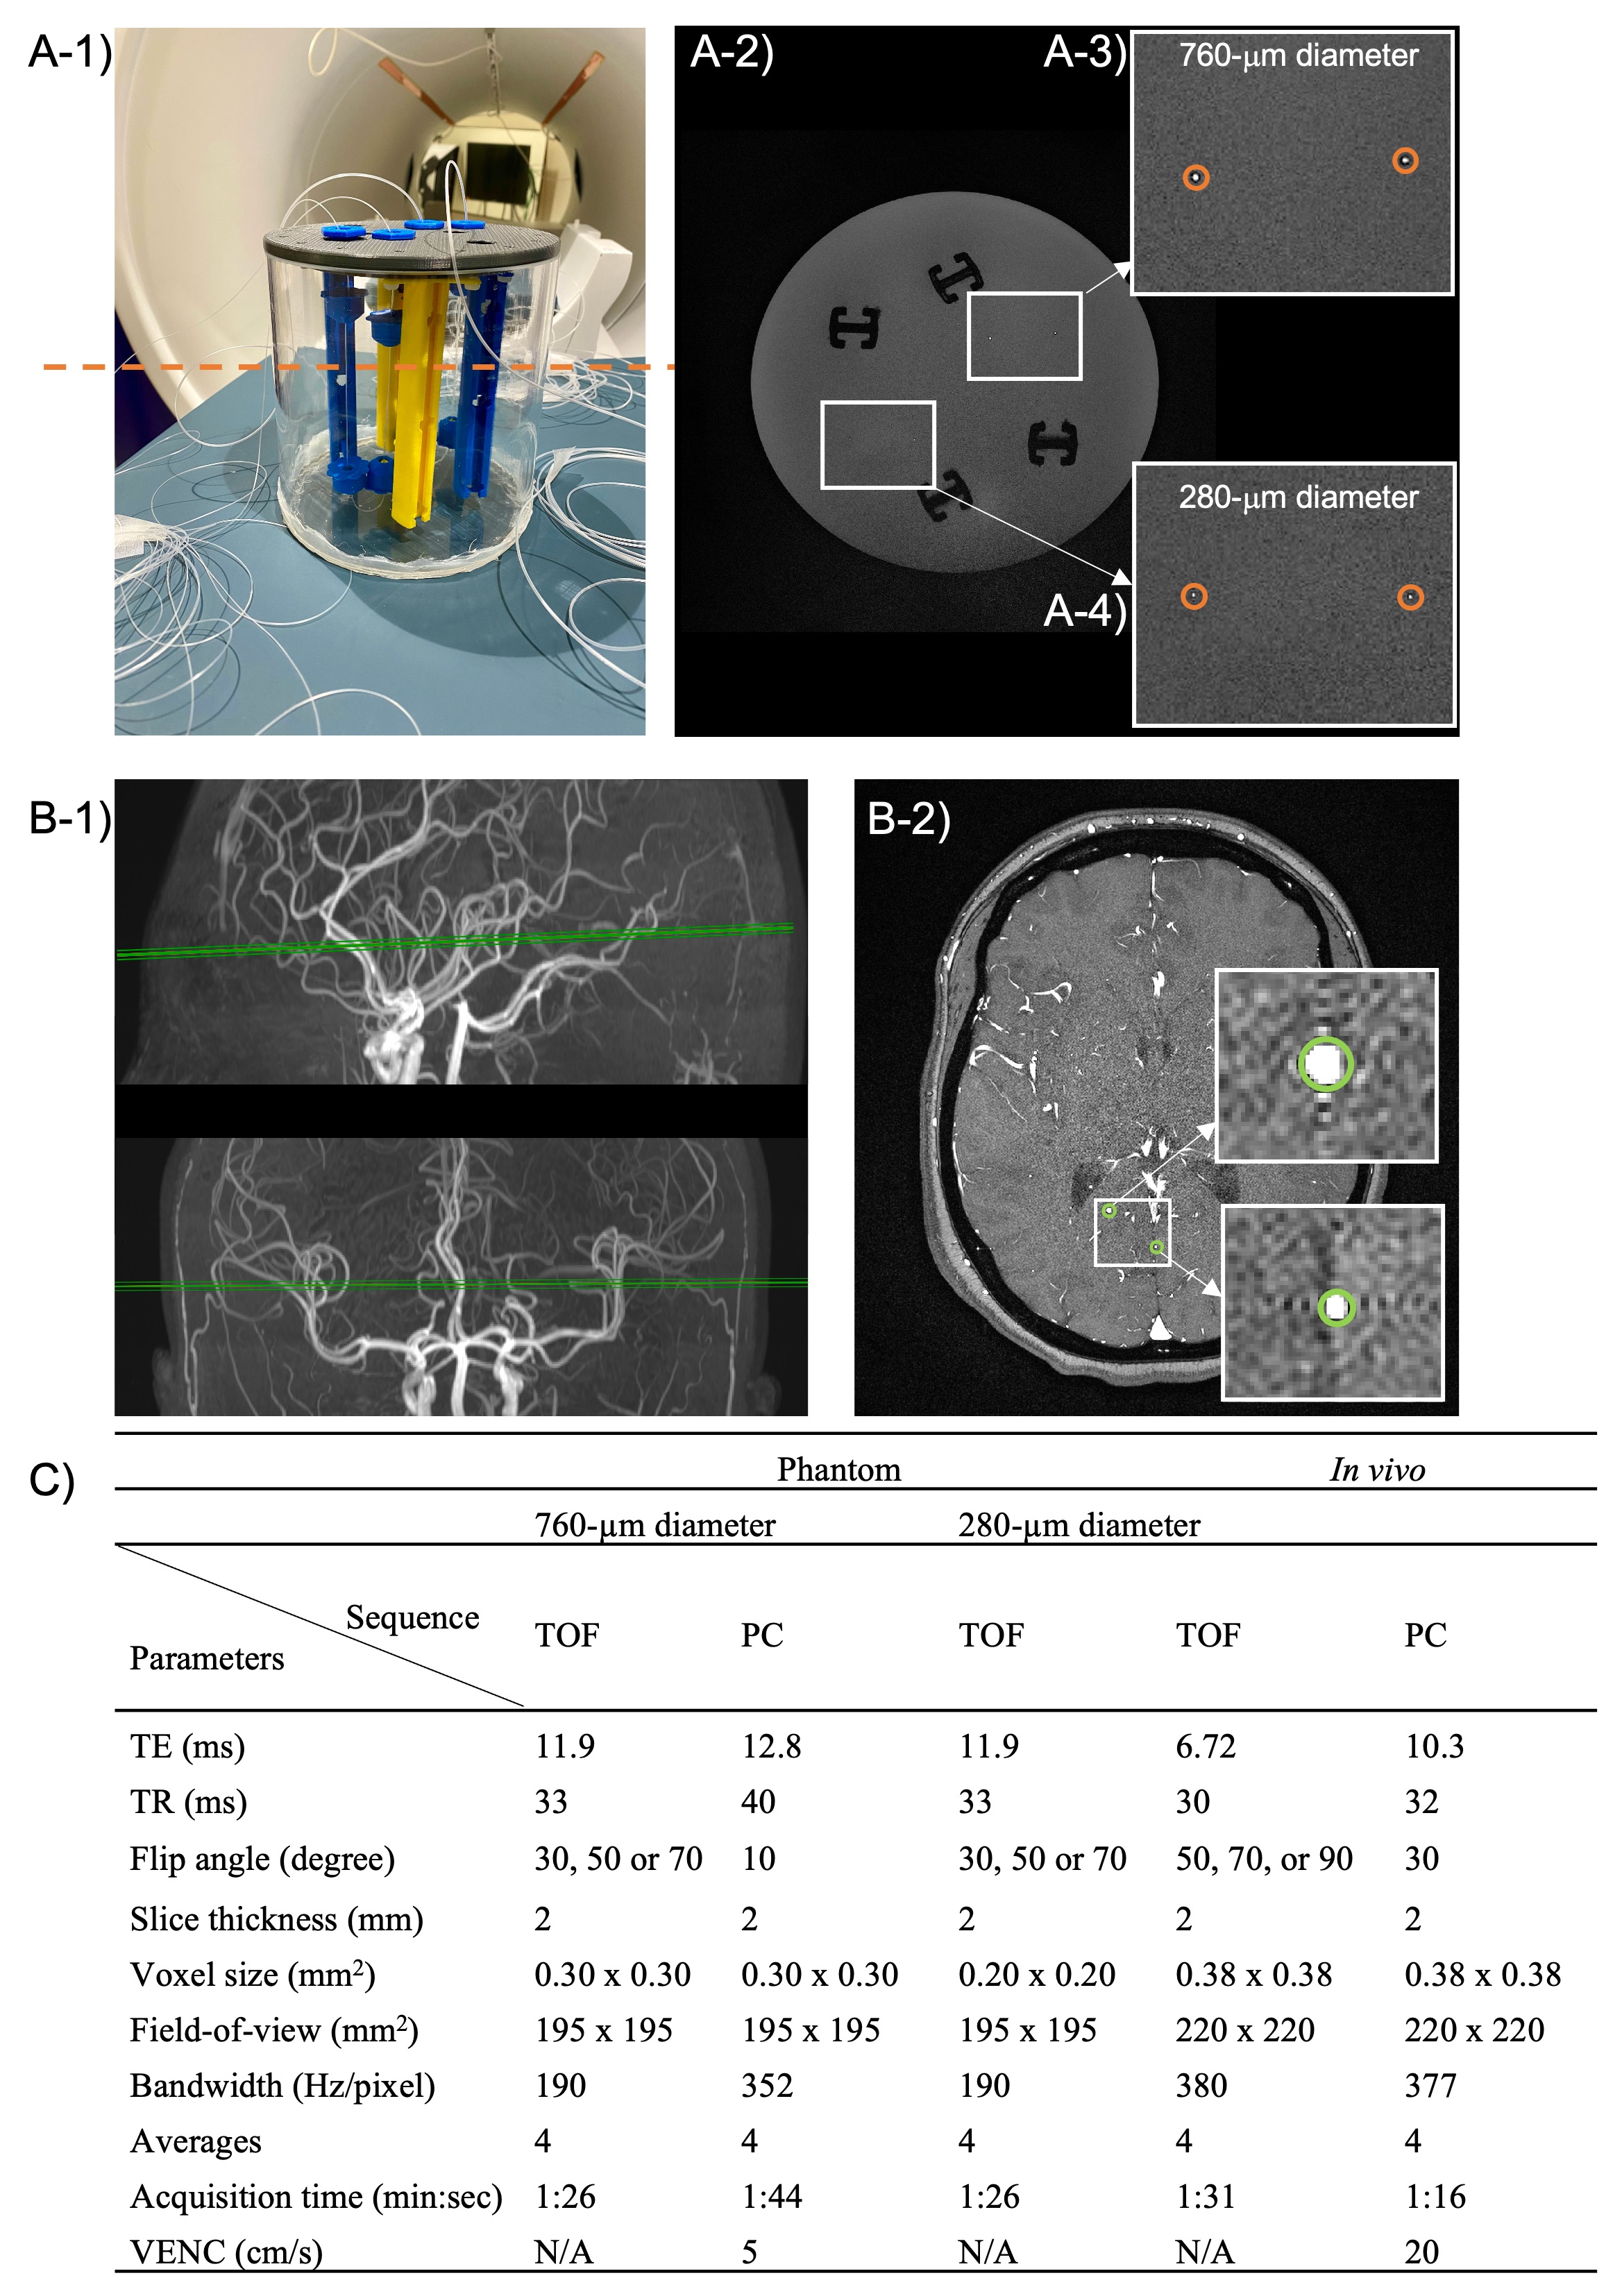
Phantom studies: We constructed a flow phantom for validation (Figure 2A). TOF and PC-MRA data were acquired in multiple tubing diameters and flow rates (Figure 2C). Flow velocities and tubing radii estimated from the qTOF framework were compared to the ground truth values as well as the velocities measured from PC-MRA.
In vivo studies: One healthy volunteer (female, 23-year-old) was scanned with TOF and PC-MRA (Figure 2B, C) for assessing blood flow and radii in cerebral vessels.
Results
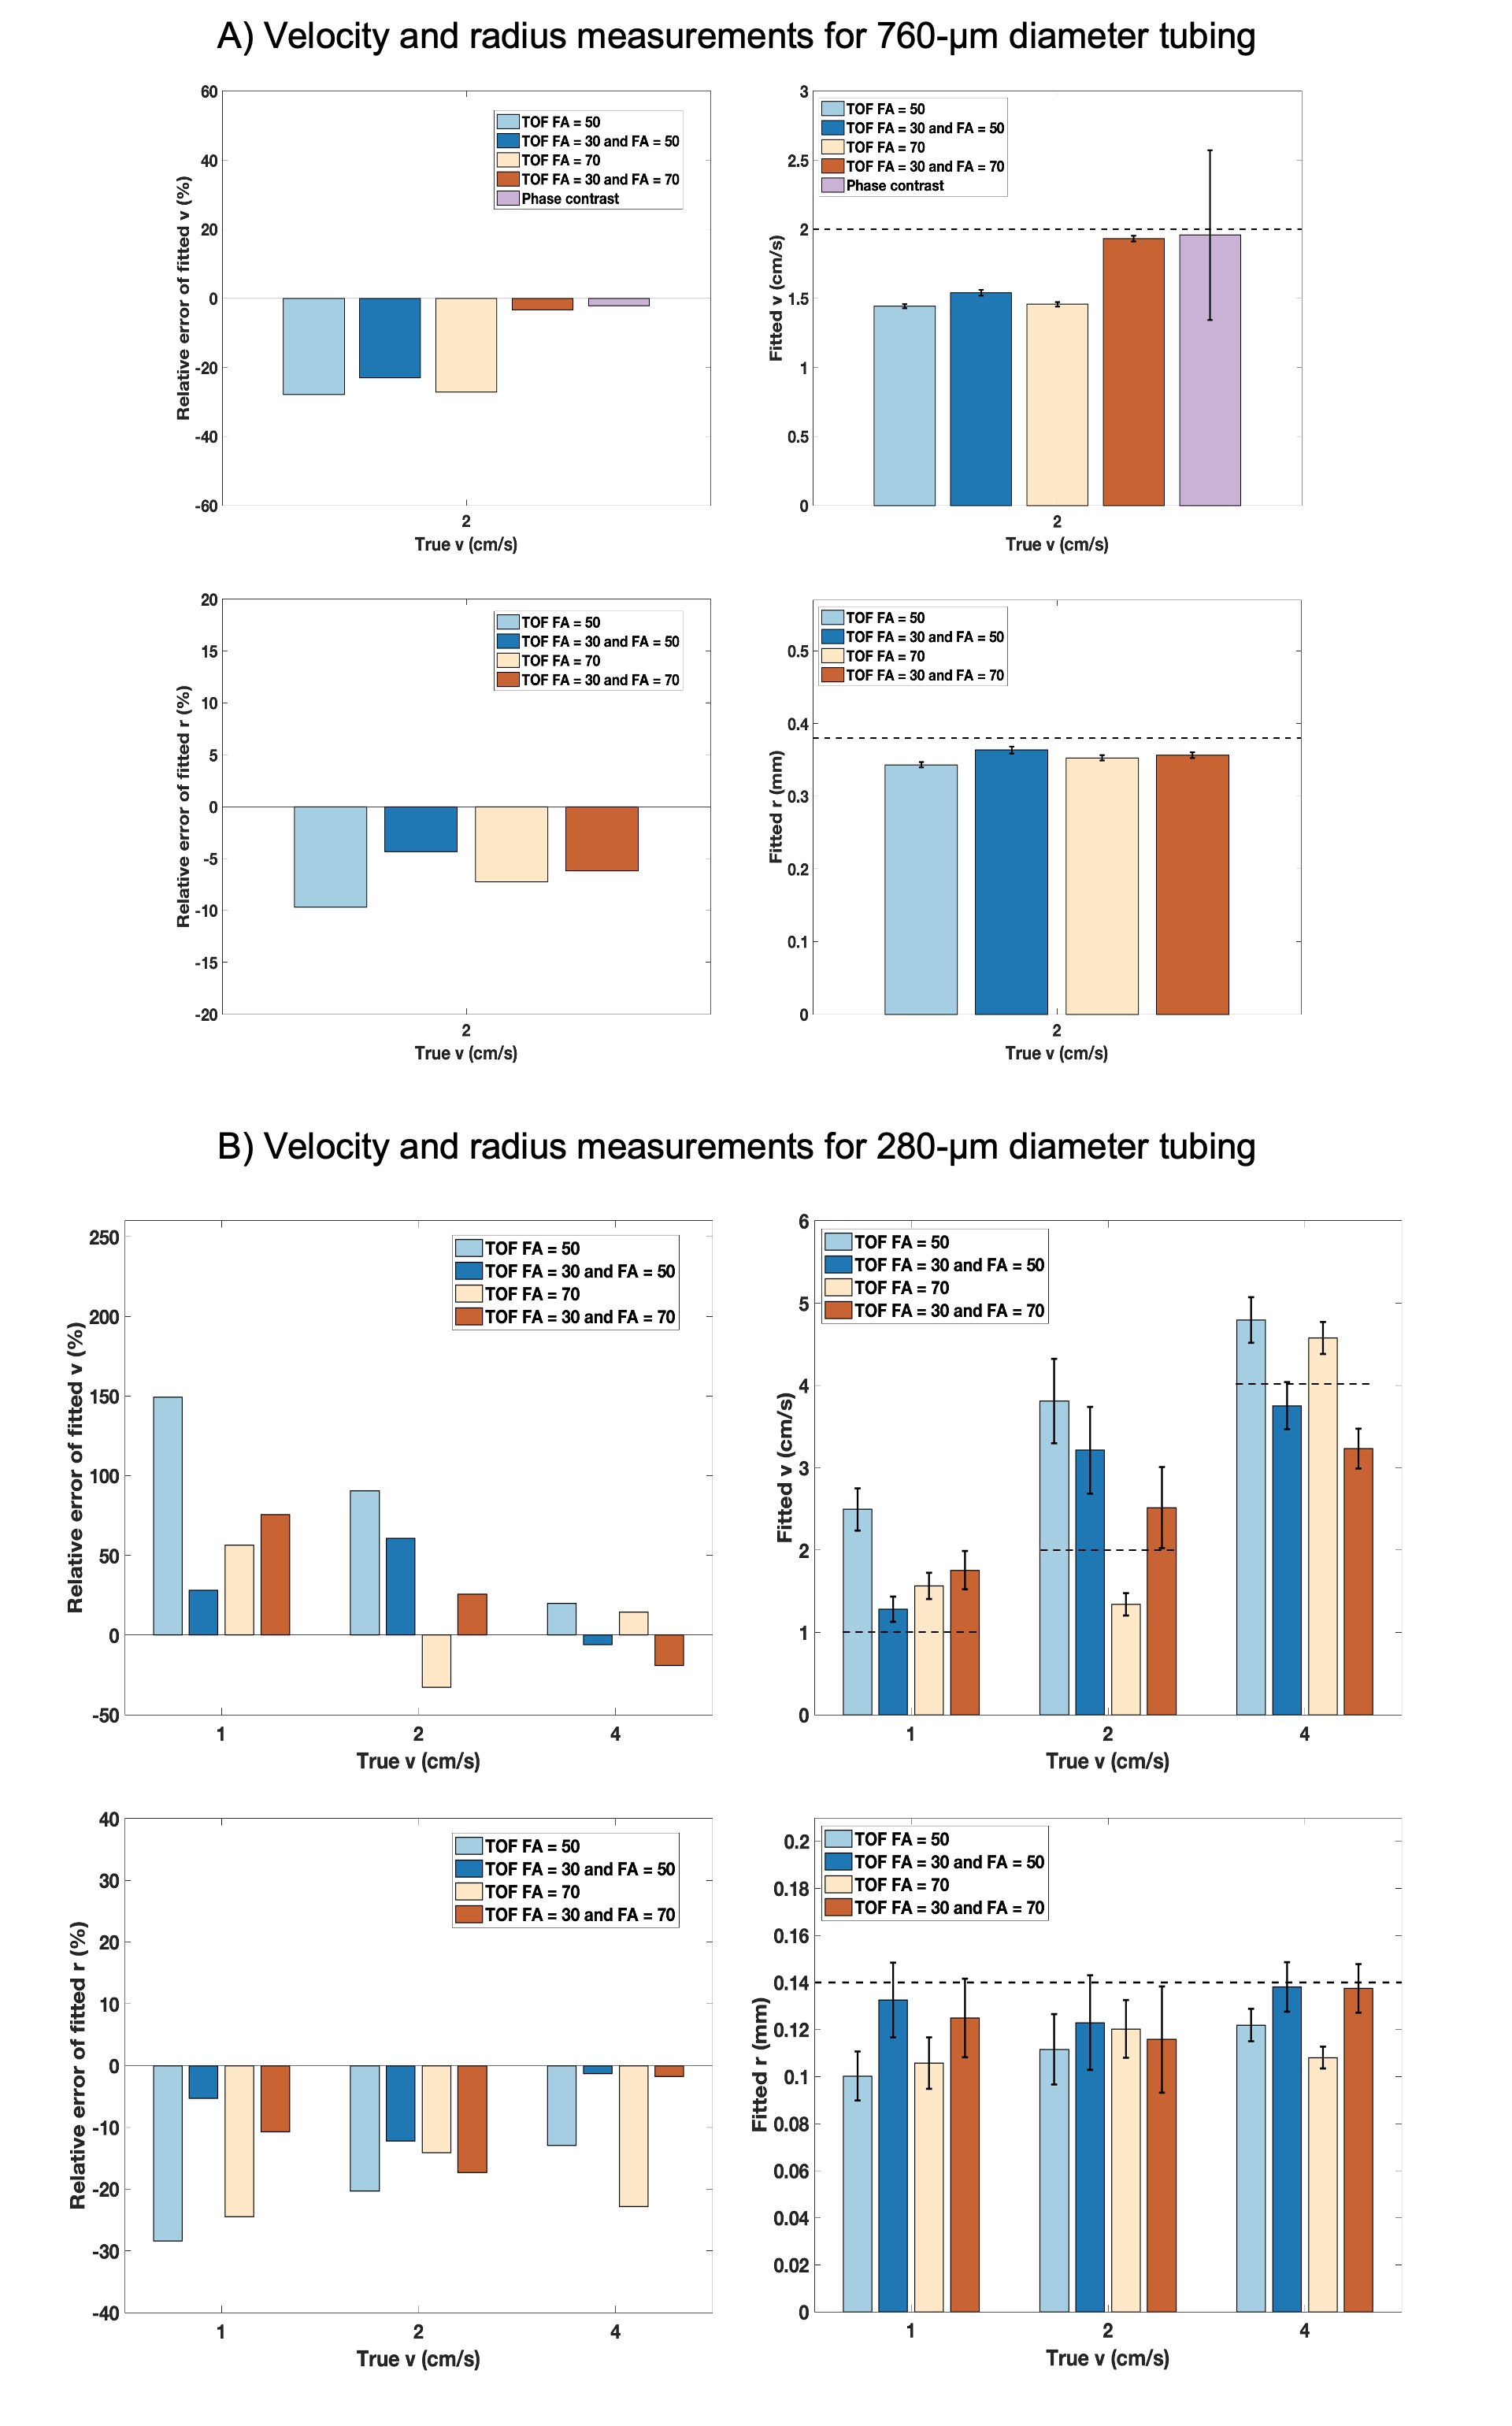
Simulation studies: qTOF framework can extract velocity and radius from blood vessels (Figure 3). As expected, relative errors of fitted velocity and radius decreased with increasing actual velocity and radius owing to the enhanced flow signal and reduced partial volume effect, respectively. Jointly fitting two separate acquisitions with FA=30°&50° improved the fitting accuracy, especially when vessel diameters were greater than the in-plane voxel size (>300 mm). Employing more widely spaced FA=30°&70° further reduced fitting errors for radii down to 90-mm and velocities down to 1.25 cm/s.Phantom studies: The qTOF-estimated velocities and radii were in good agreement with the ground-truth values (Figure 3); velocity measured in 760-mm tubing using two-FA acquisition (30°&70°) was not statistically different compared with that from PC-MRA (P=0.67, Figure 4A top row), yet qTOF offers higher SNR (10 vs 2, calculated from magnitude images). Furthermore, qTOF was able to measure velocity and radius in 280-mm tubing (Figure 3B). The PC data in 280-mm tubing were too noisy to be analyzed.
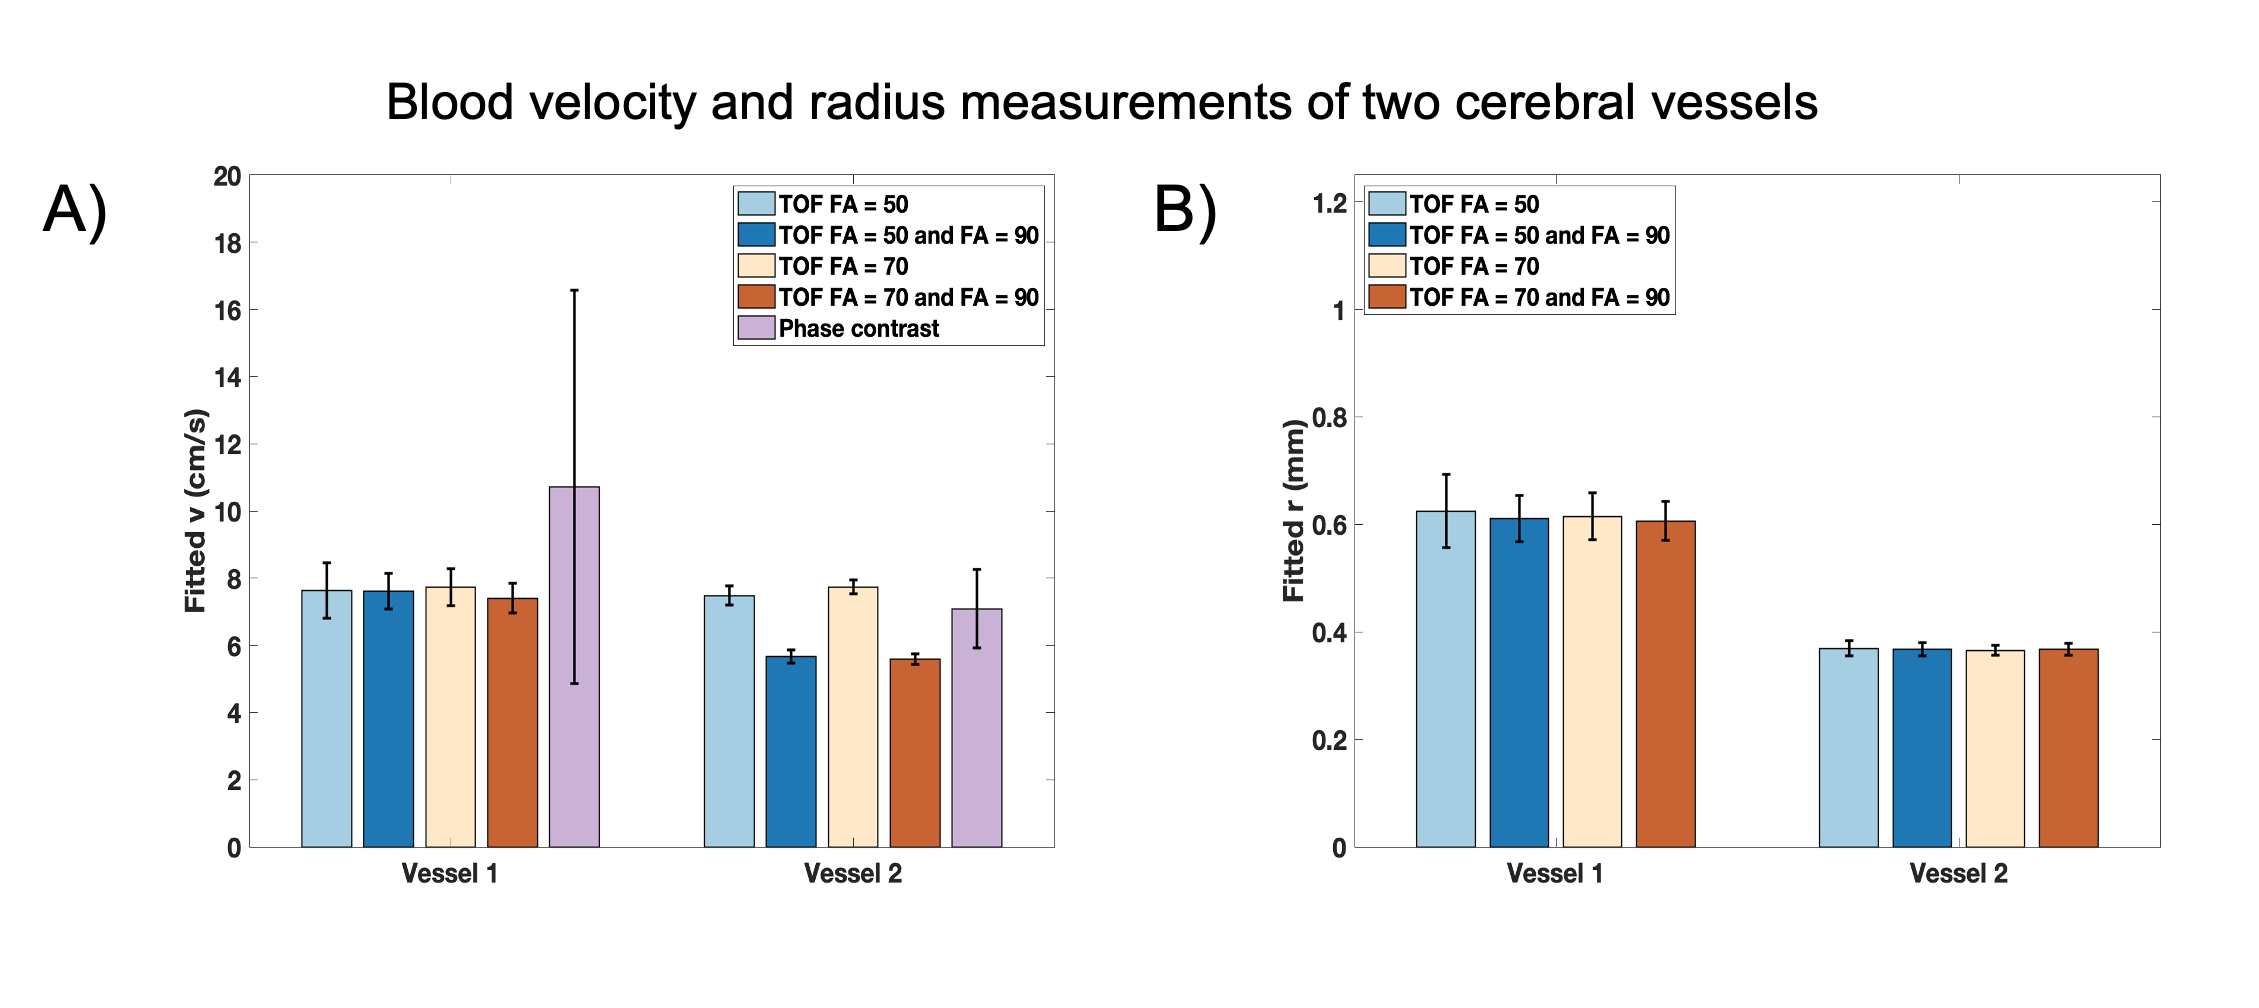
In vivo studies: Two small posterior vessels were identified on TOF and PC-MRA images (Figure 2B-2). Velocities and vessel radii were quantified employing one or two FAs for qTOF analysis (Figure 5). Observed biases (~26-44%) in measured velocities from qTOF and PC-MRA were likely caused by an experimental limitation where differing slice prescriptions were used.
Discussion and conclusion
Our proposed qTOF framework was validated in simulation and phantom experiments, and demonstrated in vivo. Incorporating two acquisitions improved the accuracy for quantifying both the velocity and tubing size in the flow phantom. Although there existed discrepancies between measured velocity assessed by PC-MRA and qTOF in vivo, qTOF offers superior SNR as compared to PC-MRA. Future work will focus on improving the accuracy of the technique in vivo and comparing it to the advanced PC-MRA method4, as well as evaluating flow and diameter changes of small vessels during functional activation9. The qTOF-MRA framework presents a promising avenue for robustly assessing blood flow and the size of cerebral small vessels. This technique can provide insights into morphological and functional properties of cerebral small vessels in health and disease, at baseline and in response to changing brain activities, addressing the scarcity of data on how vascular parameters change in human cerebral small vessels upon brain activation9.Acknowledgements
We would like to thank Katie Dinelle and Dr. Reggie Taylor for their help with the phantom experiments, Dr. Tong Xu and the MacOdrum Library 3D printing team at Carleton University for 3D printing support, Jason Anstey and Nick Burrill for phantom construction support, and the Digital Research Alliance of Canada (alliance.can.ca) for providing the computational resources. This work was supported in part by the NSERC postdoctoral fellowship (#578195-2023), Carleton University, and the University of Ottawa Institute of Mental Health Research.
References
1. Smith EE, O'Donnell M, Dagenais G, Lear SA, Wielgosz A, Sharma M, Poirier P, Stotts G, Black SE, Strother S, Noseworthy MD, Benavente O, Modi J, Goyal M, Batool S, Sanchez K, Hill V, McCreary CR, Frayne R, Islam S, DeJesus J, Rangarajan S, Teo K, Yusuf S, Investigators P. Early cerebral small vessel disease and brain volume, cognition, and gait. Ann Neurol 2015;77(2):251-261.
2. Huang P, Chen K, Liu C, Zhen Z, Zhang R. Visualizing cerebral small vessel degeneration during aging and diseases using magnetic resonance imaging. J Magn Reson Imaging 2023;58(5):1323-1337.
3. Gurol ME, Biessels GJ, Polimeni JR. Advanced neuroimaging to unravel mechanisms of cerebral small vessel diseases. Stroke 2020;51(1):29-37.
4. Zong X, Lin W. Quantitative phase contrast MRI of penetrating arteries in centrum semiovale at 7T. Neuroimage 2019;195:463-474.
5. Arts T, Meijs TA, Grotenhuis H, Voskuil M, Siero J, Biessels GJ, Zwanenburg J. Velocity and pulsatility measures in the perforating arteries of the basal ganglia at 3T MRI in reference to 7T MRI. Front Neurosci 2021;15:665480.
6. Chen X, Jiang Y, Choi S, Pohmann R, Scheffler K, Kleinfeld D, Yu X. Assessment of single-vessel cerebral blood velocity by phase contrast fMRI. PLoS Biol 2021;19(9):e3000923.
7. Wagner S, Helisch A, Bachmann G, Schaper W. Time-of-flight quantitative measurements of blood flow in mouse hindlimbs. J Magn Reson Imaging 2004;19(4):468-474.
8. Miraux S, Franconi JM, Thiaudiere E. Blood velocity assessment using 3D bright-blood time-resolved magnetic resonance angiography. Magn Reson Med 2006;56(3):469-473.
9. Bizeau A, Gilbert G, Bernier M, Huynh MT, Bocti C, Descoteaux M, Whittingstall K. Stimulus-evoked changes in cerebral vessel diameter: A study in healthy humans. J Cereb Blood Flow Metab 2018;38(3):528-539.
Figures