1373
Locally Adaptive Low Rank Regularization with Collaborative Data Selection for Arterial Spin Labeling MRI Denoising1University of Maryland School of Medicine, Baltimore, MD, United States, 2Perelman School of Medicine, University of Pennsylvania, Philadelphia, PA, United States
Synopsis
Keywords: Sparse & Low-Rank Models, Arterial spin labelling, Denoising, MRI
Motivation: Address the challenge of low SNR in arterial spin labeling (ASL) MRI that hinders its clinical and research potential.
Goal(s): Develop an advanced ASL denoising algorithm that enhances image quality and overcomes limitations in ASL due to low SNR.
Approach: Propose a Locally Adaptive low rank regularization with Collaborative data Selection (LACS) scheme that utilizes the structural characteristics of ASL images for collaborative data selection to improve low-rank modeling. The proposed low-rank regularization fundamentally performs locally adaptive PCA without explicit training.
Results: Using a single ASL image pair, LACS significantly outperformed state-of-the-art MRI denoising methods and the standard pipeline.
Impact: The proposed scheme has the potential to benefit researchers, clinicians, and patients by setting a new benchmark for ASL MRI denoising. It opens doors to exploring ASL's full clinical potential and offers opportunities for innovative research.
Introduction
Arterial spin labeling (ASL) is a non-invasive and non-ionizing perfusion MRI technique for measuring cerebral blood flow (CBF)1-5. While ASL has been increasingly adopted in various clinical research, its full value is still hindered by the inherently low signal-to-noise-ratio (SNR) caused by the limited amount of labeled arterial blood water. Many denoising methods have been proposed but mainly focusing on the mean ASL CBF maps rather than the single pair of label (L) and control (C) ASL images. The purpose of this study was to develop an advanced ASL denoising algorithm that can improve image quality for a single pair of L/C ASL images to either substantially reduce the total data acquisition time or to make the ASL CBF images reliable for time series analysis.Methods
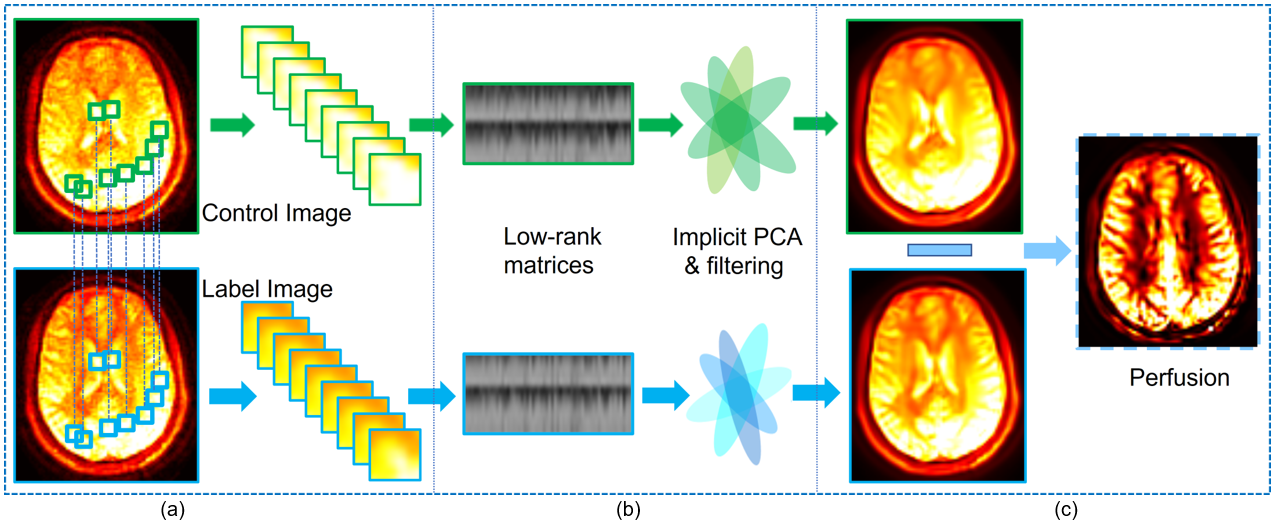
This abstract presents a Locally Adaptive low rank regularization with a Collaborative data Selection (LACS) scheme, which takes advantage of the structural characteristics of ASL images to select data for low-rank regularization. The novelty of LACS is two-fold: 1) collaborative data selection for more robust low-rank modeling; 2) locally adaptive low-rank regularization that corresponds to efficient signal-adaptive sparse representation without explicit training. The overall framework of LACS is shown in Fig. 1.Since principled data selection is crucial for the effectiveness of low-rank and sparse image modeling6, LACS uses a collaborative low-rank data selection process motivated by the high similarity between the paired L/C images. We implemented the data selection through a joint distance based patch selection. Suppose the vectorized version of the $$$s\times s$$$ patch at location $$$i$$$ in the label image is $$$\mathbf{p}_L(i)\in\mathbb{R}^{s^2}$$$ and that in the control image is $$$\mathbf{p}_c(i)$$$, the joint Euclidean distance between patches $$$\mathbf{p}(i)$$$ and $$$\mathbf{p}(j)$$$ is calculated by $$d(i,j)=\frac{1}{2s^2}(‖\mathbf{p}_L (i)-p_L (j)‖_2^2+‖\mathbf{p}_C (i)-\mathbf{p}_C (j)‖_2^2).$$
In this way, the overall errors in the distances caused by noise could be reduced. The coordinates with smallest distances are included in the $$$i$$$-th set of similar patches $$$\mathbb{S}_i$$$, which is shared by both $$$\mathbf{p}_L(i)$$$ and $$$\mathbf{p}_c(i)$$$. Then the potentially low-rank matrices extracted from the label image are formed by concatenating the vectorized overlapping patches: $$X_L (i)=[\mathbf{p}_L (\mathbb{S}_i (1)),\mathbf{p}_L (\mathbb{S}_i (2)),… \mathbf{p}_L (\mathbb{S}_i (N))]∈\mathbb{R}^{s^2×N}.$$
Those from the control image $$$X_C(i)$$$ are formed in the same way. Due to the differences in regional intensities that are informative in ASL, $$$X_L(i)$$$ and $$$X_C(i)$$$ are denoised separately to better preserve such information. Since the L/C images are treated independently after the data selection stage, we can omit the subscripts $$$L$$$ and $$$C$$$, and denote $$$X(i)$$$ by $$$X_i$$$ for simplicity. Let $$$\mathbf{x}∈\mathbb{R}^{H×W}$$$ denote a latent noise-free slice and $$$\mathbf{y}$$$ be the corresponding noisy observation, the slice-wise restoration is summarized in the objective function: $$\mathbf{\tilde{x}}=\arg\min_\mathbf{x}\sum_i\log|X_i X_i^T| +\frac{1}{2\beta}‖\mathbf{x}-\mathbf{y}‖_F^2.$$ Here $$$\beta$$$ is decided by the noise level, which means that heavier noise leads to less contribution from the observation to the estimate $$$\mathbf{\tilde{x}}$$$.
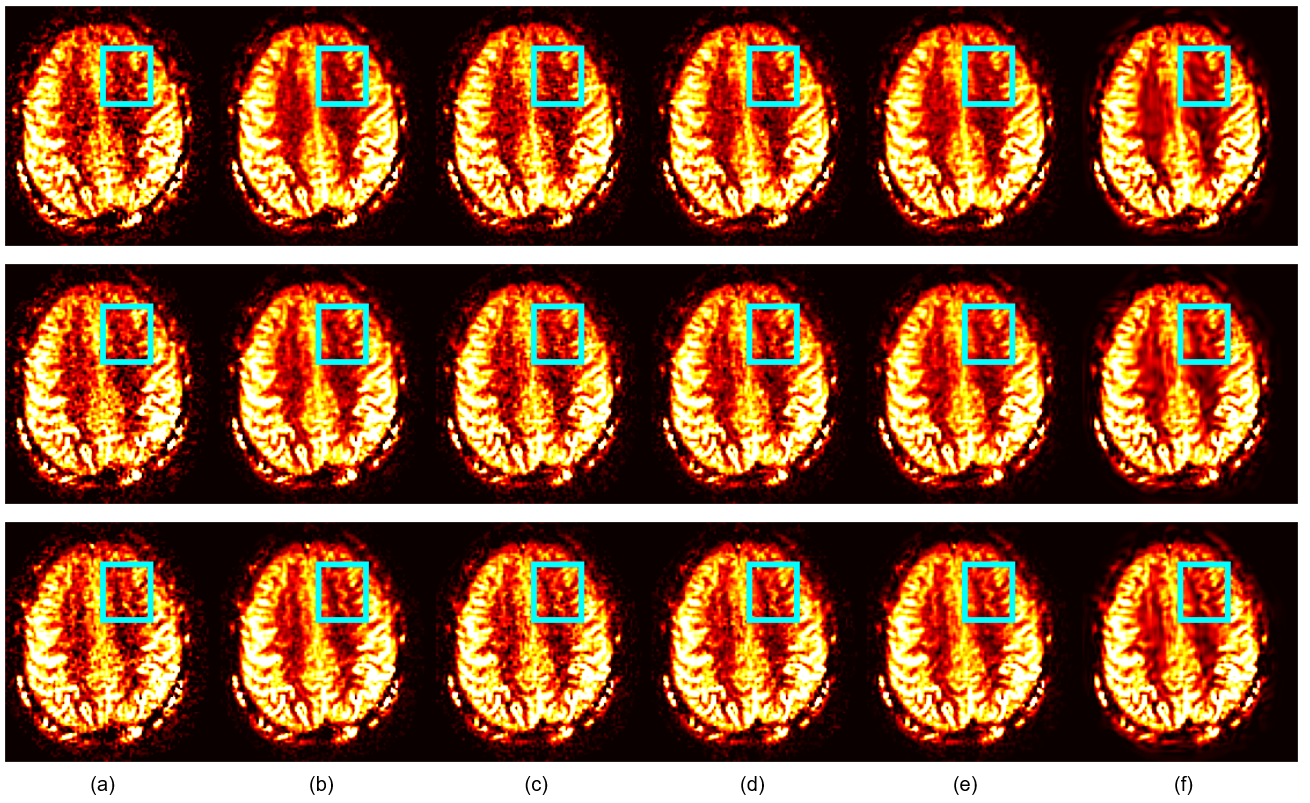
To test the performance, 16 MRI scans were collected using a 3T whole-body system. A three-dimensional pseudo-continuous ASL (pCASL) sequence7,8 was used to magnetically label arterial blood water with 10 repetition. We compared LACS with several typical and state-of-the-art denoising methods in the field, including Marchenko-Pastur principle component analysis (MPPCA)9, tensor MPPCA (tMPPCA)10, non-local means combined with dual-tree complex wavelet transform (DTCWT)11 and the standard pipeline of taking the average of multiple measurements. DTCWT, MPPCA, tMPPCA and LACS used the first pair of L/C images, while the standard pipeline takes all the available pairs as input.
Results
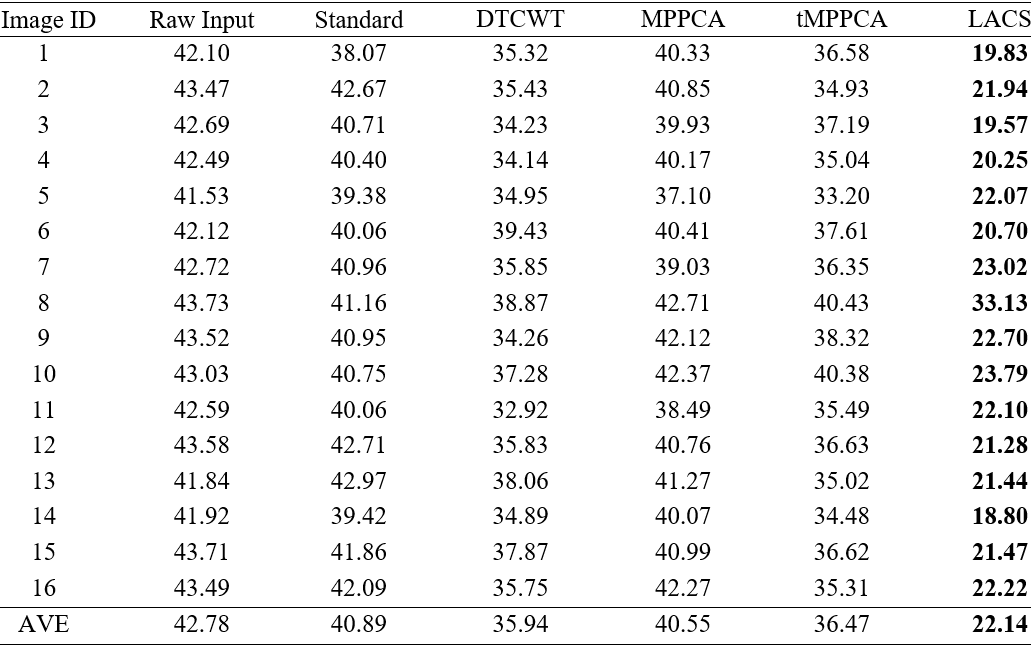
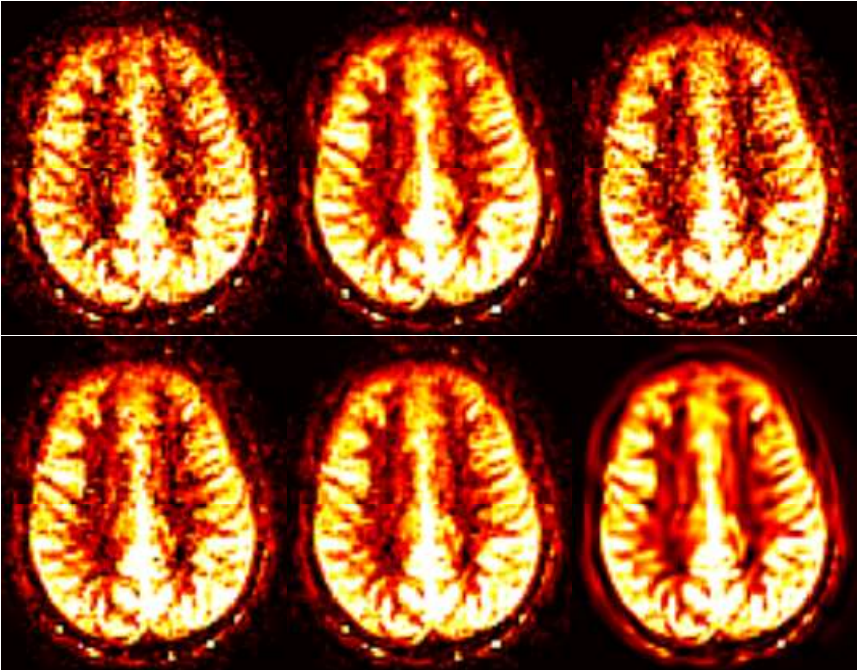
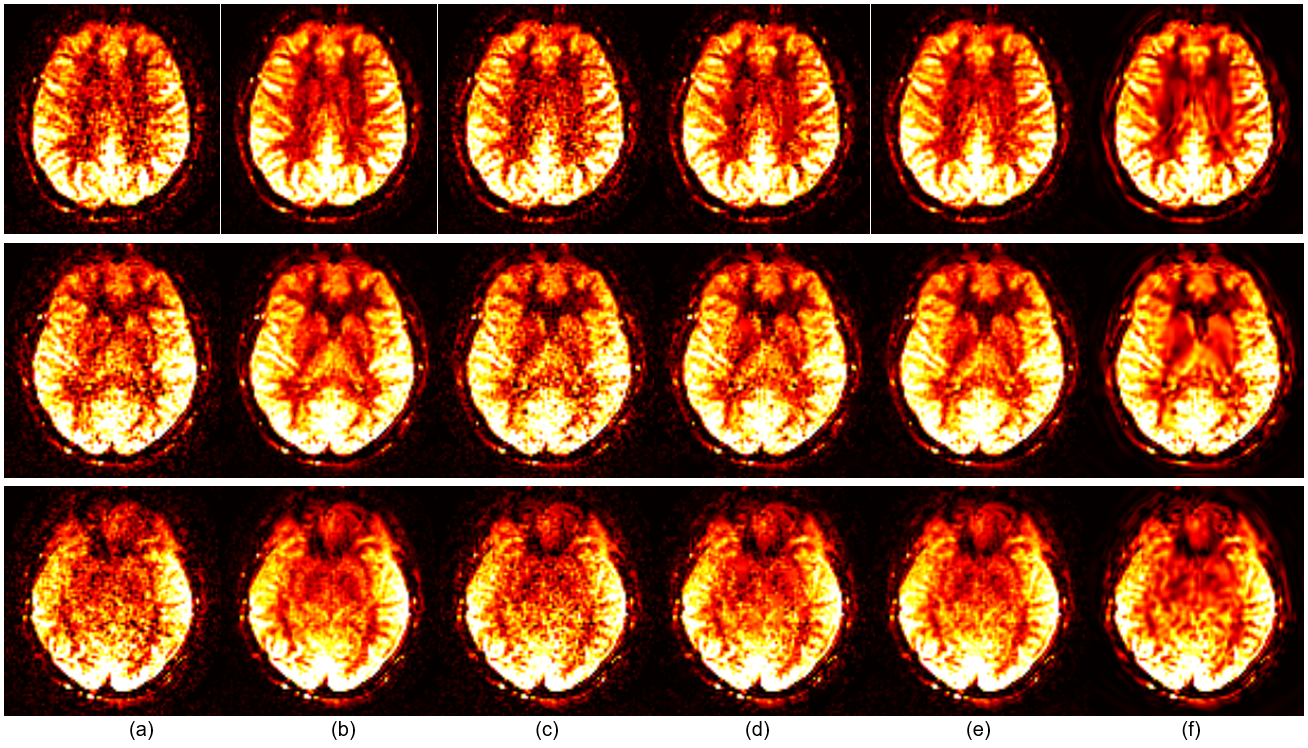
Since ground truth is not available, we used the no-reference image quality score named blind/referenceless image spatial quality evaluator (BRISQUE)12 to test the denoising algorithms. A smaller BRISQUE score indicates better image quality. As shown in Table 1, LACS significantly reduced BRISQUE in all the cases. Such evident improvement was in line with the visual quality, as shown in Fig. 2~4.Discussion and Conclusion
Through simultaneously enforcing a low-rank property and constraining the data consistency, LACS outperforms several state-of-the-art MRI denoising methods. It achieves significantly better image quality using one single pair of L/C images compared with the standard pipeline that requires multiple pairs. Currently we only consider a single L/C pair from the multi-coil combined scanner output. Indeed, LACS can be further improved in the future by incorporating the across L/C image pair and across MRI receive coil correlations-induced low-rank properties. The inter-slice dependency can also be incorporated though at the cost of increased computational complexity. Although LACS is proposed for denoising ASL, the same concept can be extended to denoise diffusion MRI, fMRI etc.Acknowledgements
This study was supported in part by National Institutes of Health grants: R01AG060054, R01AG070227, R01EB031080-01A1, R21AG08243, R21AG080518, 5 P41EB029460-01A1, and 1UL1TR003098. Hangfan Liu is supported in part by William H. Gates Sr. Fellowship from the AD Data Initiative.References
1. Detre, J.A., Leigh, J.S., Williams, D.S. & Koretsky, A.P. Perfusion imaging. Magnetic Resonance in Medicine 23, 37-45 (1992).
2. Williams, D.S., Detre, J.A., Leigh, J.S. & Koretsky, A.P. Magnetic resonance imaging of perfusion using spin inversion of arterial water. Proceedings of the National Academy of Sciences 89, 212-216 (1992).
3. Detre, J.A., Wang, J., Wang, Z. & Rao, H. Arterial spin-labeled perfusion MRI in basic and clinical neuroscience. Current Opinion in Neurology 22, 348-355 (2009).
4. Fernández‐Seara, M.A., et al. Imaging mesial temporal lobe activation during scene encoding: comparison of fMRI using BOLD and arterial spin labeling. Human Brain Mapping 28, 1391-1400 (2007).
5. Chang, Y.V., Vidorreta, M., Wang, Z. & Detre, J.A. 3D‐accelerated, stack‐of‐spirals acquisitions and reconstruction of arterial spin labeling MRI. Magnetic Resonance in Medicine 78, 1405-1419 (2017).
6. Liu, H., Zhang, J. & Xiong, R. CAS: Correlation adaptive sparse modeling for image denoising. IEEE Transactions on Computational Imaging 7, 638-647 (2021).
7. Vidorreta, M., et al. Comparison of 2D and 3D single-shot ASL perfusion fMRI sequences. Neuroimage 66, 662-671 (2013).
8. Vidorreta, M., et al. Whole-brain background-suppressed pCASL MRI with 1D-accelerated 3D RARE Stack-Of-Spirals readout. PLOS ONE 12, e0183762 (2017).
9. Veraart, J., Fieremans, E. & Novikov, D.S. Diffusion MRI noise mapping using random matrix theory. Magnetic Resonance in Medicine 76, 1582-1593 (2016).
10. Olesen, J.L., Ianus, A., Østergaard, L., Shemesh, N. & Jespersen, S.N. Tensor denoising of multidimensional MRI data. Magnetic Resonance in Medicine 89, 1160-1172 (2023).
11. Liang, X., Connelly, A. & Calamante, F. Voxel-wise functional connectomics using arterial spin labeling functional magnetic resonance imaging: the role of denoising. Brain Connectivity 5, 543-553 (2015).
12. Mittal, A., Moorthy, A.K. & Bovik, A.C. No-reference image quality assessment in the spatial domain. IEEE Transactions on Image Processing 21, 4695-4708 (2012).
Figures