1363
Effects of Diffusion Time-dependent Tractography Focused on Skeletal Muscles1Tokyo Metropolitan University, Tokyo, Japan, 2RIKEN Center for Brain Science, Saitama, Japan
Synopsis
Keywords: Tractography, Diffusion Tensor Imaging
Motivation: In the skeletal muscles, the effects of varying diffusion times have rarely been investigated, and to what extent they are affected is unclear.
Goal(s): This study aimed to determine the effect of diffusion time on skeletal muscle delineation and anisotropy.
Approach: Tensor analysis and tractography measurements were performed on the hind legs of mice to investigate the relationship between diffusion time and myofiber delineation and anisotropy in skeletal muscles.
Results: Longer diffusion times allowed us to assess diffusion movements within muscle fibers and capture the precise organization of the skeletal muscles.
Impact: The effect of varying diffusion times on skeletal muscle myofibers was clarified. The results suggested that this method could be applied to human skeletal muscles for the examination of intramuscular tissues.
Introduction
Diffusion tensor images (DTI), which represent anisotropy, are widely used in research because they allow noninvasive investigation of fiber structures in nerve tissues and muscles.1 Recently, the diffusion time (DT) dependence of DTI has attracted much attention. Extending the DT allows water molecules to be tracked for longer periods and an accurate evaluation of the limiting diffusion structure.2 Tractography is also a well-known technique for viewing fiber structure runs using DTI and is characterized by its ability to easily capture visual fiber runs. Tractography can visualize thin or branched nerves in the cranial nerves and myofiber migration in skeletal muscles.3, 4 Tractography was reported not only in human studies but also in experimental animals.5 However, the effect of varying the DT on skeletal muscle tractography has not been investigated comprehensively, and its influence on the visualization of fiber migration is unknown.Methods
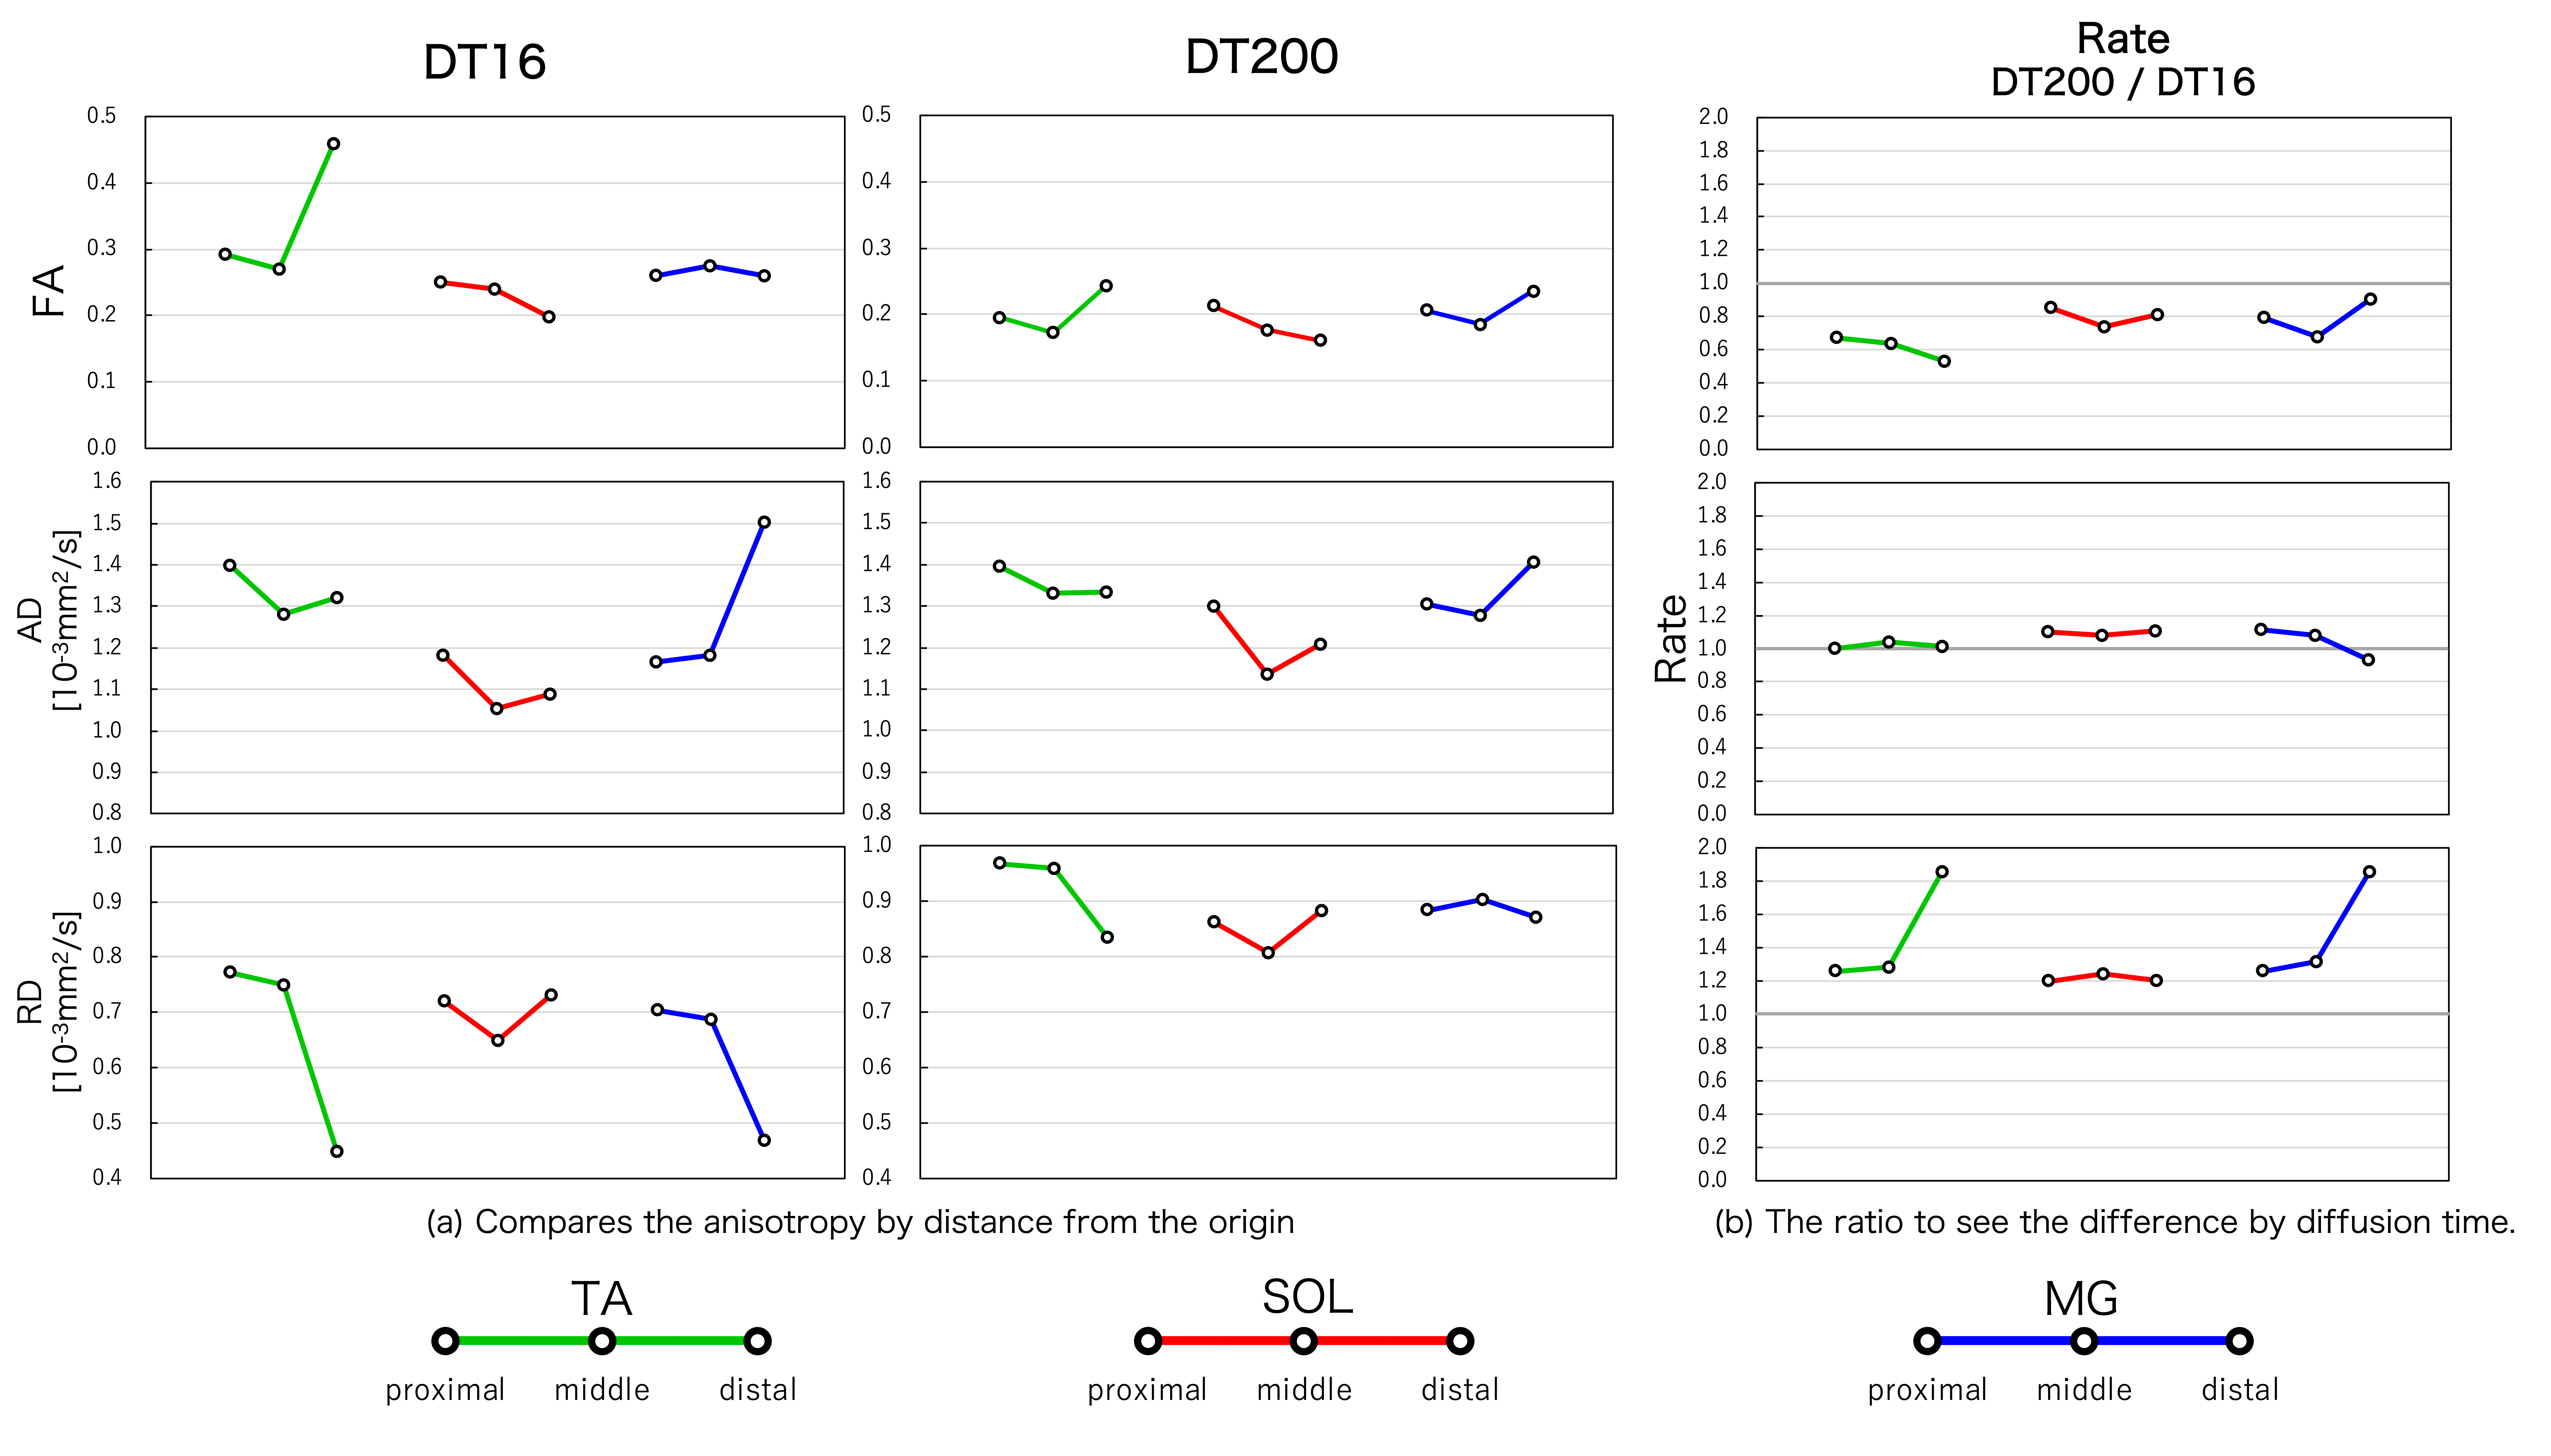
In this experiment, the right hind leg of mice underwent magnetic resonance imaging (MRI). Healthy 8-week-old C57BL/6 mice were used (n = 6). MRI was performed using a 9.4-T MRI system (Bruker BioSpin, MA, USA) and a cryogenic 4-channel surface probe (Bruker) for DWI (stimulated echo) imaging. The imaging conditions were as follows: repetition time/echo time, 2000/15.10 ms; b-value, 0, 700 s/mm2; DT, 8, 16, 36, 64, 100, 144, 196, 256, 324, 400, and 484 ms; diffusion directions, 12. ADC evaluation was performed by tensor analysis using Diffusion Toolkit (Massachusetts General Hospital) to calculate axial diffusivity (AD), radial diffusivity (RD), and fractional anisotropy (FA). The right leg of one sample was also sampled, and tractography was performed using TrackVis (Massachusetts General Hospital). In tractography, the b-value was fixed at 700 (s/mm2), and the DT varied from 16 to 200 ms. Tractography was performed on the tibialis anterior (TA), soleus (SOL), and medial head of the gastrocnemius muscles (MG). The region of interest was two cross-sections near the maximum diameter of each muscle. Based on the FA images obtained by tensor analysis, tractography was weighted by the FA values corresponding to the positions through which each fiber passes in the tractography. The mean fiber length, standard deviation, and number of fibers per DT were determined from tractography. Tractography weighted by AD and RD was also created. Based on the created tractography, the distributions of FA, AD, and RD were determined and compared by skeletal muscles, distance from the origin (proximal, intermediate, and distal), and DT. In the evaluation of anisotropy in the distance from the origin, the proximal and distal regions of interest were determined based on a comprehensive judgment of the muscle cross-sectional area and position in the entire muscle. In vivo imaging was performed under anesthesia using isoflurane 1.5%–2.0% to reduce the influence of movement and the burden of prolonged imaging. These animal experiments were performed under the approval of the RIKEN Animal Experiment Committee.Results & Discussion
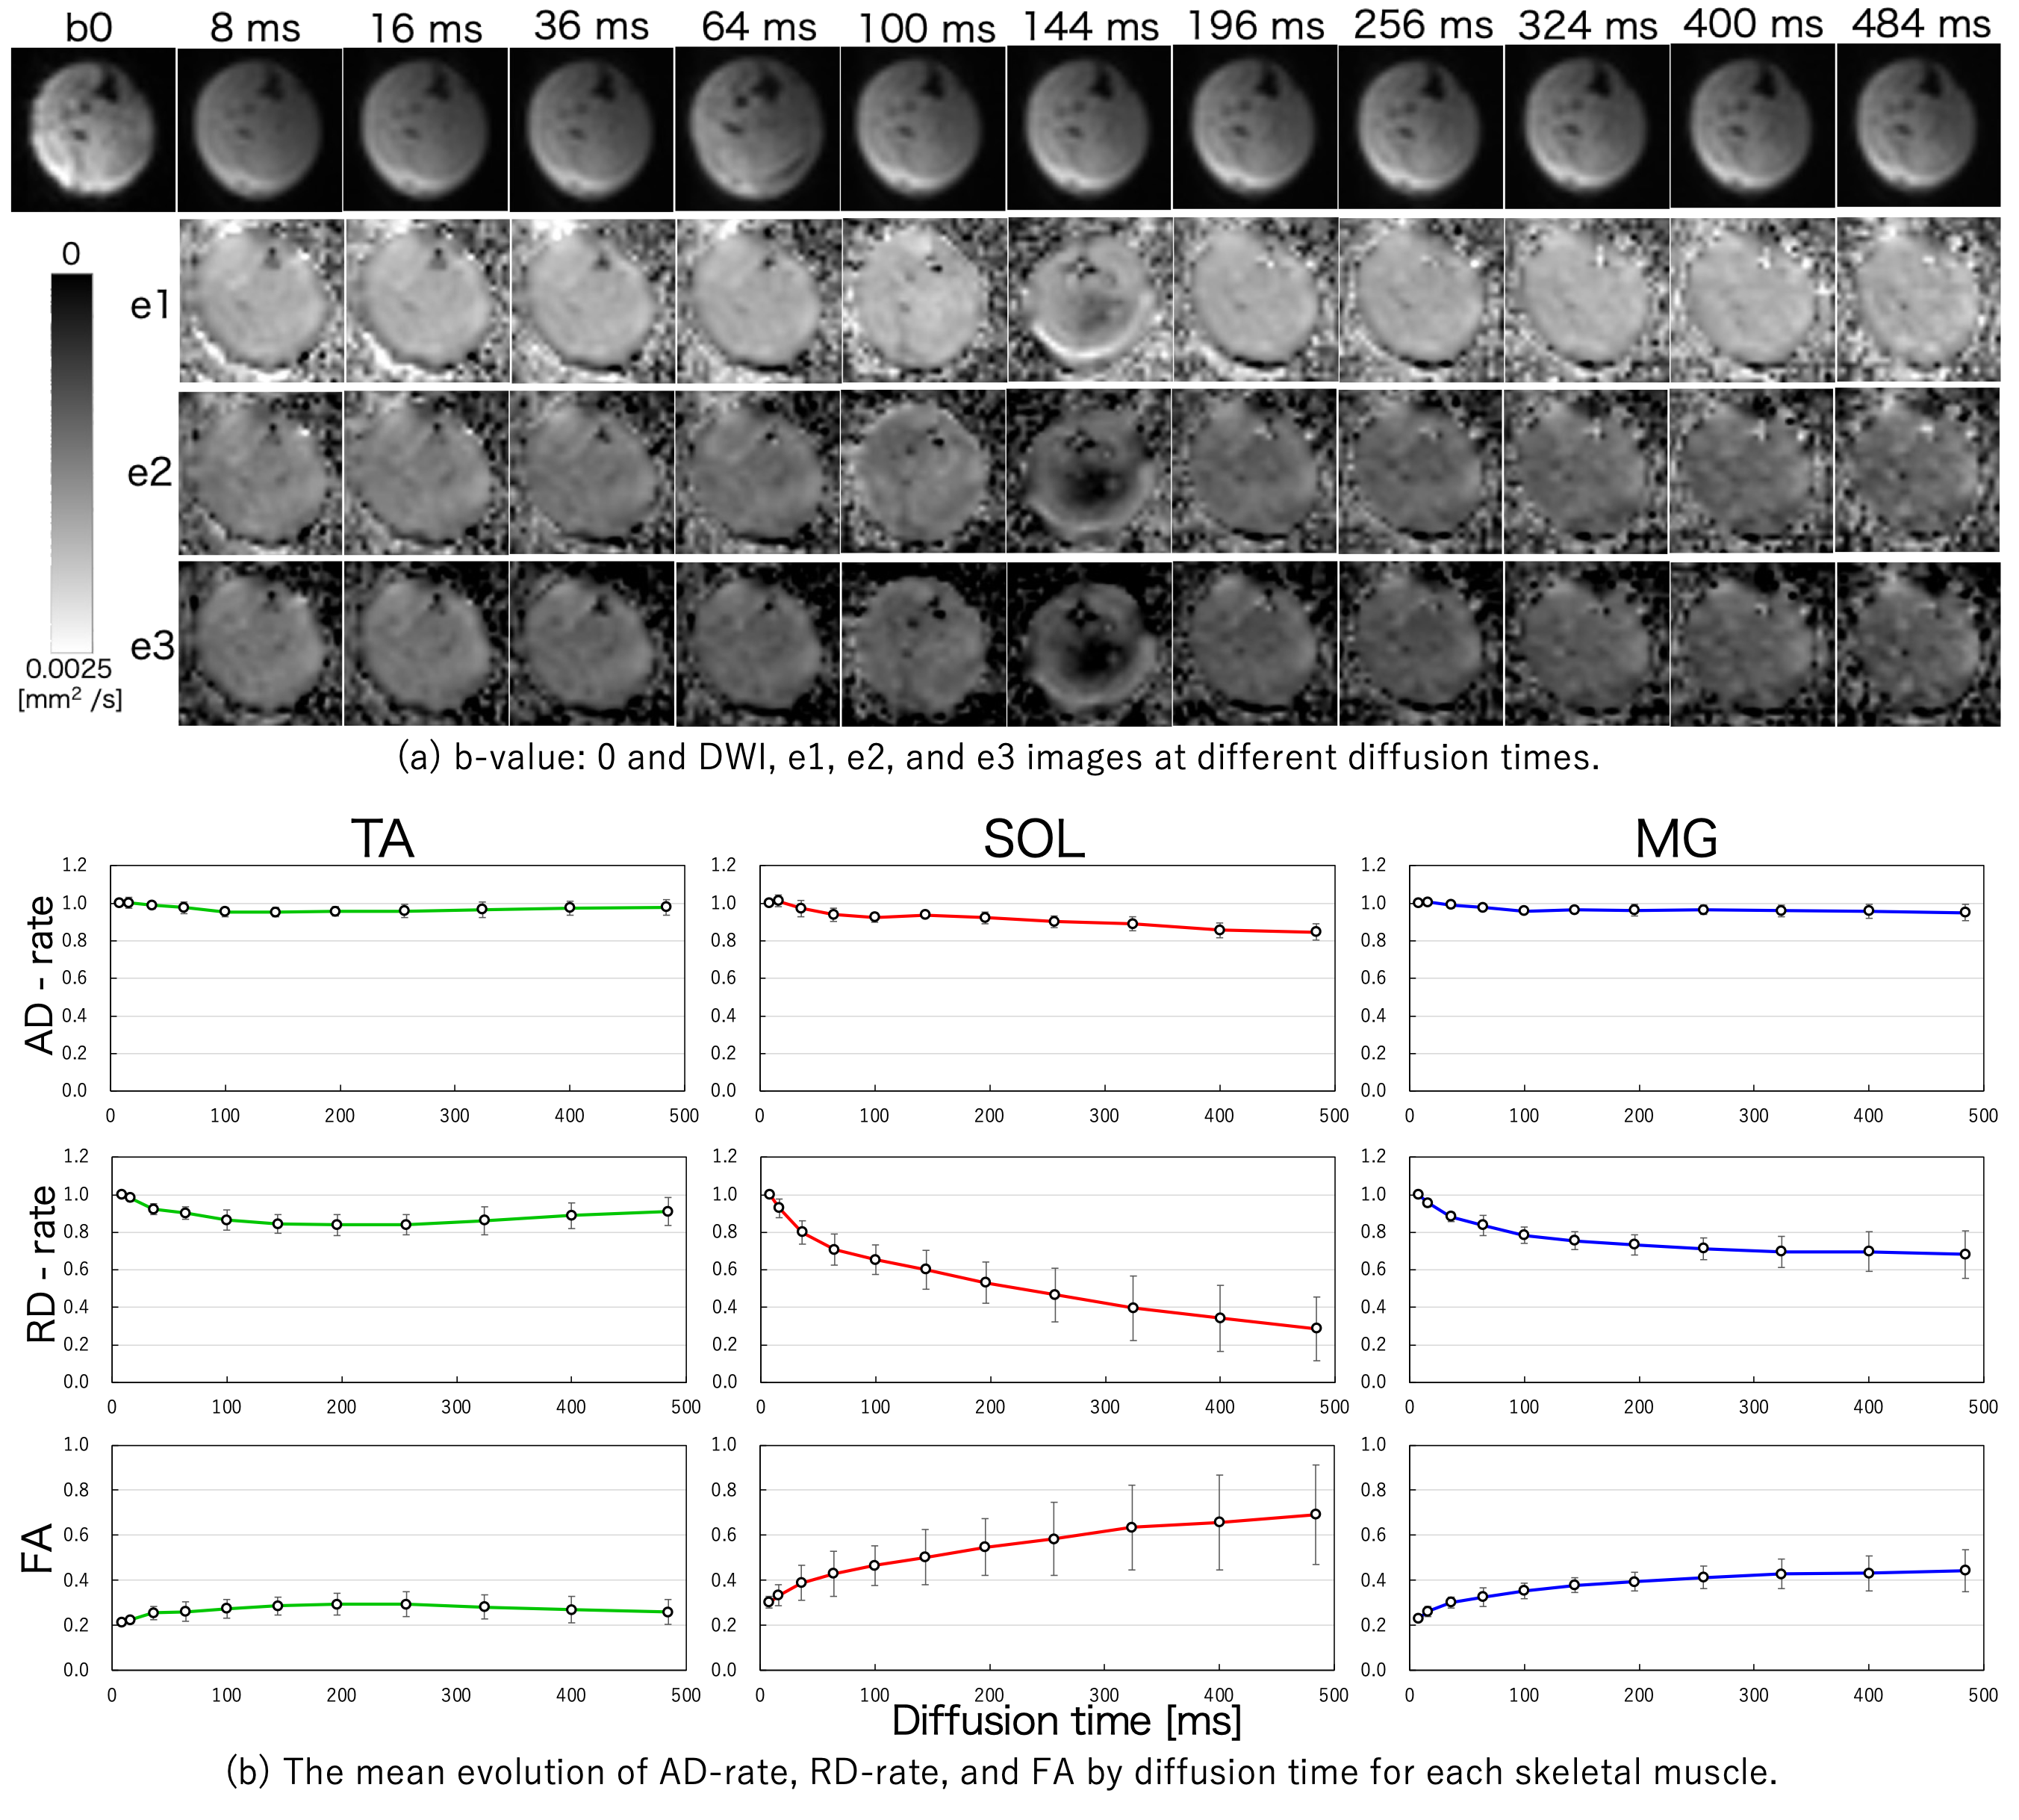
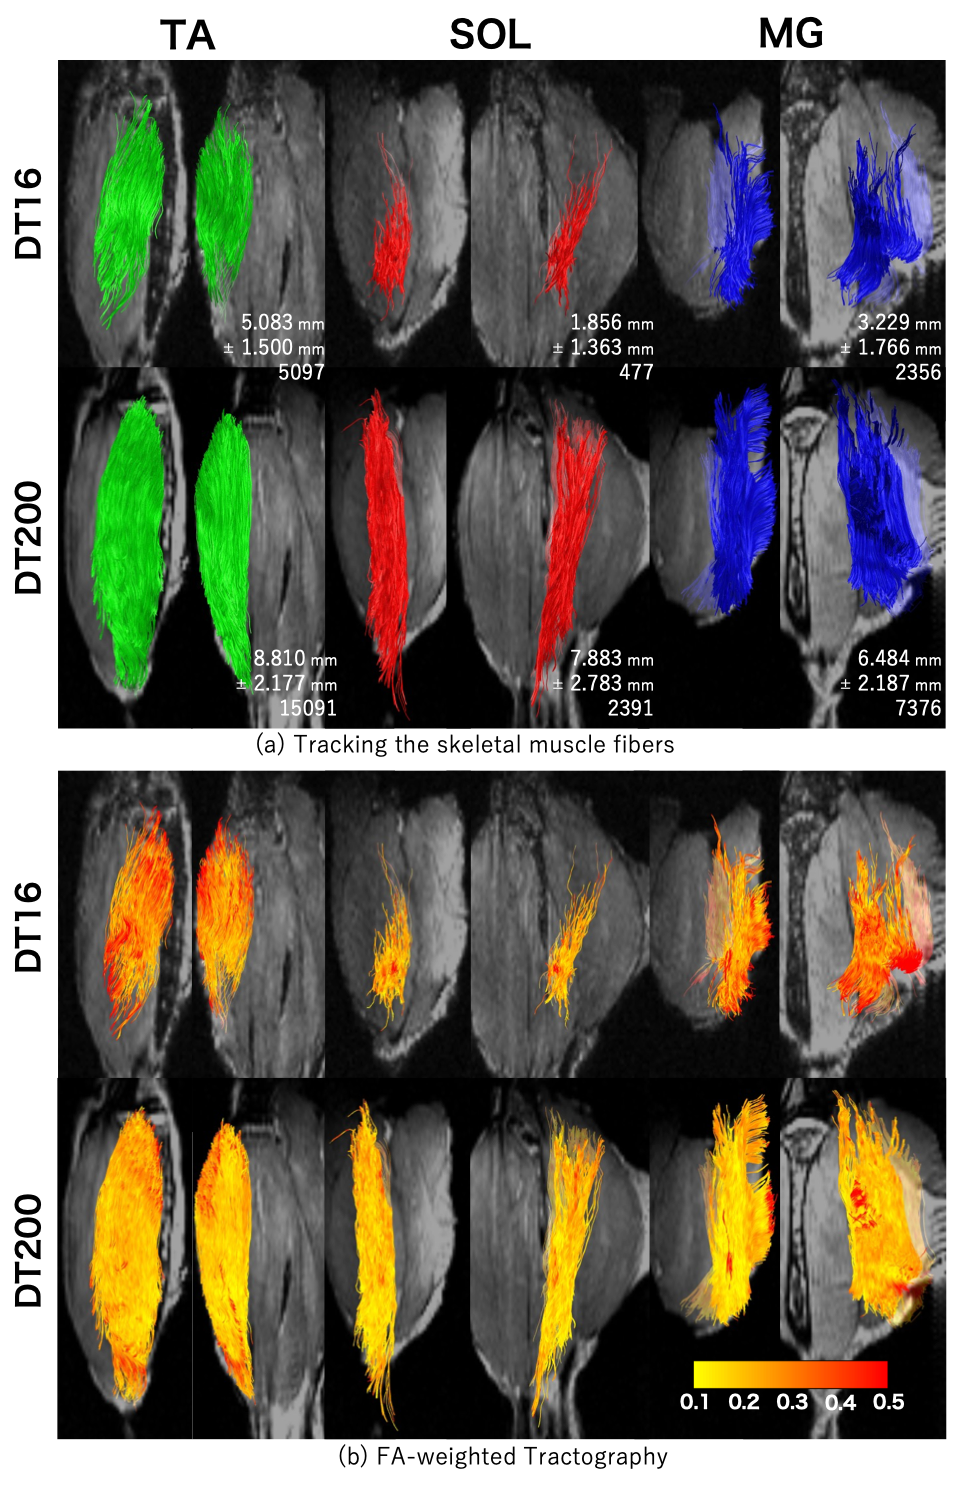
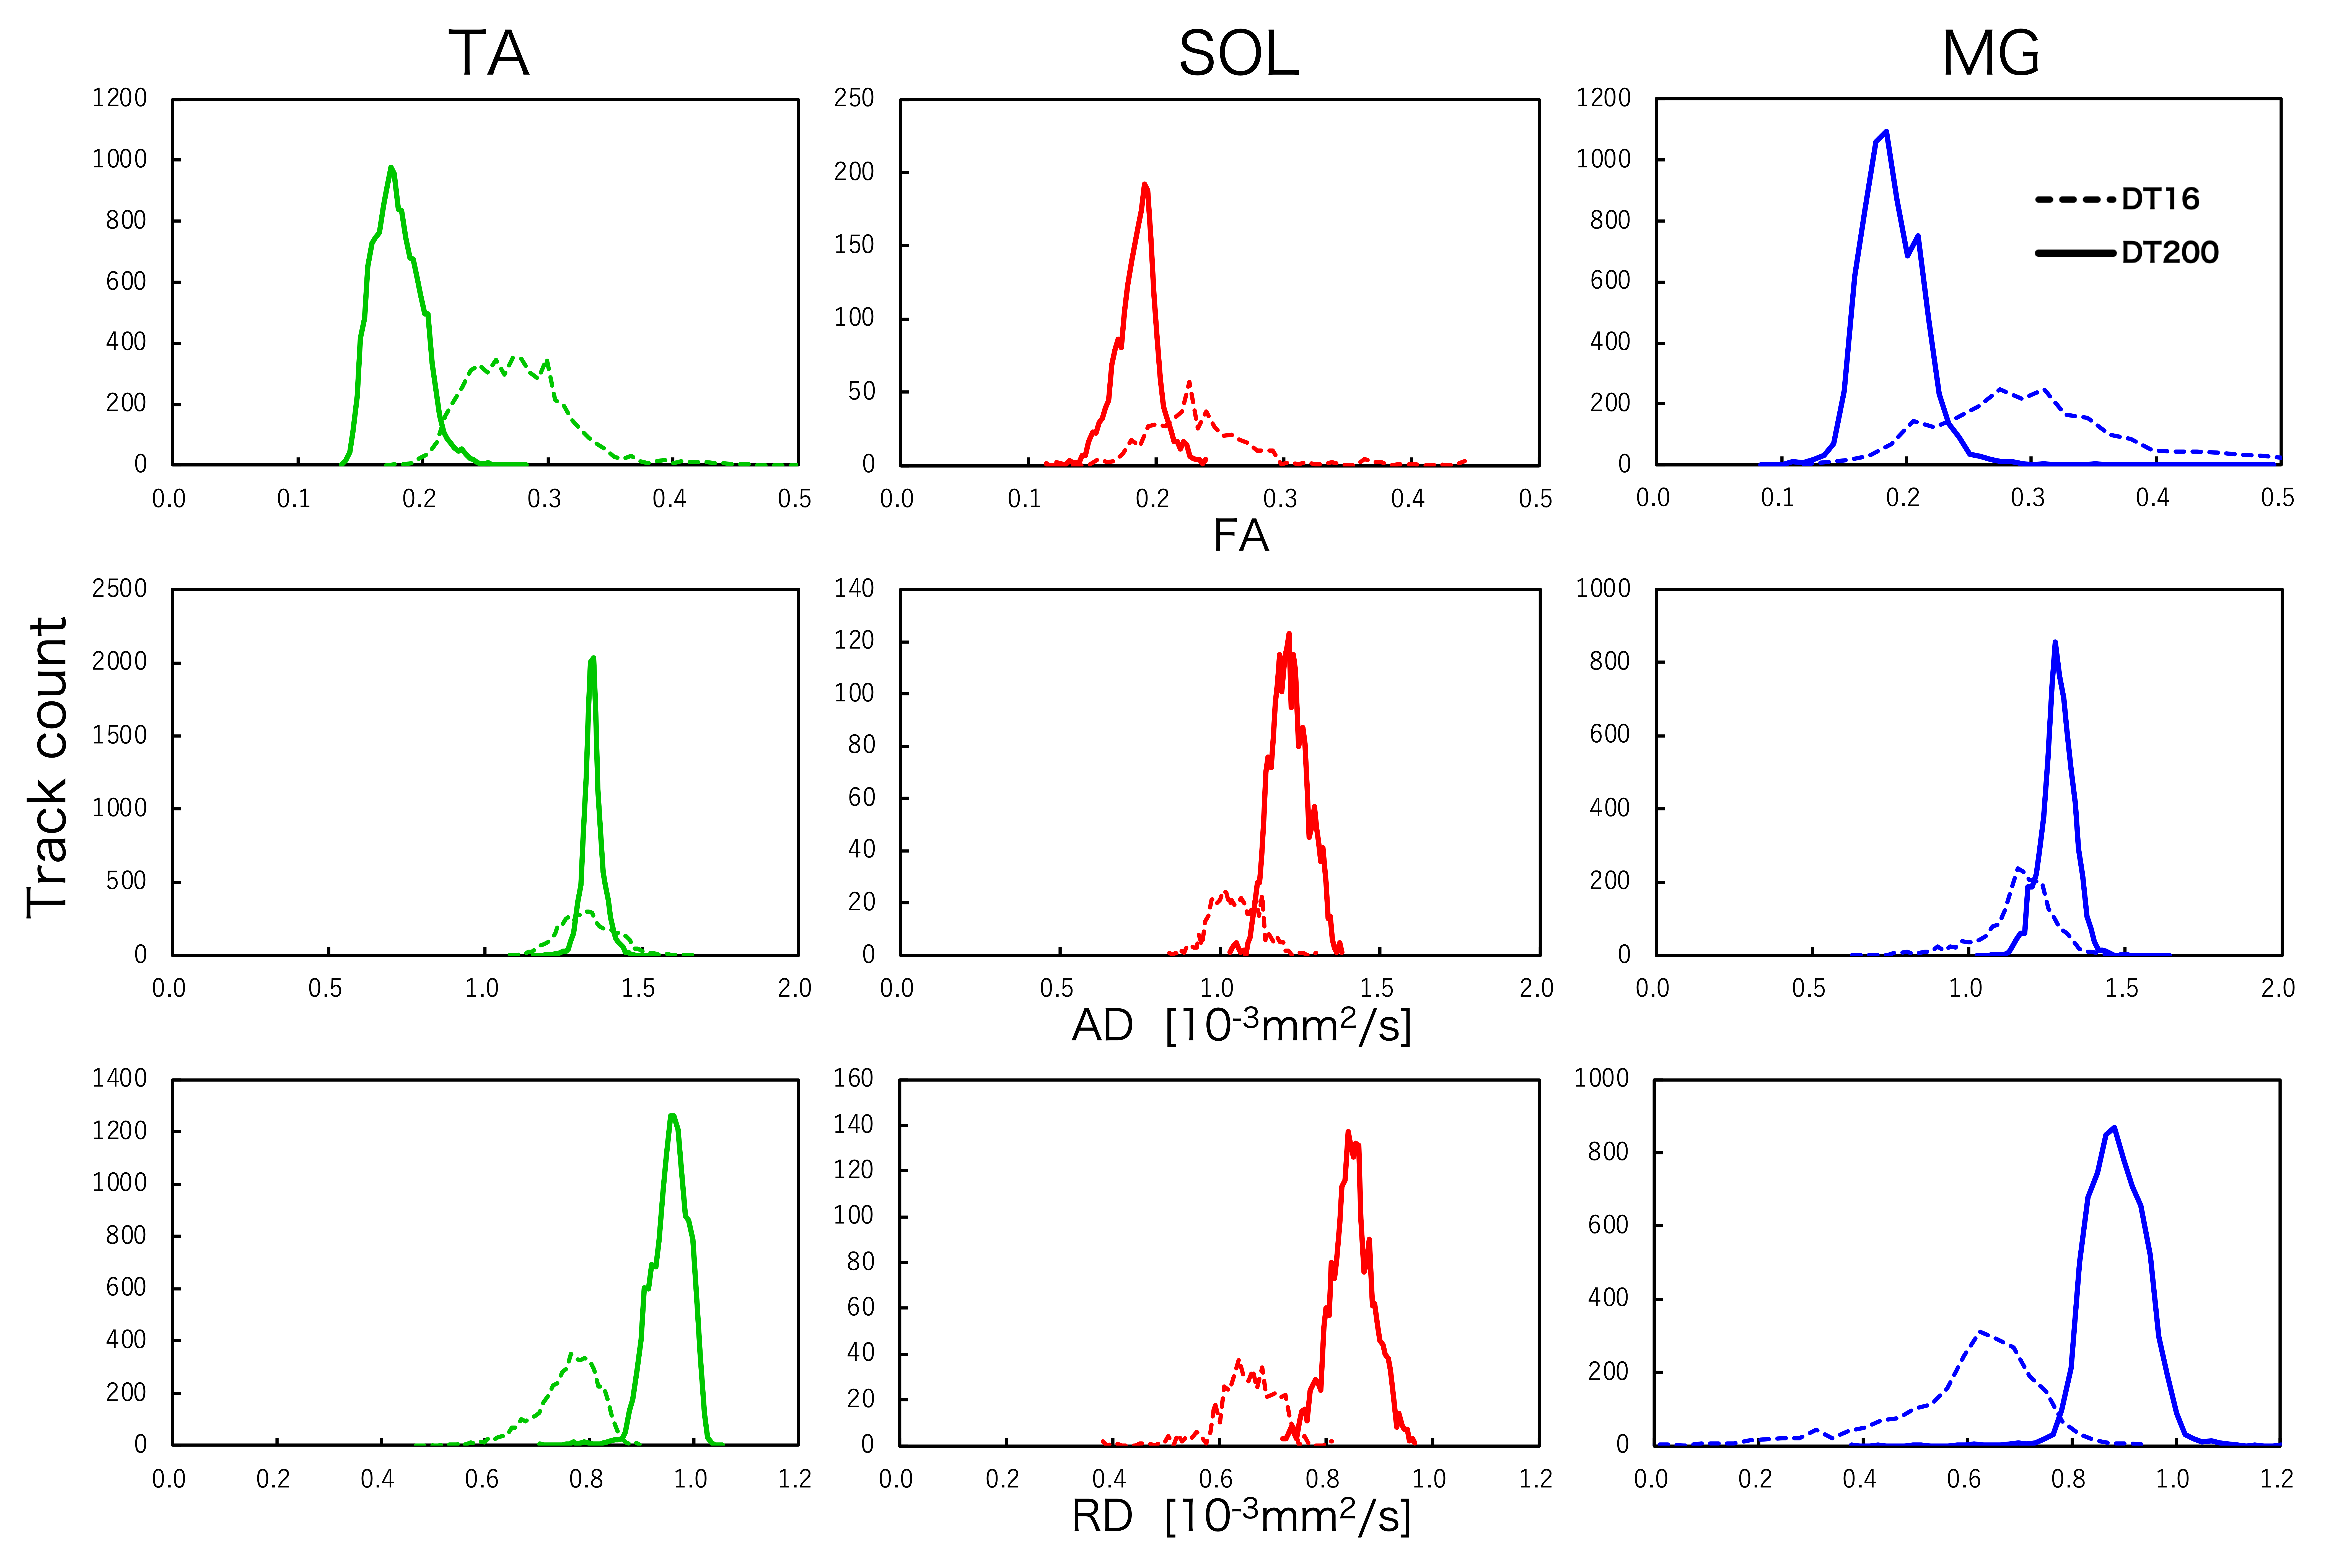
The RD of SOL and MG decreased with extended DT, whereas the RD of TA decreased until the DT of approximately 200 ms and then increased (Figure 1). The long axis shows “free water”-like movement, whereas the short axis shows movement limited by the cell membrane. The RD of the TA increased after approximately 200 ms of DT because water molecules are moving out of the cell membrane due to the high density of the myofibers.4, 5Tractography shows that the SOL has complex myofibers6, and if the DT is short, the SOL is affected by crossed fibers; however, prolonging the DT allows the accurate depiction of the SOL (Figure 2). In tractography weighted by FA, the edges of the muscles have denser muscle fibers, which may have resulted in larger λ1 and FA. FA is distributed in smaller values for DT of 200 ms compared with DT of 16 ms (Figures 3 and 4). Previous studies have shown that the degree of anisotropy is lower in skeletal muscles because myofibers are oriented in multiple directions7, 8 and that the convergence of myofibers and increased density of myofibers occur at the edges of the muscles, rather than in the center9, which may increase anisotropy.Conclusion
Tractography measurements were performed to examine how different DTs cause changes in the depiction and anisotropy of skeletal muscles. As a result, a longer DT allowed us to evaluate diffusion motion within muscle fibers and capture the precise structure of the skeletal muscles.Acknowledgements
This work was supported by the program for Brain Mapping by Integrated Neurotechnologies for Disease Studies from the Japan Agency for Medical Research and Development (Grant Number JP21dm0207001 to HO), Japan Society for the Promotion of Science (Grant Number JP20H03630 to JH), and “MRI platform” as a program of Project for Promoting Public Utilization of Advanced Research Infrastructure of the Ministry of Education, Culture, Sports, Science and Technology, Japan (Grant Number JPMXS0450400622).References
1. Le Bihan D, Mangin J, Poupon C, et al. Diffusion tensor imaging: Concepts and applications. Journal of Magnetic Resonance Imaging. 2001;13(4):534-546.
2. Josef Pfeuffer, Flogel U, Dreher W, et al. Restricted diffusion and exchange of intracellular water: theoretical modelling and diffusion time dependence of 1HNMR measurements on perfused glial cells. NMR In Biomedicine: NMR Biomed. 1998;11(1):19-31.
3. Bammer R, Acar B, Moseley ME. In vivo MR tractography using diffusion imaging. European Journal of Radiology. 2003;45:223–234.
4. Khalil C, Budzik J, Kermarrec E, et al. Tractography of peripheral nerves and skeletal muscles. European Journal of Radiology. 2010;76(3):391–397.
5. Cleveland G, Chang D, Hazlewood C, et al. Nuclear magnetic resonance measurements of skeletal muscle. Anisotropy of the diffusion coefficient of the intracellular water. Biophys Jounal. 1976;16(9):1043–1053.
6. Agur A, Ng-Thow-Hing V, Ball K, et al. Documentation and three-dimensional modelling of human soleus muscle architecture. Clinical Anatomy. 2003;16(4):285–293.
7. Damon B, Froeling M, Buck A, et al. Skeletal muscle diffusion tensor-MRI fiber tracking: rationale, data acquisition and analysis methods, applications and future directions. NMR Biomed. 2017;30(3):e3563.
8. Pfeuffer J, Flogel U, Dreher W, et al. Repeatability of DTI-based skeletal muscle fiber tracking. NMR Biomed. 2010;23(3), 294–303.
9. Schlaffke L, Rehmann R, Froeling M, et al. Diffusion tensor imaging of the human calf: Variation of inter- and intramuscle-specific diffusion parameters. Journal of Magnetic Resonance Imaging. 2007;46(4):1137-1148.
Figures