1360
Importance of Prostatic Fluid on the Apparent Diffusion Coefficient: An IR-Prepared Diffusion-Weighted Investigation of Healthy Prostates1Institute of Radiology, University Hospital Erlangen, Friedrich-Alexander-Universität Erlangen-Nürnberg, Erlangen, Germany, 2Section for Biomedical Physics, Department of Radiation Oncology, University of Tübingen, Tübingen, Germany, 3Division of Medical Physics in Radiology, German Cancer Research Center (DKFZ), Heidelberg, Germany, 4Faculty of Physics and Astronomy, Heidelberg University, Heidelberg, Germany
Synopsis
Keywords: Diffusion Modeling, Quantitative Imaging, Signal Modeling, Inversion Recovery, Data Analysis, Contrast Mechanisms, Cancer
Motivation: The apparent diffusion coefficient (ADC) of prostate tissue is generally higher than that of prostate cancer. We hypothesized that the presence of prostatic fluid is partly responsible for the higher ADC.
Goal(s): To elucidate the value of this hypothesis with diffusion-T1-relaxation experiments.
Approach: Diffusion-weighted data of ten healthy participants’ prostates were sampled with a range of IR times and fitted to a two-compartment model (tissue & fluid).
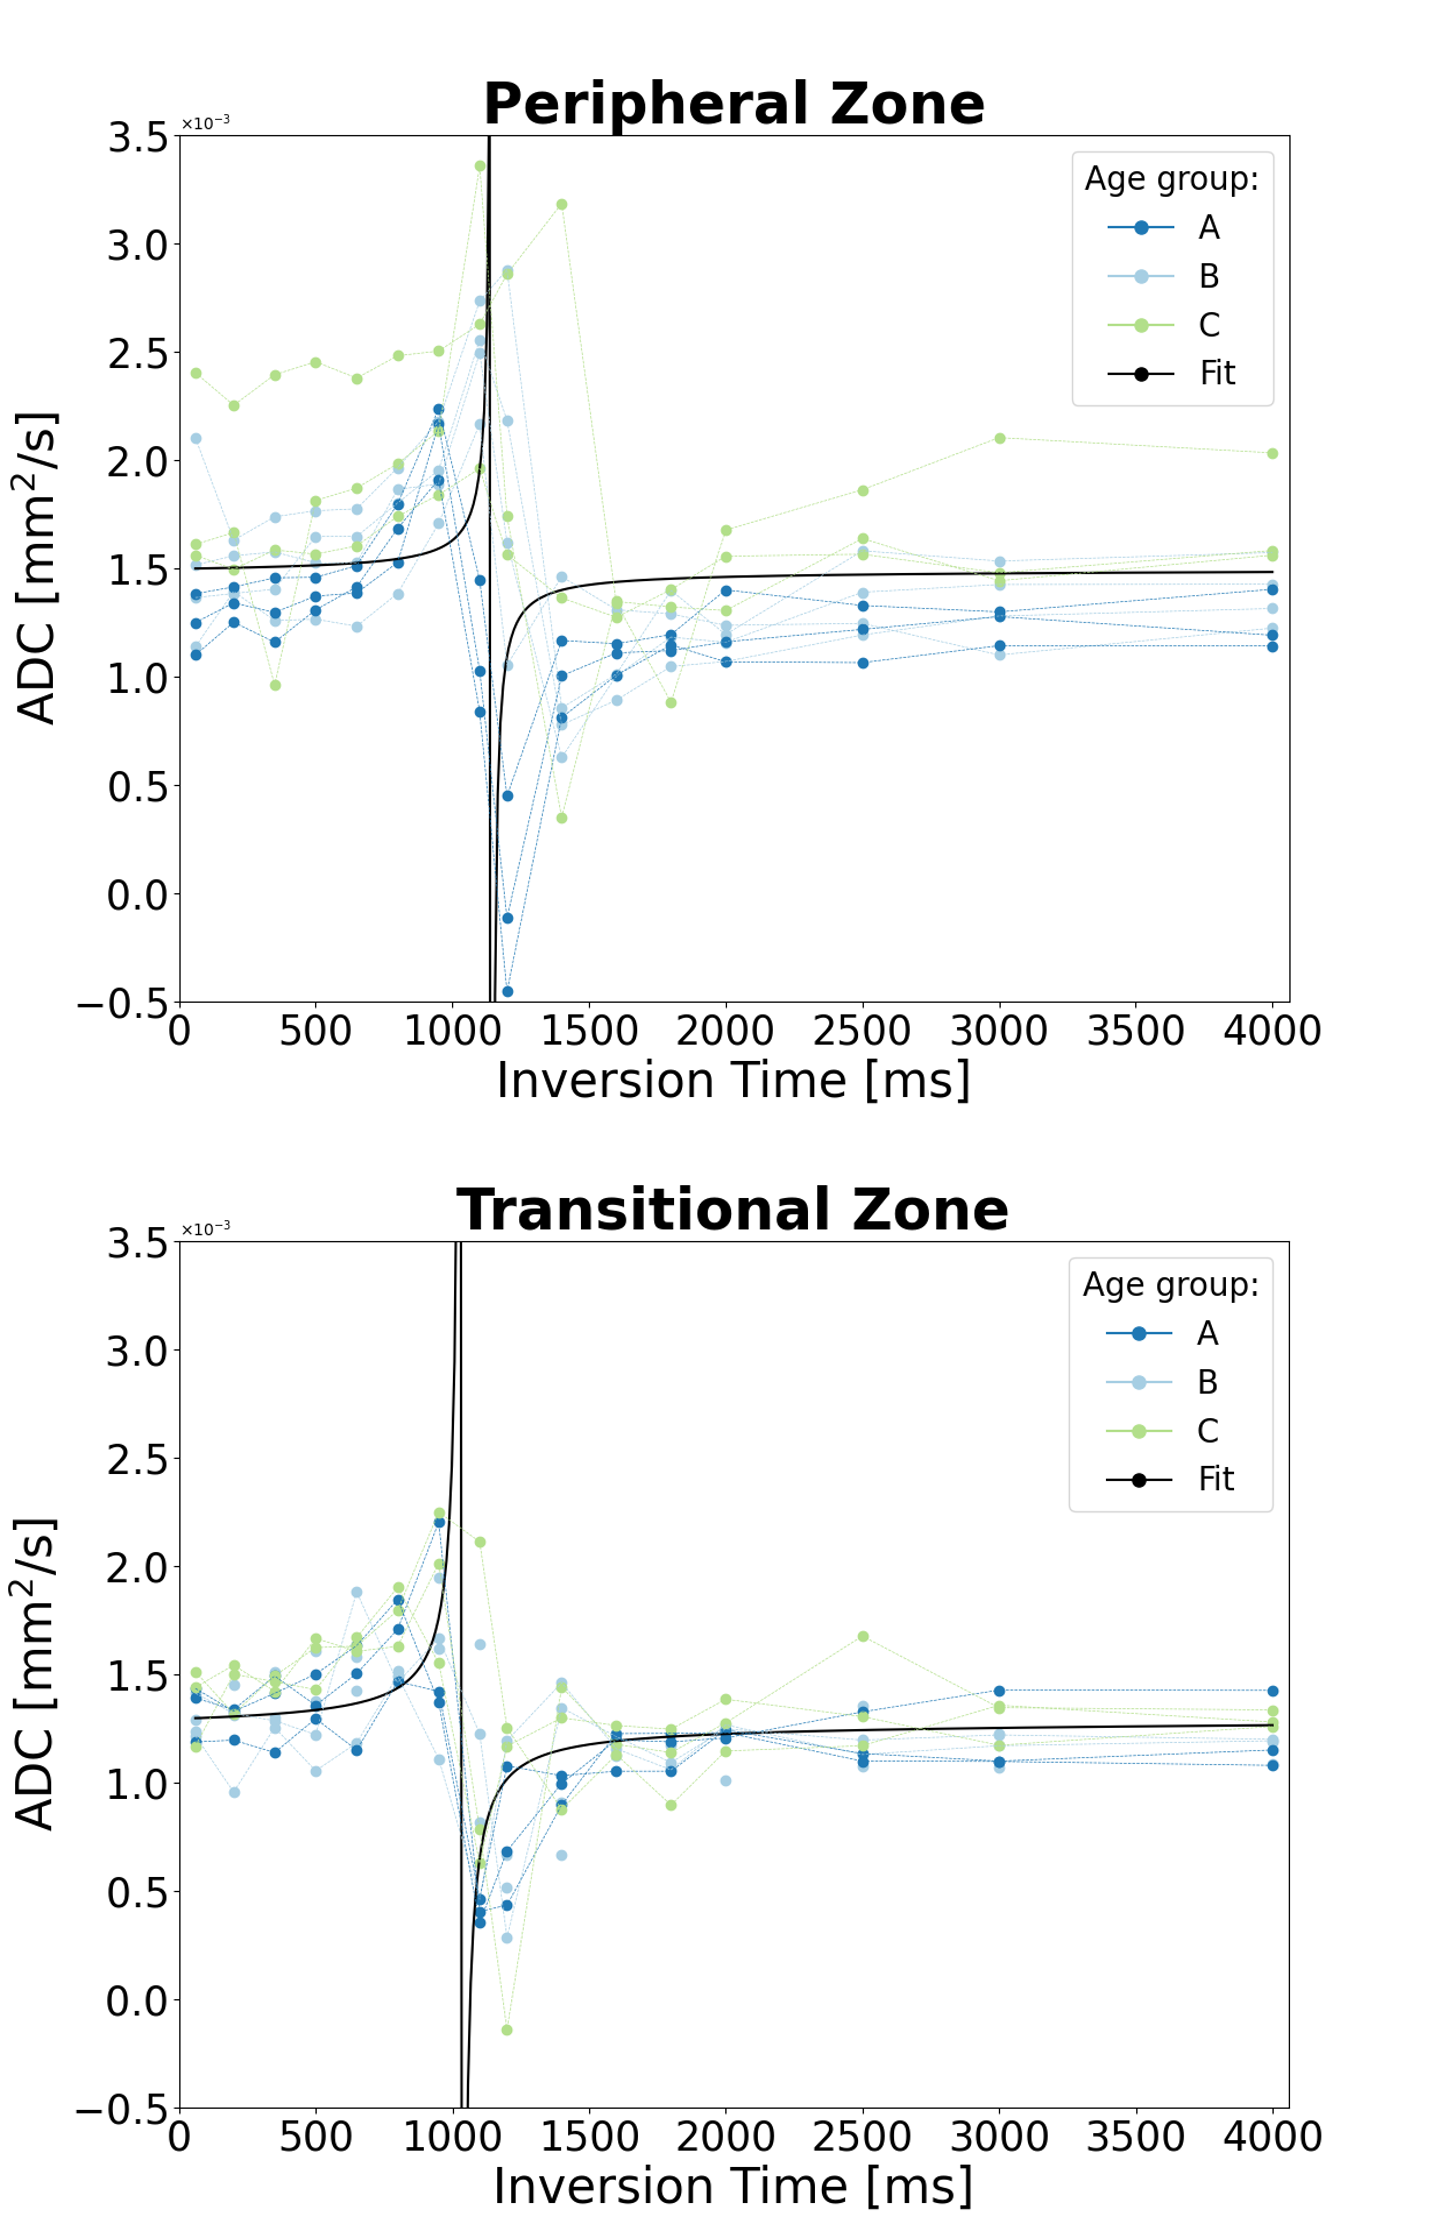
Results: The ADC(TI) dependency was characteristic of the two-compartment model. ADC(TI) increased with TI from 0 to roughly 1,200 ms, then flipped to smaller ADC values and then approached an asymptotic value at large TI.
Impact: This study contributes to a better understanding of prostate DWI contrast. The observed ADC(TI) dependence may be exploited for improved DWI-based prostate cancer diagnostics.
INTRODUCTION
Diffusion-weighted imaging (DWI) is pivotal for prostate MRI 1. This is rooted in the generally observed lower apparent diffusion coefficient (ADC) in significant prostate cancer lesions compared to surrounding prostate tissue. This difference is thought to originate from microstructural changes such as a reduction of the extracellular space 2. Another reported structural change is the decrease of the fluid-containing lumen in prostate cancer 3. This structural change may well affect the measured ADC. The idea that we follow here is that it should be possible to model this situation with two well-separated compartments, i.e. tissue and fluids in the lumen. The vastly different T1 times of tissues and fluids may allow for an assessment of this idea through inversion recovery (IR) prepared DWI. Here, we aimed at elucidating the nature of the measured apparent diffusion in prostate tissue with this approach.METHODS
In this IRB-approved prospective study, after obtaining written informed consent, we measured 10 healthy male volunteers (mean age: 40±14 years) using IR-prepared DWI at 3 T (Magnetom VIDA, Siemens Healthineers, Germany) with b-values of 50 and 800 s/mm², 16 inversion times (TI) ranging from 60 to 4000 ms, TR= 6000 ms and TE= 62 ms. Additionally, data with b= 400 s/mm² were acquired to fit the apparent diffusion coefficient if the signal was too low at b = 800 s/mm². To avoid slice cross-talk, only one central slice of the prostate was acquired. The mean signal in the peripheral and transitional zone was computed with segmentations defined in MITK (MITK 2018.4.0). Then, ADC values were computed from the mean signals. A two-compartment model was fitted once to the ROI-averaged signal values and once to the voxel signal values.$$S=S_{0}\times(f_{F}\times(1-2exp(-\frac{TI}{T_{1F}})+exp(\frac{T_{R}}{T_{1F}}))\times exp(-b \cdot D_{F}) +(1-f_{F})\times( 1-2 exp(-\frac{TI}{T_{1T}})+exp(\frac{T_{R}}{T_{1T}}))\times exp(-b \cdot D_{T}))$$
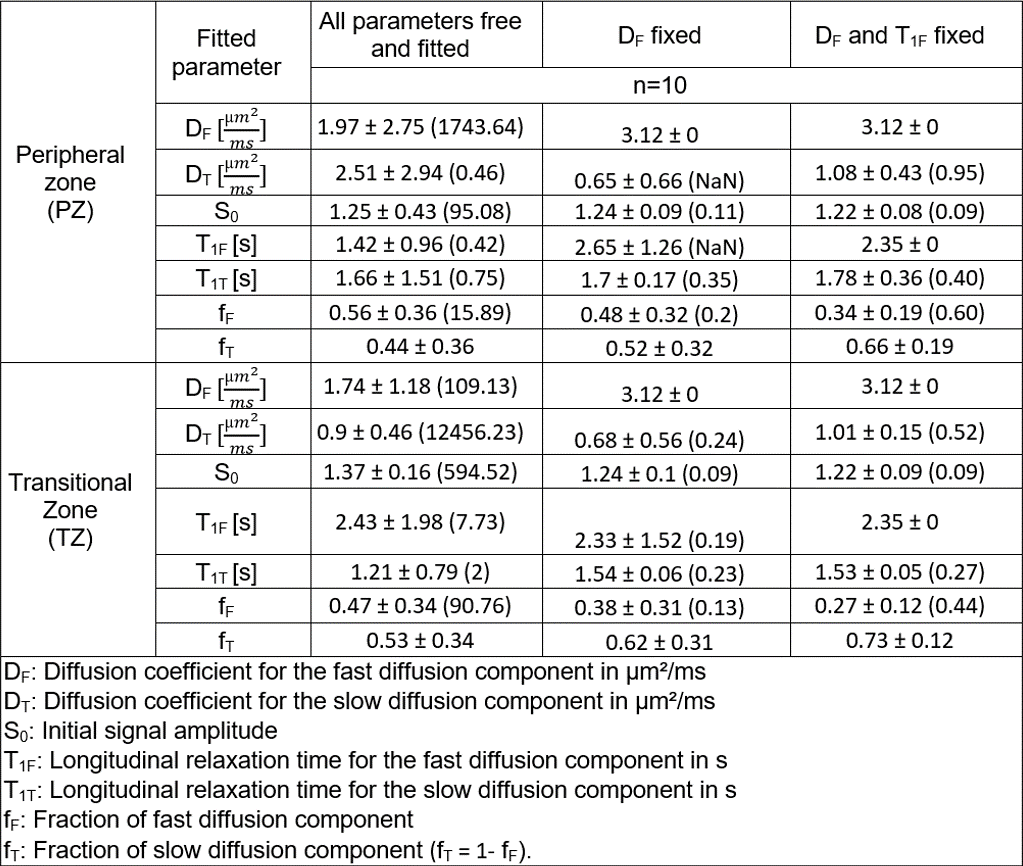
with the ADCs of fluid and tissue (DF, DT) and the fluid’s signal fraction fF. The fit was performed once fitting all parameters, once with DF being fixed to the water diffusion coefficient at body temperature 4, and once with additionally fixing T1F to 2.35 s, a value which was estimated by fixing fF to T2-weighted literature-derived lumen volume fractions 5 and fitting the other parameters; and by finally computing the average T1F over all volunteers.
RESULTS
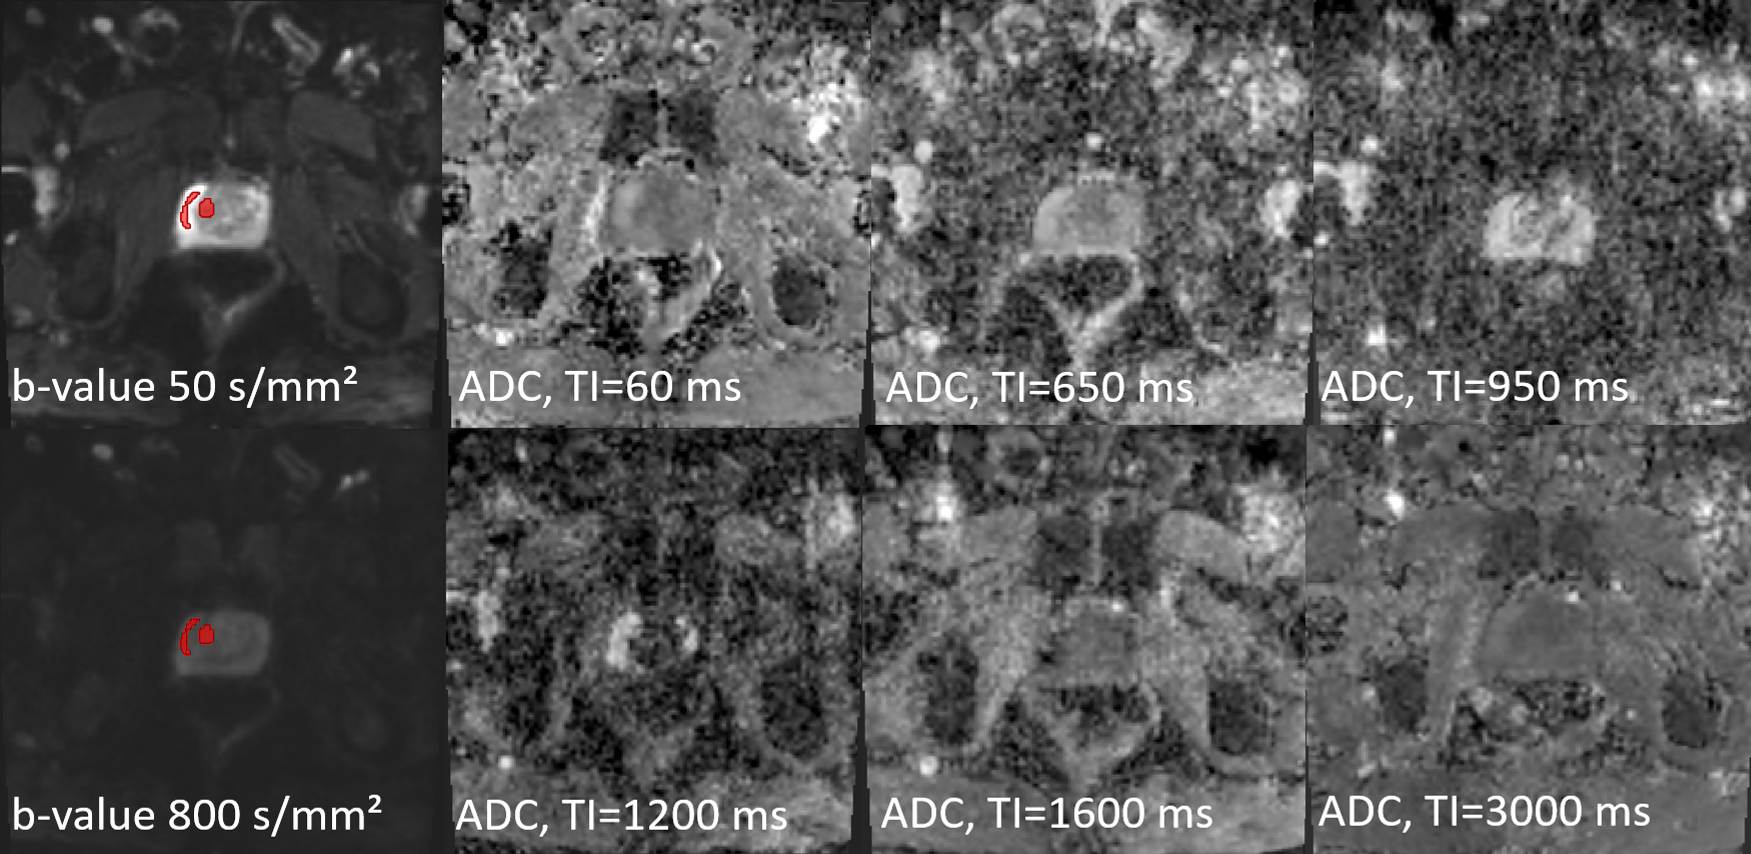
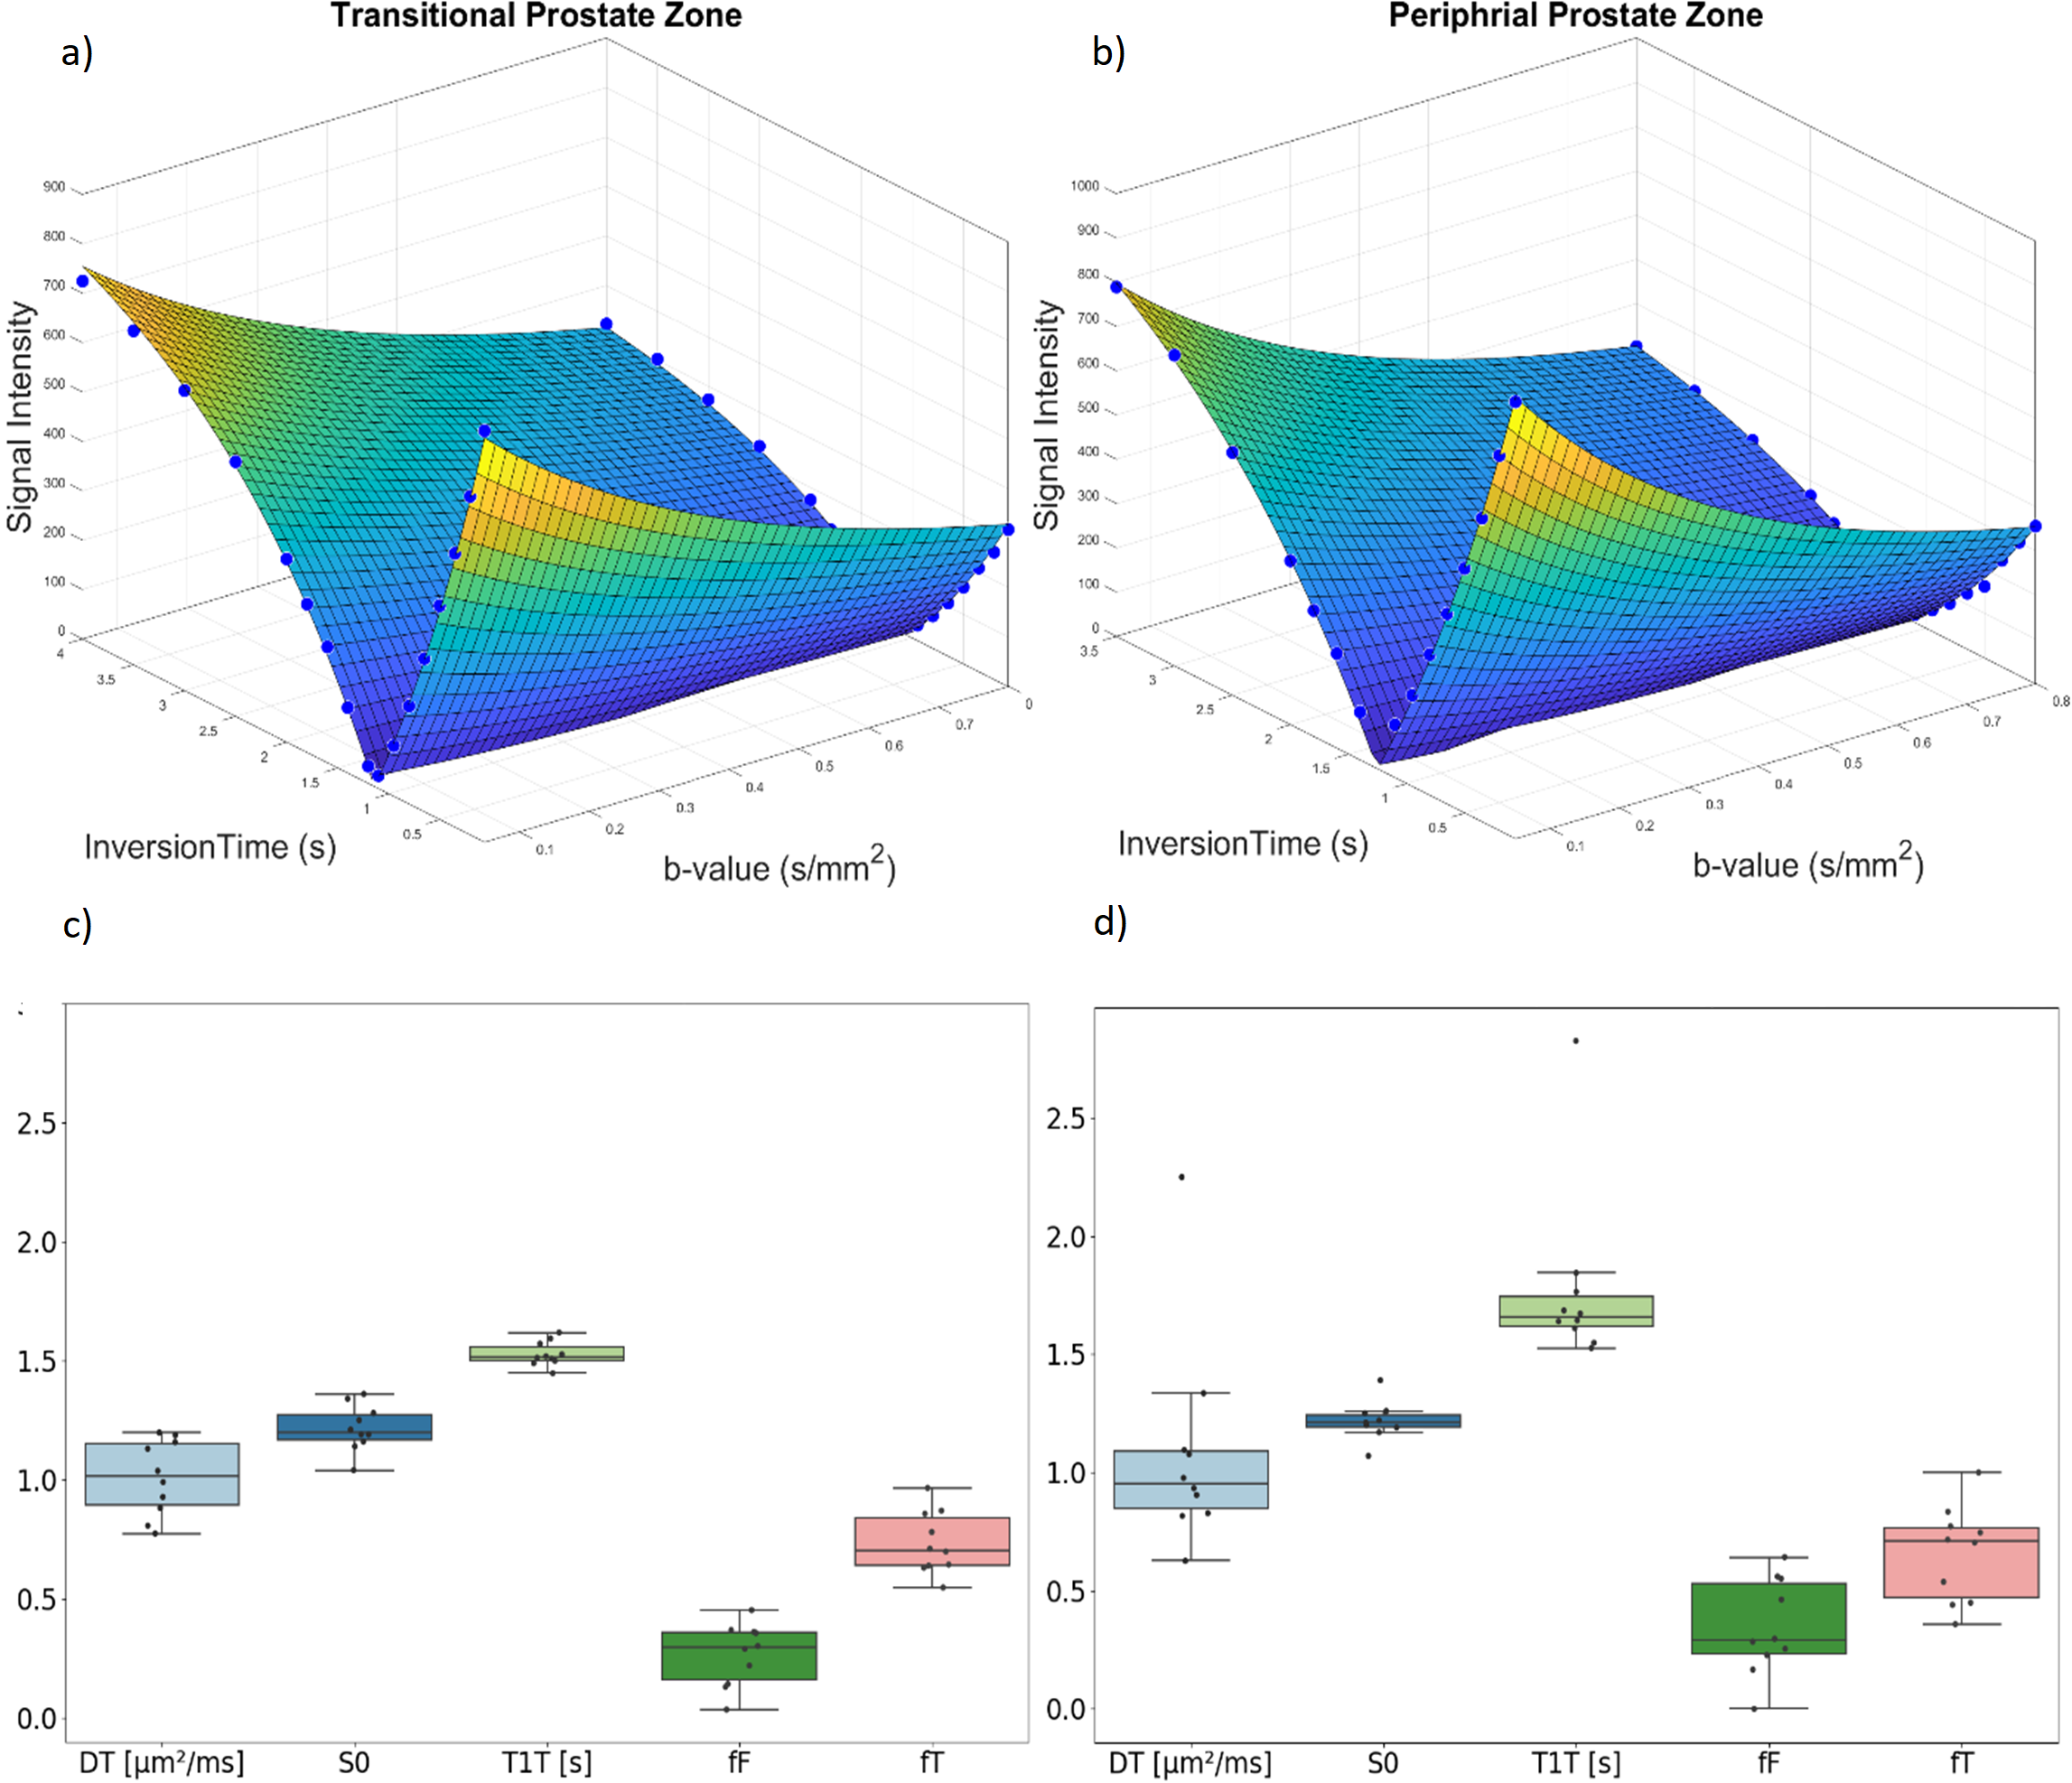
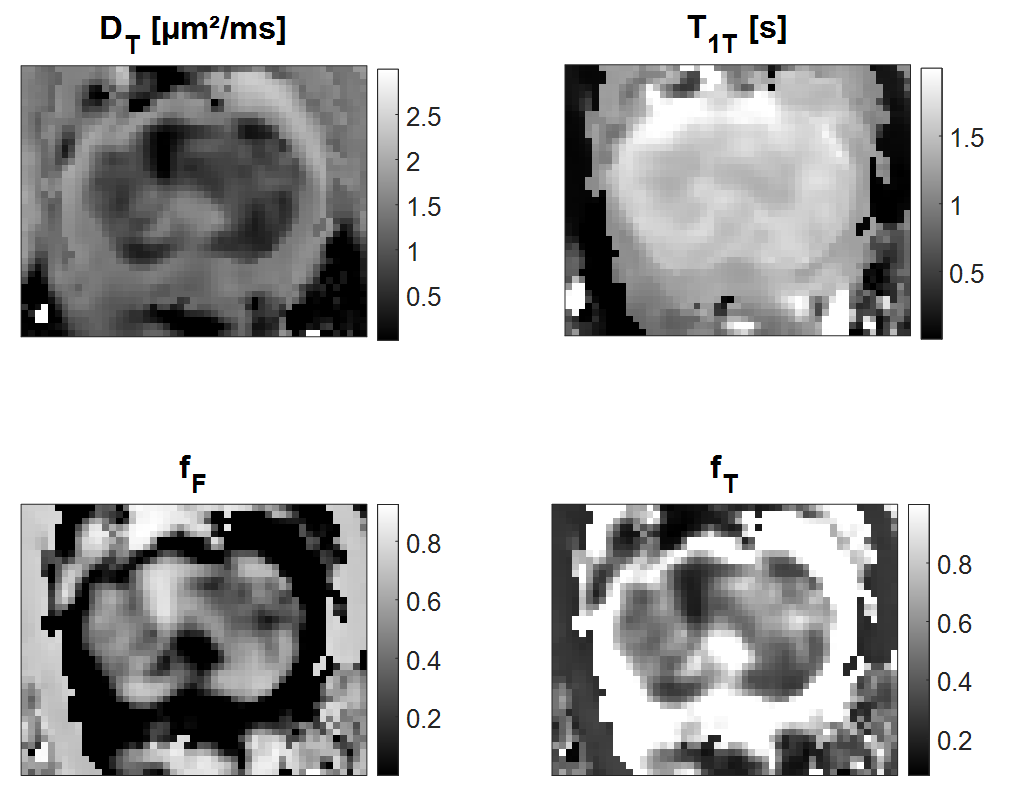
Figure 1 shows example images of one volunteer and the respective manual segmentations. Figure 2 shows the ADC as a function of TI. The ADC increases between TI= 60 ms and approximately 1100 ms, then drops drastically, and later increases again, stabilizing at a very high TI. The curve representing the two-compartment model fit matches this behaviour well. This is also the case for the curve fitted to the signal values (c.f. Fig. 3ab), from which the ADC curve was derived.Table 1 summarizes the fitted model parameters, which are also visualized in Fig 3cd. The confidence intervals are much larger than the mean fitted parameter values, if all parameters are fitted, or if only DF is fixed, but they become of reasonable size if T1F and DF are fixed. For example, the mean values were: DF=3.12 µm²/ms, DT=1.01 µm²/ms, and fF=0.27. The compartment averaged ADC is DF*fF+(1-fF)*DT = 1.57 µm²/ms, which deviates by 0.56 µm²/ms from DT. Figure 3 presents boxplots of resulted parameters and exemplary fit to the signal. Figure 4 shows maps of the fitted model parameters.
DISCUSSION
Given that relaxation-diffusion MR data is usually quite featureless 6, it is captivating that the ADC(TI) data points display three characteristic and visually well-perceivable features: Increase of ADC until a tipping point at approximately TI = 1.1 s, drop of ADC at the tipping point, then a rebound. This behaviour can be understood with the model. After the inversion, the longitudinal magnetization of tissue and fluid is negative, but the tissue magnetization recovers more quickly reducing its signal contribution in absolute terms. Hence, the ADC increases due to the larger weight of the fluid compartment. At the tipping point, the total magnetization becomes zero at b=0. A small diffusion encoding lets it deviate from zero because $$$D_{F}\neq D_{T}$$$ results in ADC=+inf (before the tipping point) and ADC=-inf (after the tipping point). After the tipping point, longitudinal fluid magnetization is still negative while the longitudinal tissue magnetization is positive so that the larger diffusion coefficient of the fluid compartment leads to a reduced signal attenuation and hence a reduced ADC.CONCLUSION
Prostate fluids seemingly contribute significantly to the prostate ADCs. Their contribution could be adjusted by choosing an appropriate IR-preparation potentially leading to increased contrast between significant prostate cancers and the surrounding prostate tissue.Acknowledgements
No acknowledgement found.References
1. O'Shea A, Harisinghani M. PI-RADS: multiparametric MRI in prostate cancer. Magma. Aug 2022;35(4):523-532. doi:10.1007/s10334-022-01019-1
2. Tamada T, Sone T, Jo Y, Yamamoto A, Ito K. Diffusion-weighted MRI and its role in prostate cancer. NMR in Biomedicine. 2014;27(1):25-38. doi:10.1002/nbm.2956
3. Selnæs KM, Vettukattil R, Bertilsson H, et al. Tissue Microstructure Is Linked to MRI Parameters and Metabolite Levels in Prostate Cancer. Front Oncol. 2016;6:146. doi:10.3389/fonc.2016.00146
4. Wagner F, Laun FB, Kuder TA, et al. Temperature and concentration calibration of aqueous polyvinylpyrrolidone (PVP) solutions for isotropic diffusion MRI phantoms. PLoS One. 2017;12(6):e0179276. doi:10.1371/journal.pone.0179276
5. Chatterjee A, Watson G, Myint E, Sved P, McEntee M, Bourne R. Changes in Epithelium, Stroma, and Lumen Space Correlate More Strongly with Gleason Pattern and Are Stronger Predictors of Prostate ADC Changes than Cellularity Metrics. Radiology. 2015;277(3):751-762. doi:10.1148/radiol.2015142414
6. Slator PJ, Palombo M, Miller KL, et al. Combined
diffusion-relaxometry microstructure imaging: Current status and future
prospects. Magnetic Resonance in Medicine.
2021;86(6):2987-3011. doi:10.1002/mrm.28963
Figures