1359
Time-Dependent Diffusion MRI for Quantitative Microstructural Mapping of Liver fibrosis to cirrhosis1Department of Radiology, Wuhan union hospital, Wuhan, China, 2Clinical & Technical Support, Philips Healthcare, Wuhan, China
Synopsis
Keywords: Microstructure, Liver
Motivation: The potential of characterizing cellular tissue microstructures using recently developed time-dependent diffusion MRI has been examined.
Goal(s): However, its value in imaging liver fibrosis to cirrhosis remains unknown.
Approach: In this study, we conducted a preclinical investigation using a dietondiethylnitrosamine (DEN)-induced rat liver fibrosis model with temporal diffusion spectroscopy (TDS) MRI
Results: Our findings revealed that the diameter, intracellular volume fraction (Vin), and cellularity were associated with varying degrees of liver fibrosis. Moreover, the diameter and Vin demonstrated better discrimination ability in the model. Overall, these prognostic indicators exhibit significant potential for clinical application.
Impact: This research highlighted the promising applications of temporal diffusion spectroscopy MRI in evaluating liver fibrosis. Our results indicated innovative noninvasive indicators for liver fibrosis, so as to early identify those who need to be referred to clinics for further assessment.
Introduction
The evaluation and analysis of liver fibrosis (LF) has been a significant area of interest in recent years. Biomarkers based on imaging techniques are emerging as the primary focus in clinical advancement1. One such innovative framework is temporal diffusion spectroscopy (TDS), which uses diffusion MRI to provide quantitative insights into tissue microstructure2,3. Our objective was to assess the effectiveness of microstructural mapping using TDS MRI in characterizing cellular properties of LF to cirrhosis, and differentiating between different grades of LF.Methods
Thirty adult male Sprague-Dawley rats were randomly assigned to two groups: Group-A (n=5) and Group-B (n=25). Group-A rats were scanned with dynamic 3.0 T MRI (Philips, Netherlands) before receiving dietondiethylnitrosamine (DEN), and at 2w, 4w, 6w, and 8w post-DEN induction. Group-B rats also underwent MRI examinations at the same time points. After each MRI scan, five rats were randomly selected for pathological testing. The Metavir staging system was employed to determine the severity of liver fibrosis4. The clinical fibrosis grade ranged from mild (F0-F1) to moderate (F2-F3) to severe (F4)5. The microstructure of the liver was measured and mapped using a specific implementation of TDS Imaging Microstructural Parameters Using Limited Spectrally Edited Diffusion (IMPULSED)6. Fitting of the image was performed using the least square curve fitting method in Matlab 2022a software provided by MathWorks. Four parameters, including cell diameter, intracellular volume fraction (Vin), cellularity and extracellular diffusivity, were estimated. Maps were generated to visualize the sizes of the hepatocytes and the fractions of intracellular areas in each section. Liver samples were subjected to staining with β-catenin to clearly delineate the borders of hepatocyte membranes. A one-way analysis was employed. The correlations between the microstructural parameters derived from the IMPULSED method and those derived from the pathology were evaluated using linear regression analysis with SPSS 26.0 software.Results
All rats successfully developed LF and cirrhosis. We observed a decreasing trend in diameter, and there was a statistically significant difference in diameter among different grades of LF, except for F0 vs F1, F1 vs F2, and F2 vs F3. Vin and cellularity exhibited an upward trend. Both diameter and Vin demonstrated good ability to differentiate various degrees of LF based on clinical fibrosis grade, with statistical differences observed in mild vs moderate, mild vs severe, and moderate vs severe rats. Cellularity also showed good discriminatory ability in mild vs moderate and mild vs severe rats. The changes in the four parameters during the DEN induction period followed the same trend as the fibrosis grade. The cirrhotic liver showed higher cell density. The quantified diameter in pathology ranged from 12.2 μm to 32.5 μm, which was consistent with the range of 10.9 μm to 33.3 μm in TDS MRI, displaying a strong correlation (R2=0.8365). The quantified Vin in pathology ranged from 0.33 to 0.82, while it ranged from 0.25 to 0.84 μm in TDS MRI, also exhibiting a good linear correlation (R2=0.6249).Discussion
Hepatocytes, the primary functional unit of the liver's parenchyma and the liver's most abundant cell type, have the ability to alter their gene expression and secretion profile in response to injury7,8. Therefore, studying changes in hepatocyte morphology could improve our understanding of LF progression. This research study introducesd the use of MRI to detect changes in hepatocyte sizes, which has shown superior capabilities in distinguishing various LF grades. Consequently, it highlights the promising future applications of TDS MRI in evaluating LF progression. As mentioned earlier, fibrosis involves processes such as cell death (apoptosis or necrosis) and the infiltration of cells within the liver8. Our investigation has additionally observed an upward trend in Vin and cellularity alongside the progression of LF, implying that TDS MRI uncovers a potential occurrence indicating that the severity of fibrosis directly correlates to an increase in the quantity and diversity of cells. This particular association has been scarcely documented in prior research. To our knowledge, only one study has confirmed that the attributes and functions of remaining and infiltrated cells varied at various stages of LF9. Consequently, this study represents the first instance where TDS MRI serves as a non-invasive imaging tool not only for assessing fibrosis development but also as a prospective functional MRI to elucidate the cellular mechanism and intercommunication.Conclusion
Our research findings demonstrated the changes in quantitative microstructural mapping from LF to cirrhosis using novel diffusion MRI. The imaging biomarkers of LF, such as diameter, Vin, and cellularity, are reliable noninvasive indicators. Remarkably, diameter and Vin show excellent discrimination capabilities in the rat model, displaying a satisfactory linear correlation.Acknowledgements
None.References
1. Tapper EB, Loomba R. Noninvasive imaging biomarker assessment of liver fibrosis by elastography in NAFLD. Nat Rev Gastroenterol Hepatol. 2018;15(5):274-282.
2. Xu J, Does MD, Gore JC. Quantitative characterization of tissue microstructure with temporal diffusion spectroscopy. J Magn Reson. 2009;200(2):189-197.
3. Gore JC, Xu J, Colvin DC, et al. Characterization of tissue structure at varying length scales using temporal diffusion spectroscopy. NMR Biomed. 2010;23(7):745-756.
4. Goodman ZD. Grading and staging systems for inflammation and fibrosis in chronic liver diseases. J Hepatol. 2007;47(4):598-607.
5. Karrar A, Rajput B, Hariharan S, et al. Major Histocompatibility Complex Class I-Related Chain A Alleles and Histology of Nonalcoholic Fatty Liver Disease. Hepatol Commun. 2020;5(1):63-73.
6. Jiang X, Xu J, Gore JC. Mapping hepatocyte size in vivo using temporal diffusion spectroscopy MRI. Magn Reson Med. 2020;84(5):2671-2683.
7. Lercher A, Bhattacharya A, Popa AM, et al. Type I Interferon Signaling Disrupts the Hepatic Urea Cycle and Alters Systemic Metabolism to Suppress T Cell Function. Immunity. 2019;51(6):1074-1087.e9.
8. Kisseleva T, Brenner D. Molecular and cellular mechanisms of liver fibrosis and its regression. Nat Rev Gastroenterol Hepatol. 2021;18(3):151-166.
9. Feng D, Xiang X, Guan Y, et al. Monocyte-derived macrophages orchestrate multiple cell-type interactions to repair necrotic liver lesions in disease models. J Clin Invest. 2023;133(15):e166954.
Figures
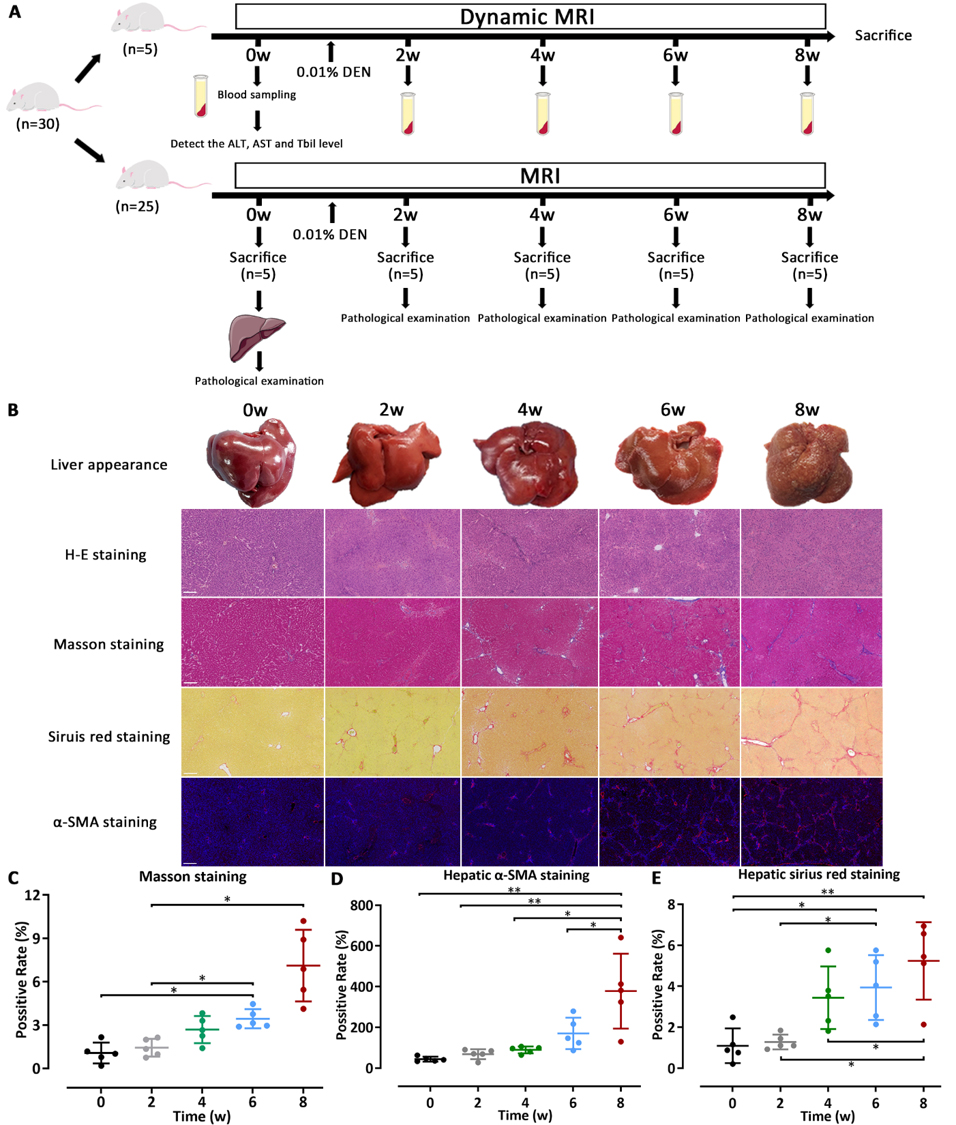
Figure 1. Schematic diagram of research flow and the establishment of animal model. (A) Schematic diagram showing the animal modeling experimental procedures. (B) The gross macroscopic apperaence, pathological evidence and histopathological analysis of the liver during the DEN induction.
DEN, dietondiethylnitrosamine
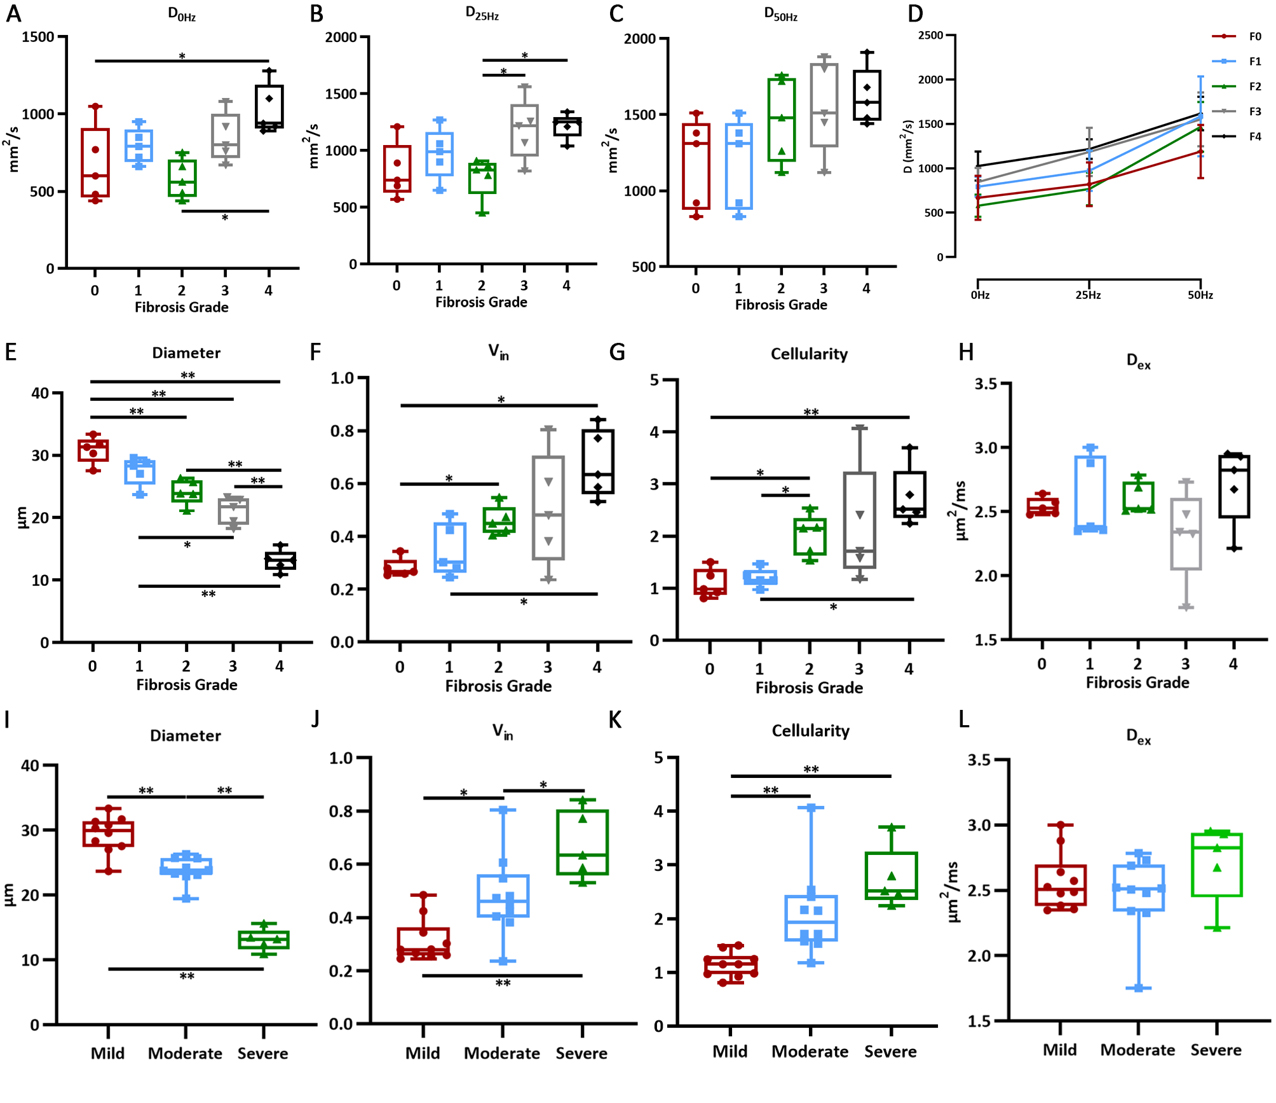
Figure 2. The changes of the IMPULSED-derived parameters according to the Metavir staging system and the clinical fibrosis grade. (A-D) The diffusivity measurement at 0 HZ, 25 HZ and 33 HZ. (E-H) The changes of diameter, Vin, cellularity and Dex according to the Metavir staging system. (I-L) The changes of diameter, Vin, cellularity and Dex according to the clinical fibrosis grade.
Vin, intracellular volume fraction. Dex, extracellular diffusivity.
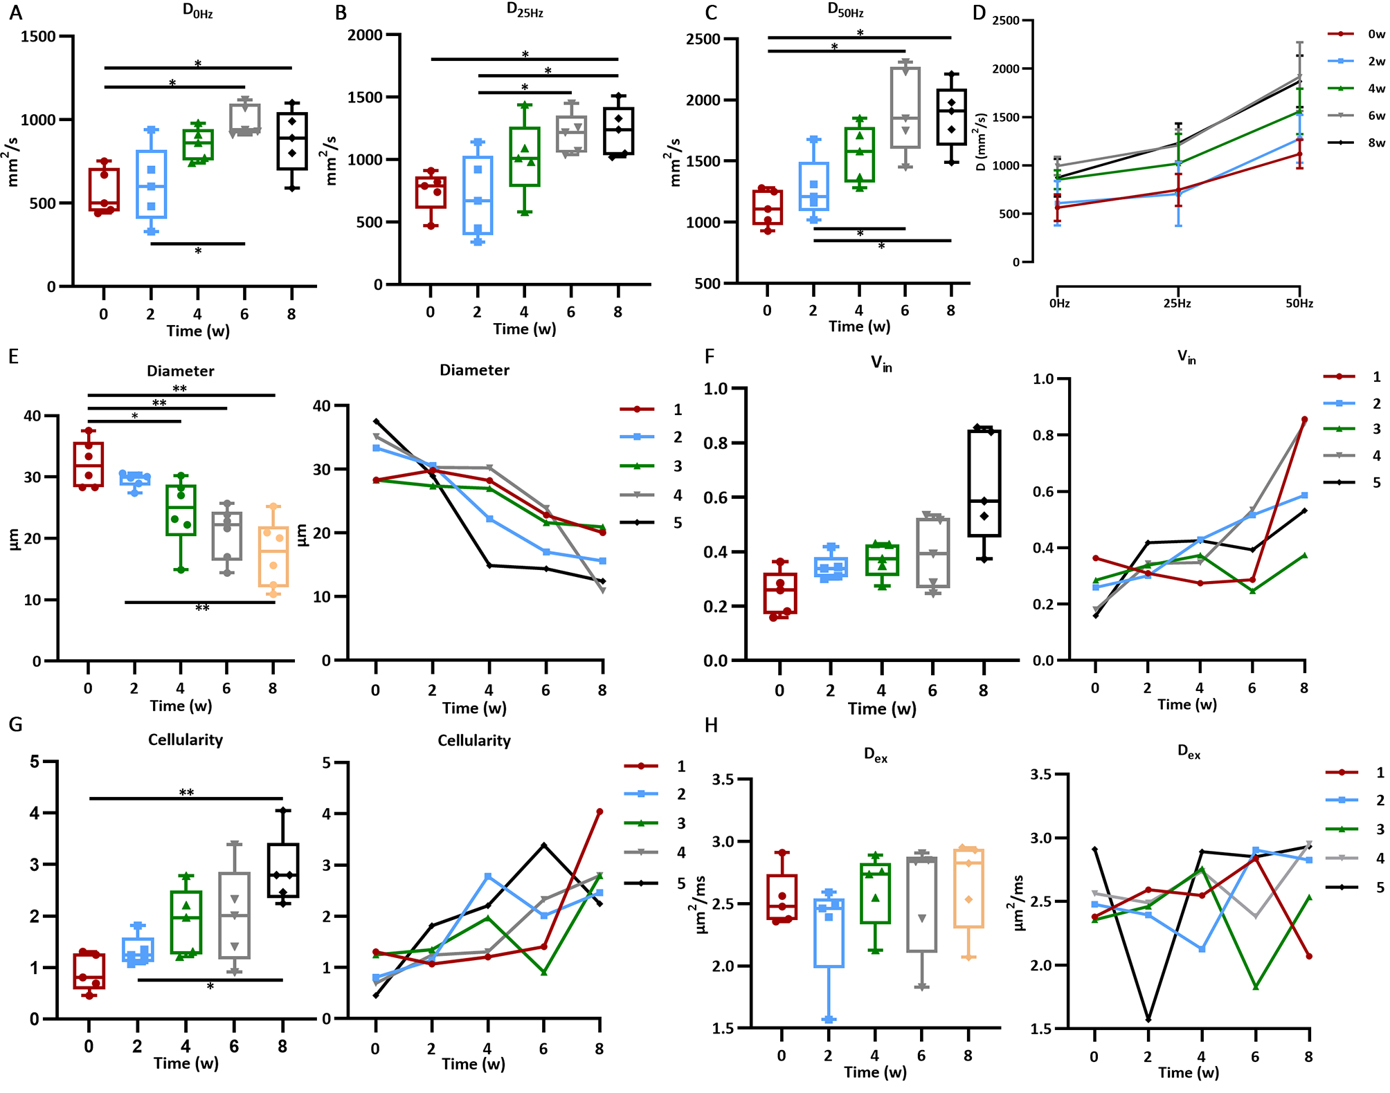
Figure 3. The changes of the IMPULSED-derived parameters according to the period of
DEN administration. (A-D) The diffusivity measurement at 0 HZ, 25 HZ and 33 HZ. (E-H) The changes of diameter, Vin, cellularity and Dex of Group-A and each rat in this group according to the time of induction.
Vin, intracellular volume fraction. Dex, extracellular diffusivity.
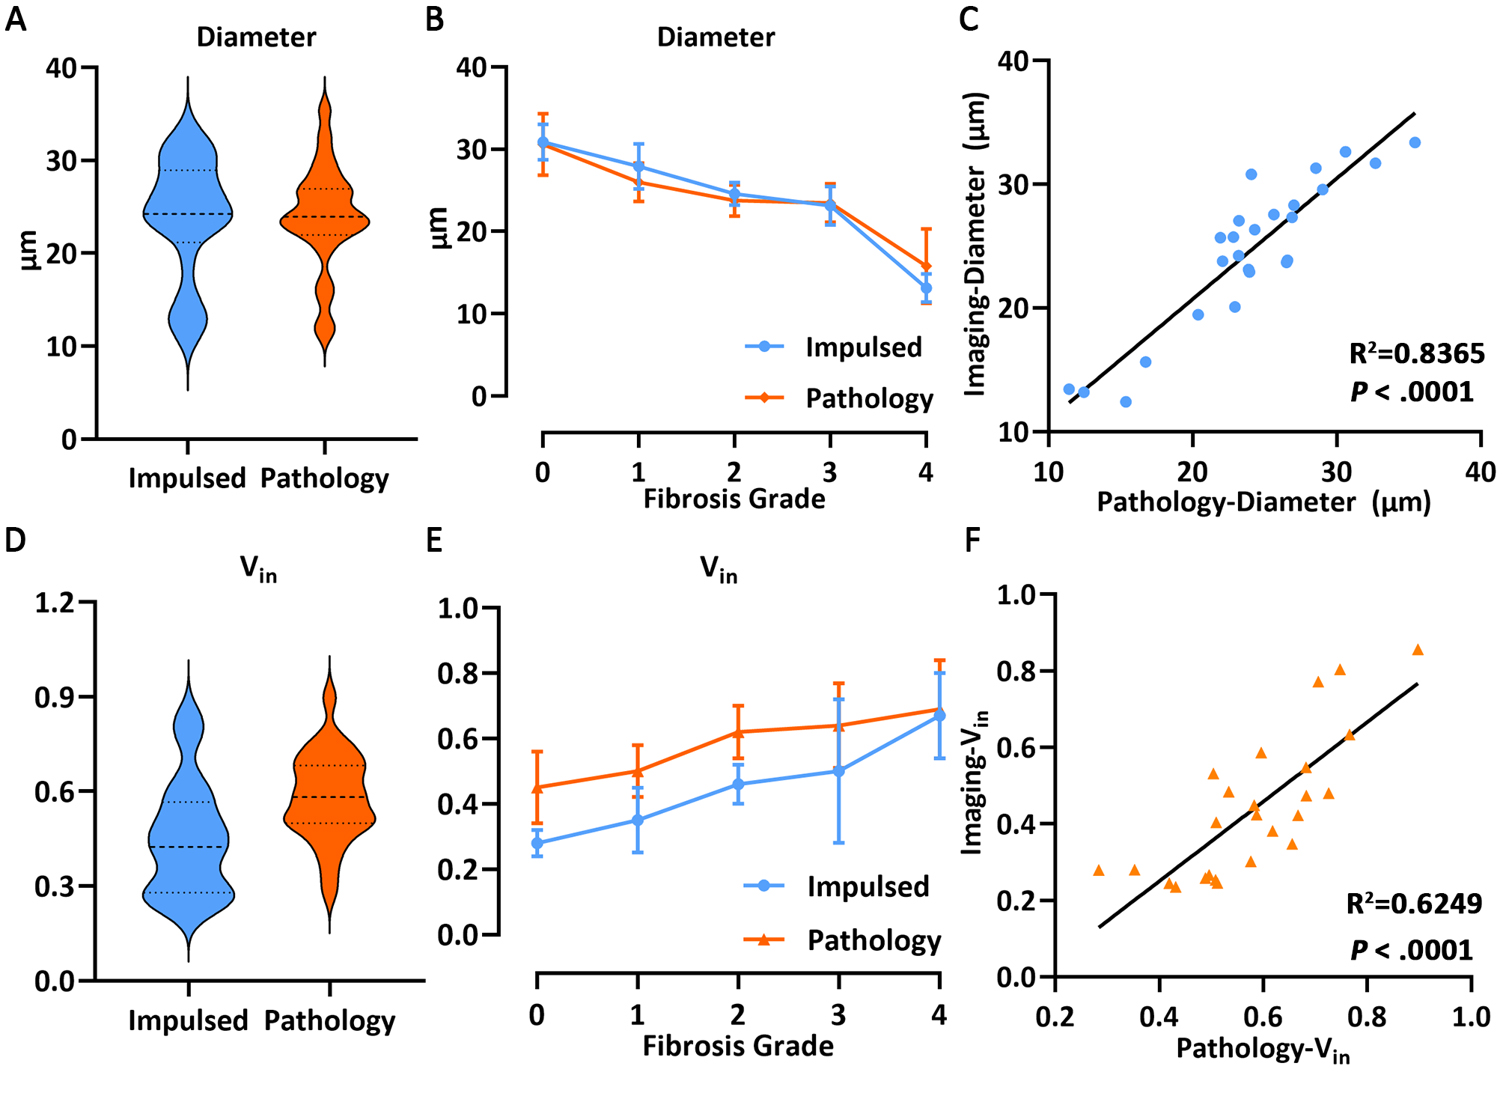
Figure 4. Correlation between IMPULSE and pathology. (A-C) The correlations between the diameter derived from the IMPULSED method and those derived from the pathology. (D-F) The correlations between the Vin derived from the IMPULSED method and those derived from the pathology.
Vin, intracellular volume fraction.