1358
Prandial Effects on 2D (b-M1) Optimized Intravoxel Incoherent Motion Quantification in the Liver1Radiology, University of Wisconsin-Madison, Madison, WI, United States, 2Medical Physics, University of Wisconsin-Madison, Madison, WI, United States
Synopsis
Keywords: IVIM, Velocity & Flow, Liver, Perfusion, Quantitative Imaging
Motivation: Food ingestion is known to increase blood flow in the liver. However, detection of prandial effects using conventional quantitative intravoxel incoherent motion (IVIM) methods is confounded by large measurement variability of the perfusion-related IVIM parameters.
Goal(s): Detect prandial-induced changes in IVIM estimates in the liver.
Approach: 2D (b-value and first-order motion moment (M1)) noise-optimized IVIM acquisitions were acquired pre- and postprandial. IVIM estimates were obtained using a recently proposed advanced fitting technique. Pre- vs postprandial IVIM estimates were compared.
Results: The optimized IVIM methods detected prandial-induced changes in the blood velocity standard deviation (mean relative change=9.4±7.8%; preprandial coefficient of variation=5.6%).
Impact: Quantitative IVIM is capable of detecting prandial-induced changes in blood perfusion in the liver. Liver IVIM data may need to be acquired in a fasting state, and evaluating prandial effects may provide insight into various diseases’ pathophysiological changes.
Introduction
Food ingestion is known to increase blood flow in several organs, including the liver. Therefore, prandial effects may affect quantitative intravoxel incoherent motion (IVIM) DWI, which quantifies parameters related to blood perfusion. Evaluating IVIM pre- vs postprandial may have diagnostic value as a non-invasive measure of liver perfusion. Previous studies have attempted to detect prandial effects using conventional IVIM.1,2 However, large measurement variability of the perfusion-related IVIM parameters may have obscured the effects.Recently, 2D (b-value and first-order motion moment (M1)) noise-optimized IVIM-DWI data acquisitions have been proposed,3 as well as Blood Velocity standard deviation Distribution (BVD) fitting.4 These methods have demonstrated improved stability,3 repeatability3,4 and reproducibility5 of IVIM quantification in comparison to conventional (b-value only) acquisitions and ROI-based fitting. Therefore, the purpose of this work was to evaluate prandial effects on quantitative IVIM using 2D (b-M1) data acquisitions and BVD fitting.
Methods
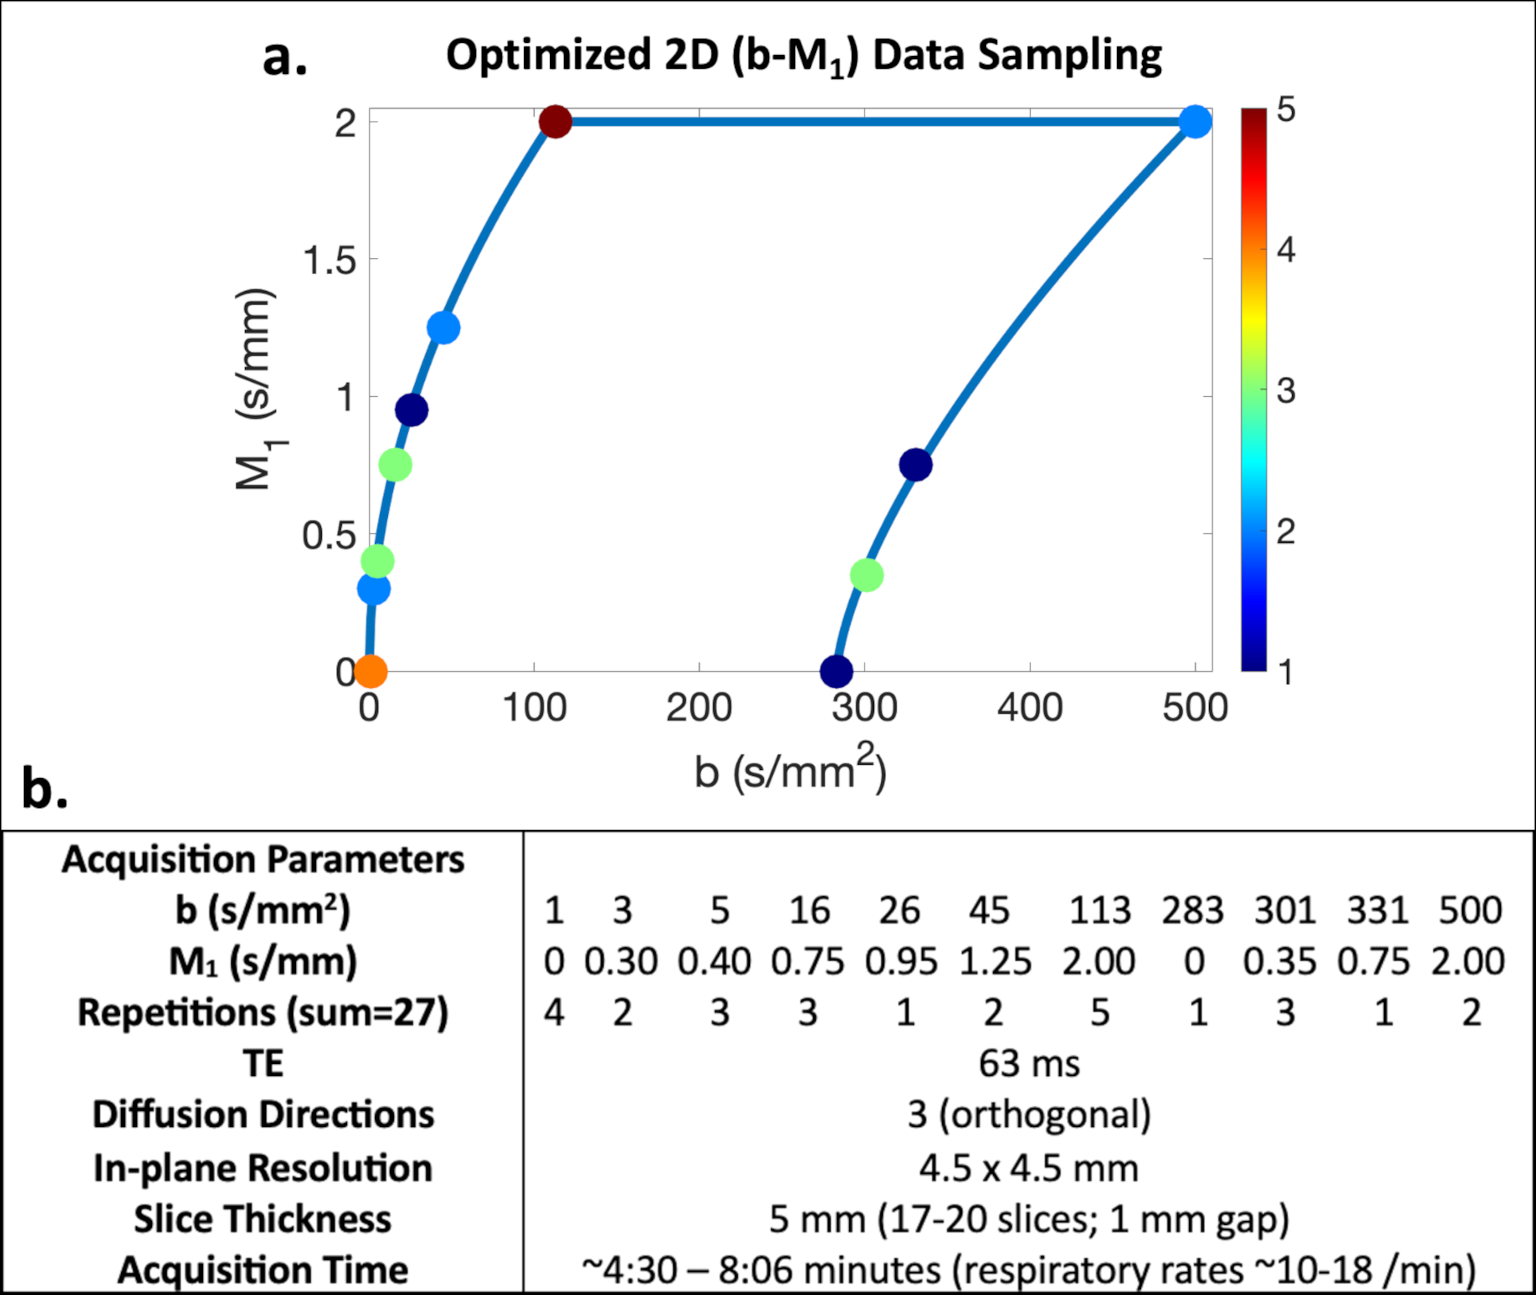
Acquisition optimization: Based on the physical IVIM signal model proposed by Ahlgren et al.6 (which accounts for b and M1 dependence), Cramer-Rao lower bound optimization was performed to determine a noise-optimized 2D (b-M1) IVIM-DWI data sampling (i.e., points in b-M1-space that can be realized using specifically-designed diffusion gradient waveforms) (Figure 1). During optimization, M1 was constrained to less than 2 s/mm to mitigate effects of physiological motion.MR acquisition: With IRB approval and informed consent, five (n=5) healthy subjects underwent two liver MRI (3T Signa Premier, GE Healthcare) exams in a single visit: one after fasting (minimum 5 hours) and one beginning ~20 minutes after ingesting Ensure Plus (Abbott Laboratories; 574 mL, 700 cal, 28% from fat, 57% from carbohydrates). Using respiratory triggering and the acquisition parameters given in Figure 1, the determined optimized 2D (b-M1) IVIM sampling was acquired four times: twice preprandial to evaluate repeatability and twice postprandial to evaluate temporal changes.
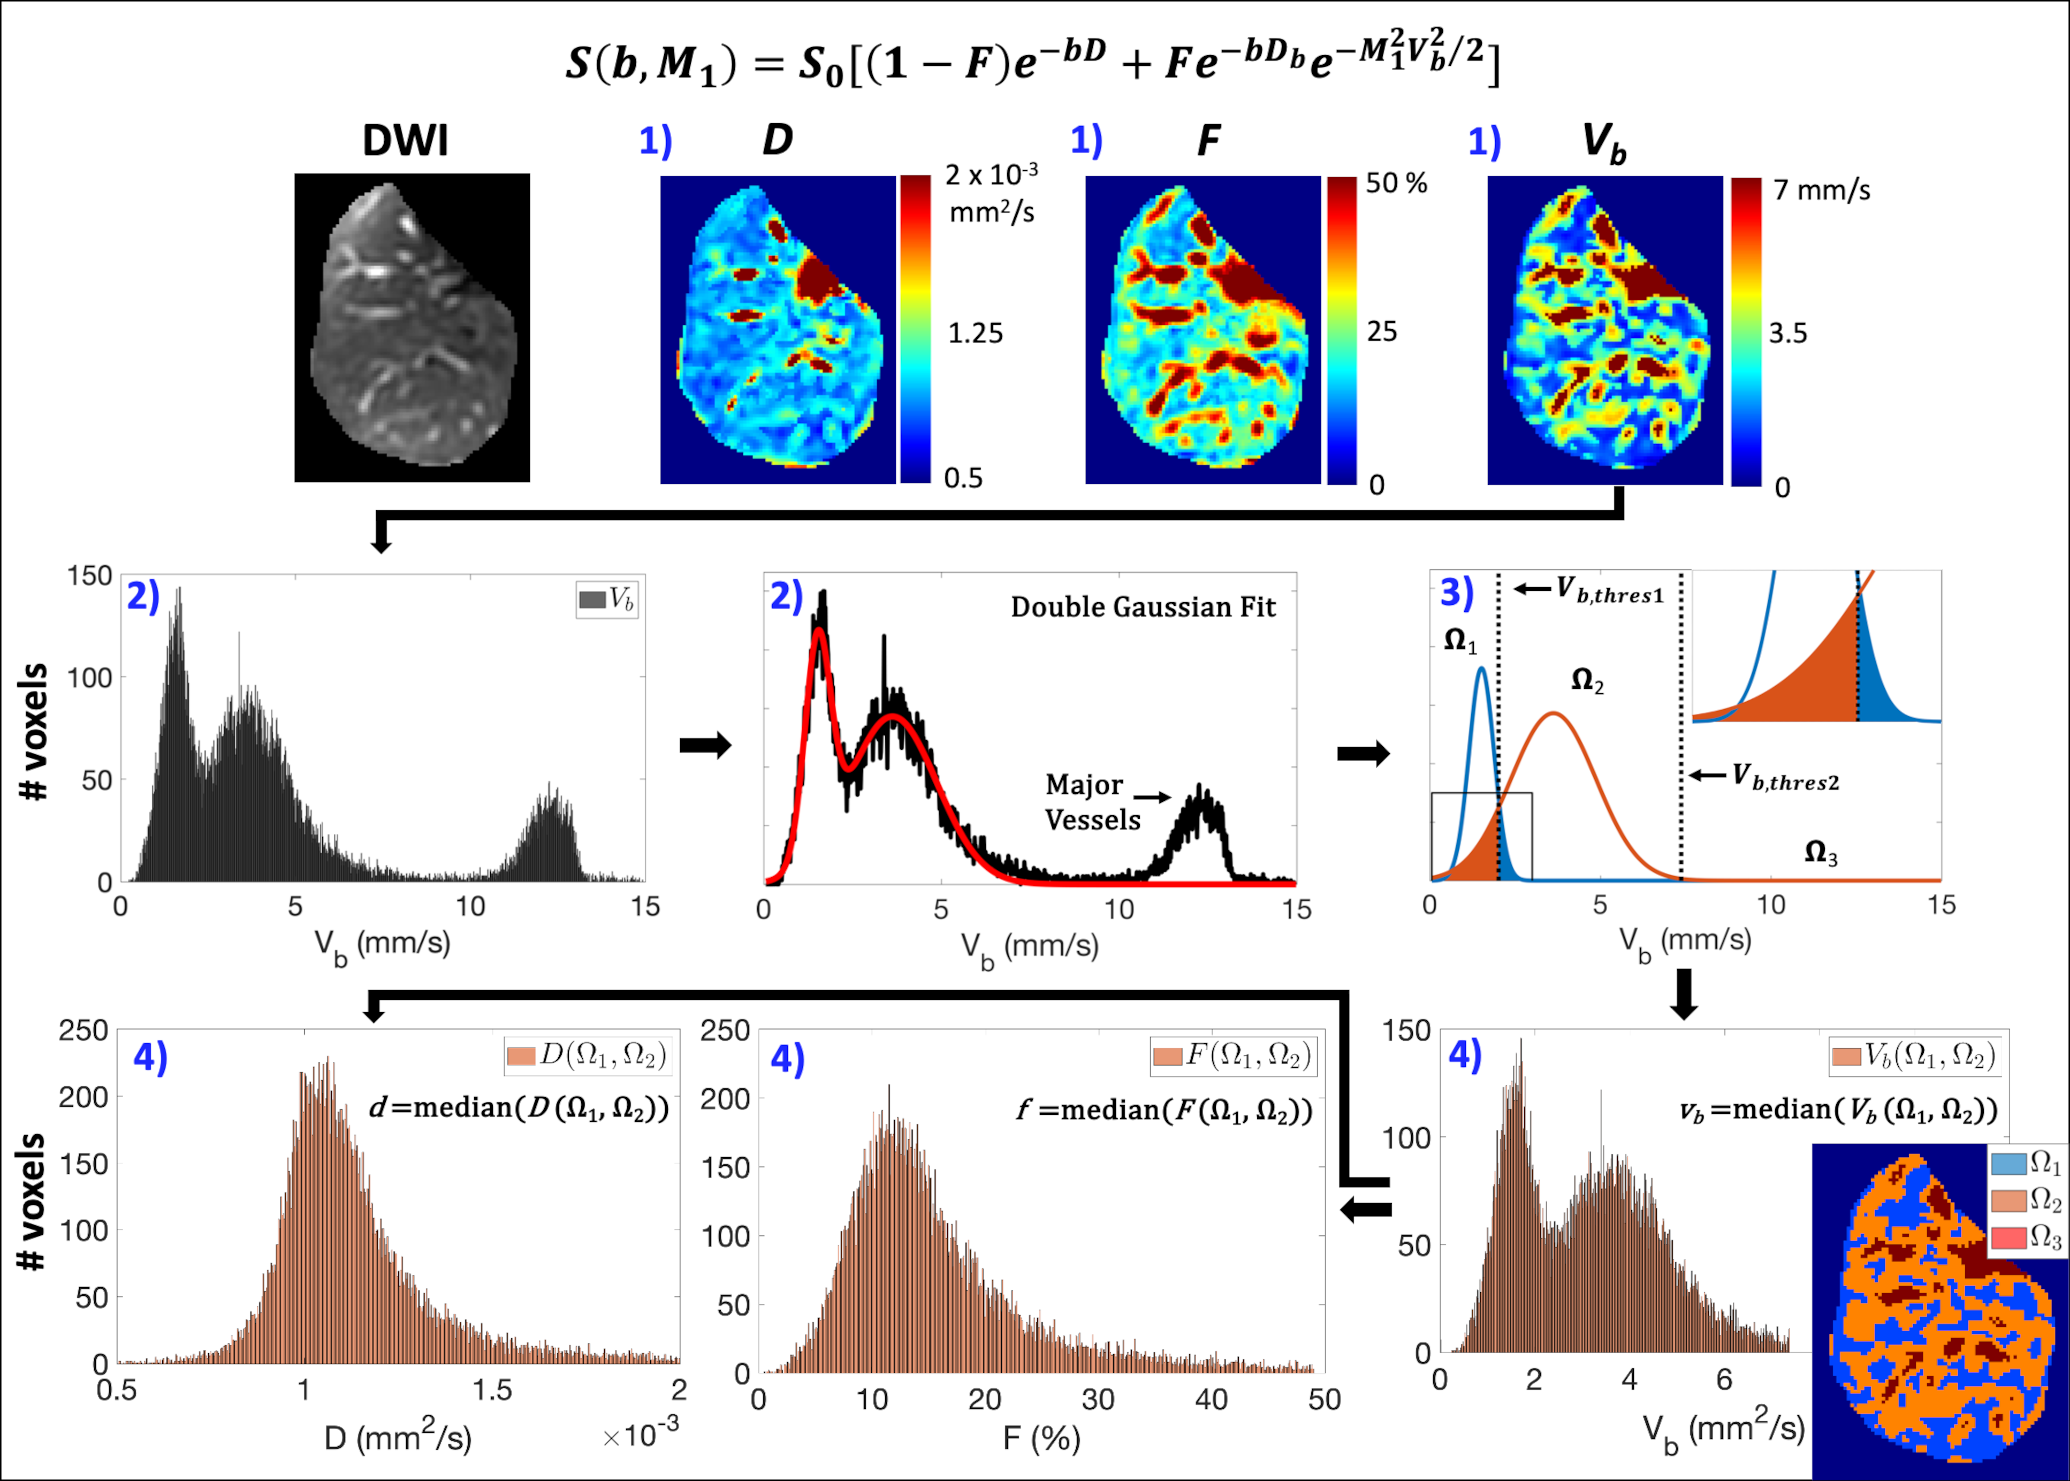
Data analysis: ROIs of the entire right liver lobe, including major vessels, were manually segmented. For each ROI, IVIM estimates were obtained from voxelwise bi-exponential parameter maps using BVD fitting,4 which estimates IVIM parameters within spatially distinct locations of the liver: Ω1 (slow perfusion), Ω2 (fast perfusion), and Ω3 (major vessels, which were excluded from further analysis) (see Figure 2 for details). IVIM estimates of Vb, perfusion fraction (F), and diffusion coefficient (D) were determined within Ω1 and Ω2 (vb=median(Vb(Ω1,Ω2)), f=median(F(Ω1,Ω2)), and d=median(D(Ω1,Ω2)), respectively).
Paired sample t-tests (significance level ⍺=0.05) were used to compare the liver volumes associated with Ω1, Ω2, and Ω3 and the IVIM estimates vb, f, and d across the four (pre- and postprandial) acquisitions. Using the estimates from the two preprandial acquisitions, coefficient of variation (CV) was determined for each parameter. Mean relative changes (pre- vs postprandial) were also determined.
Results
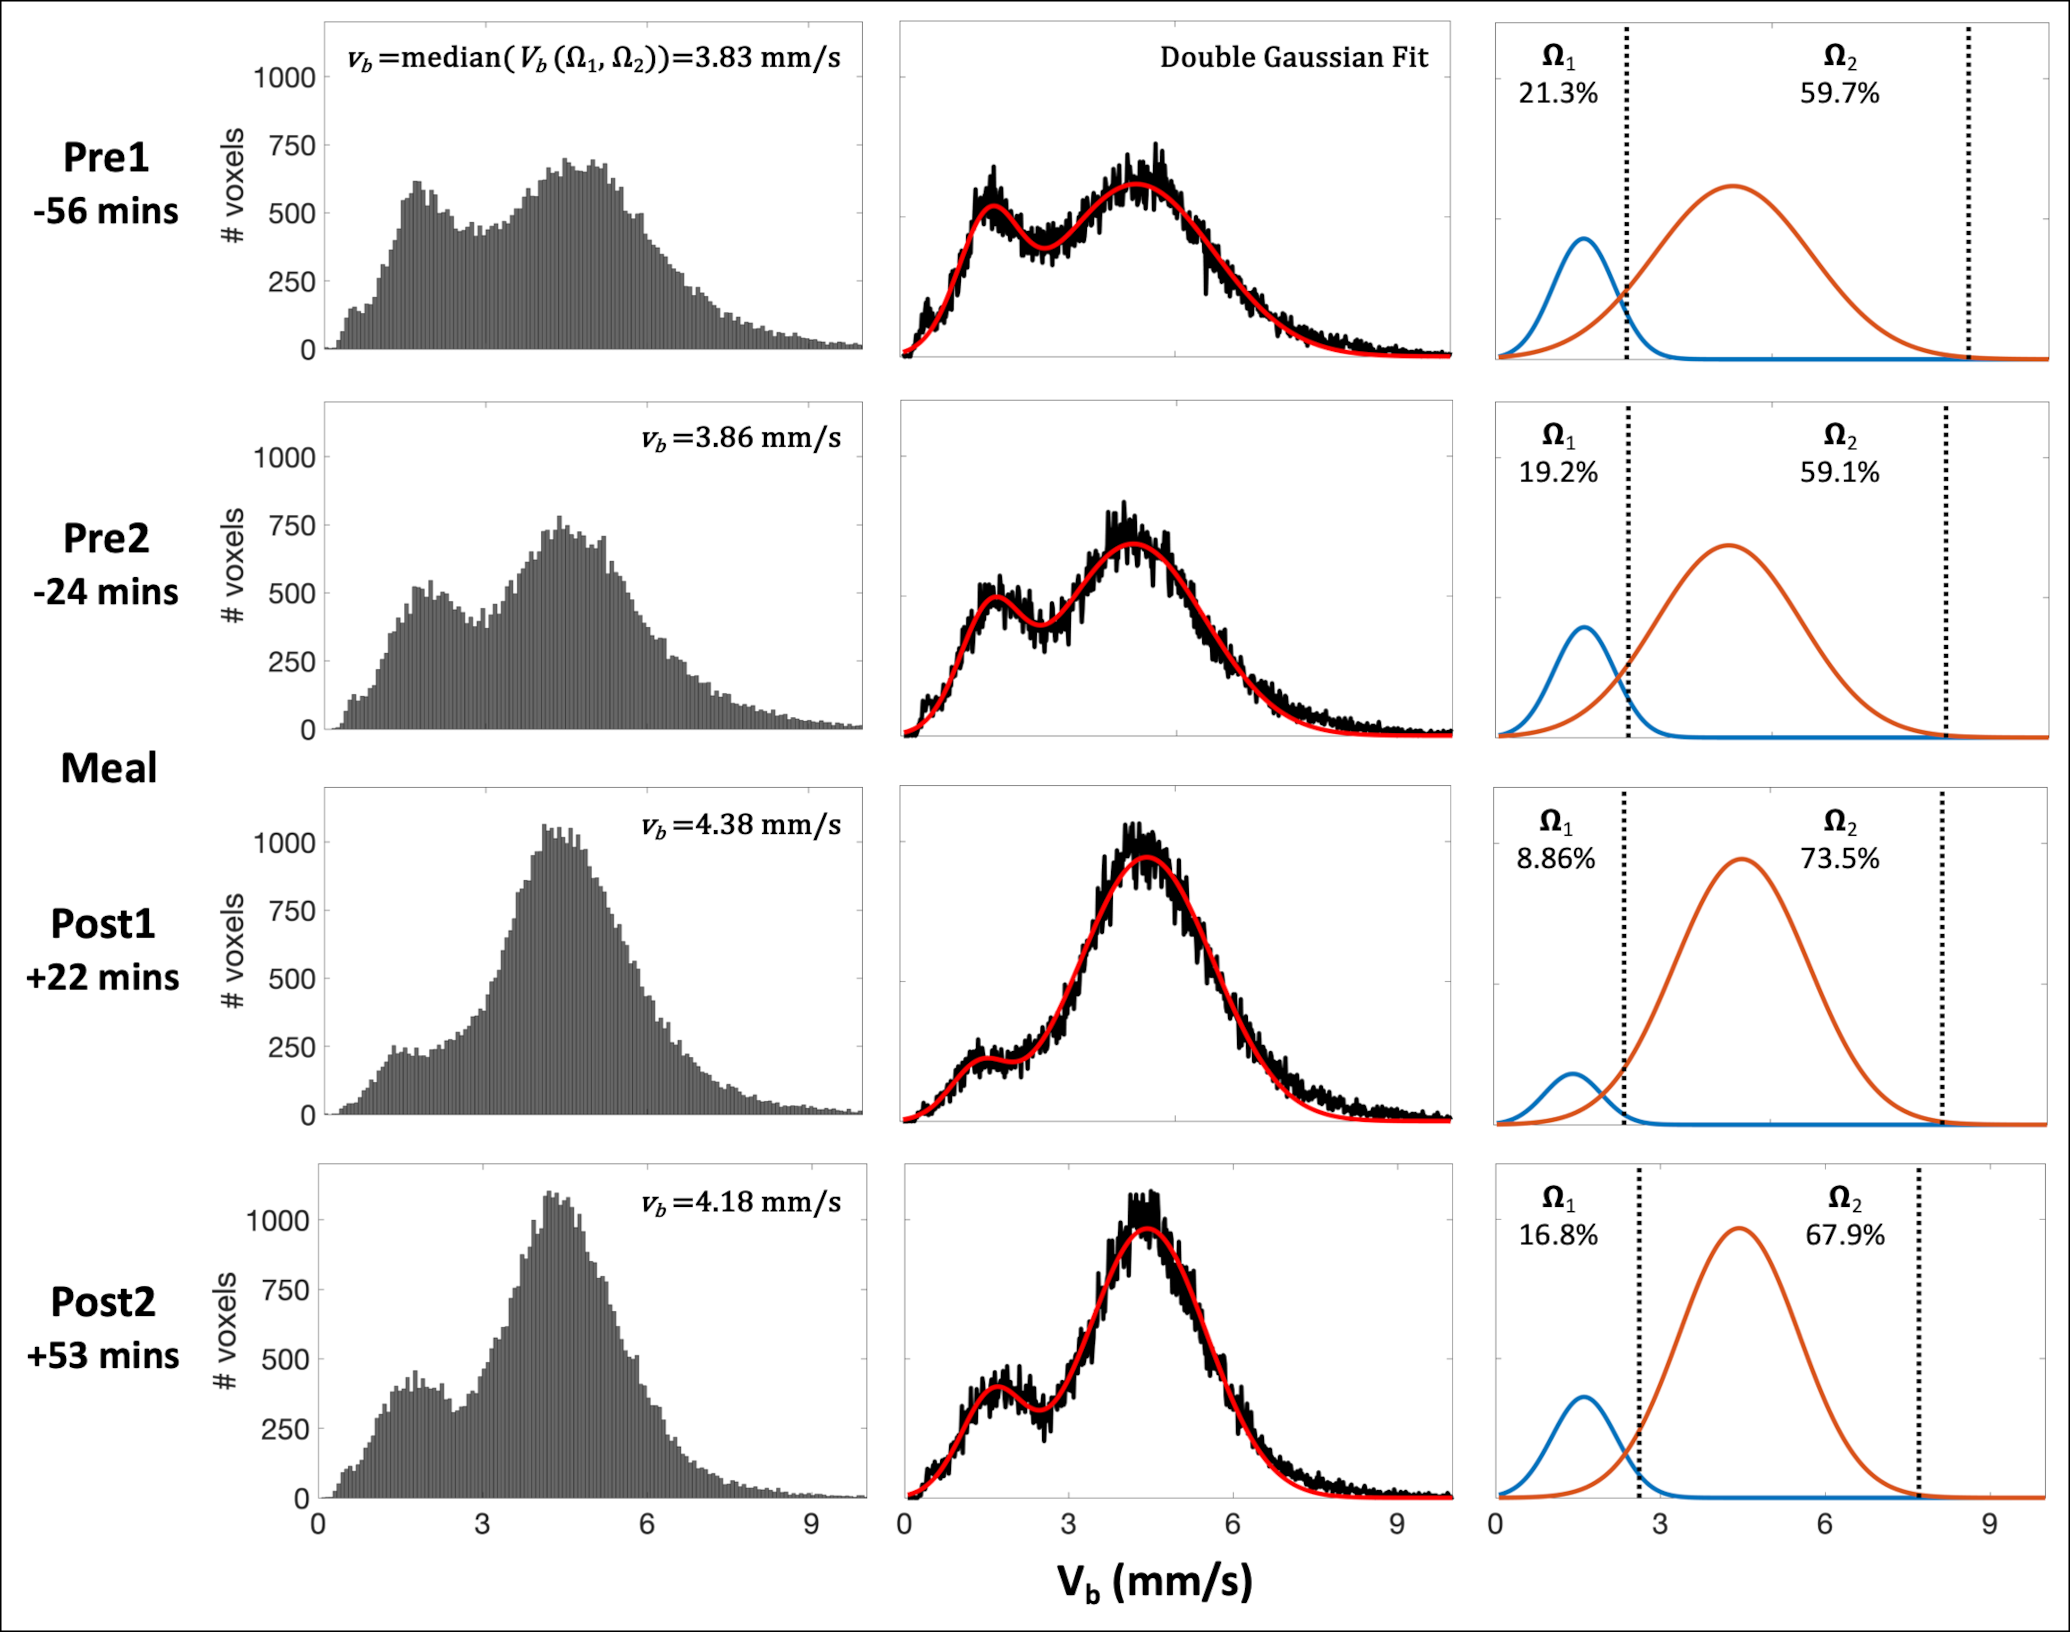
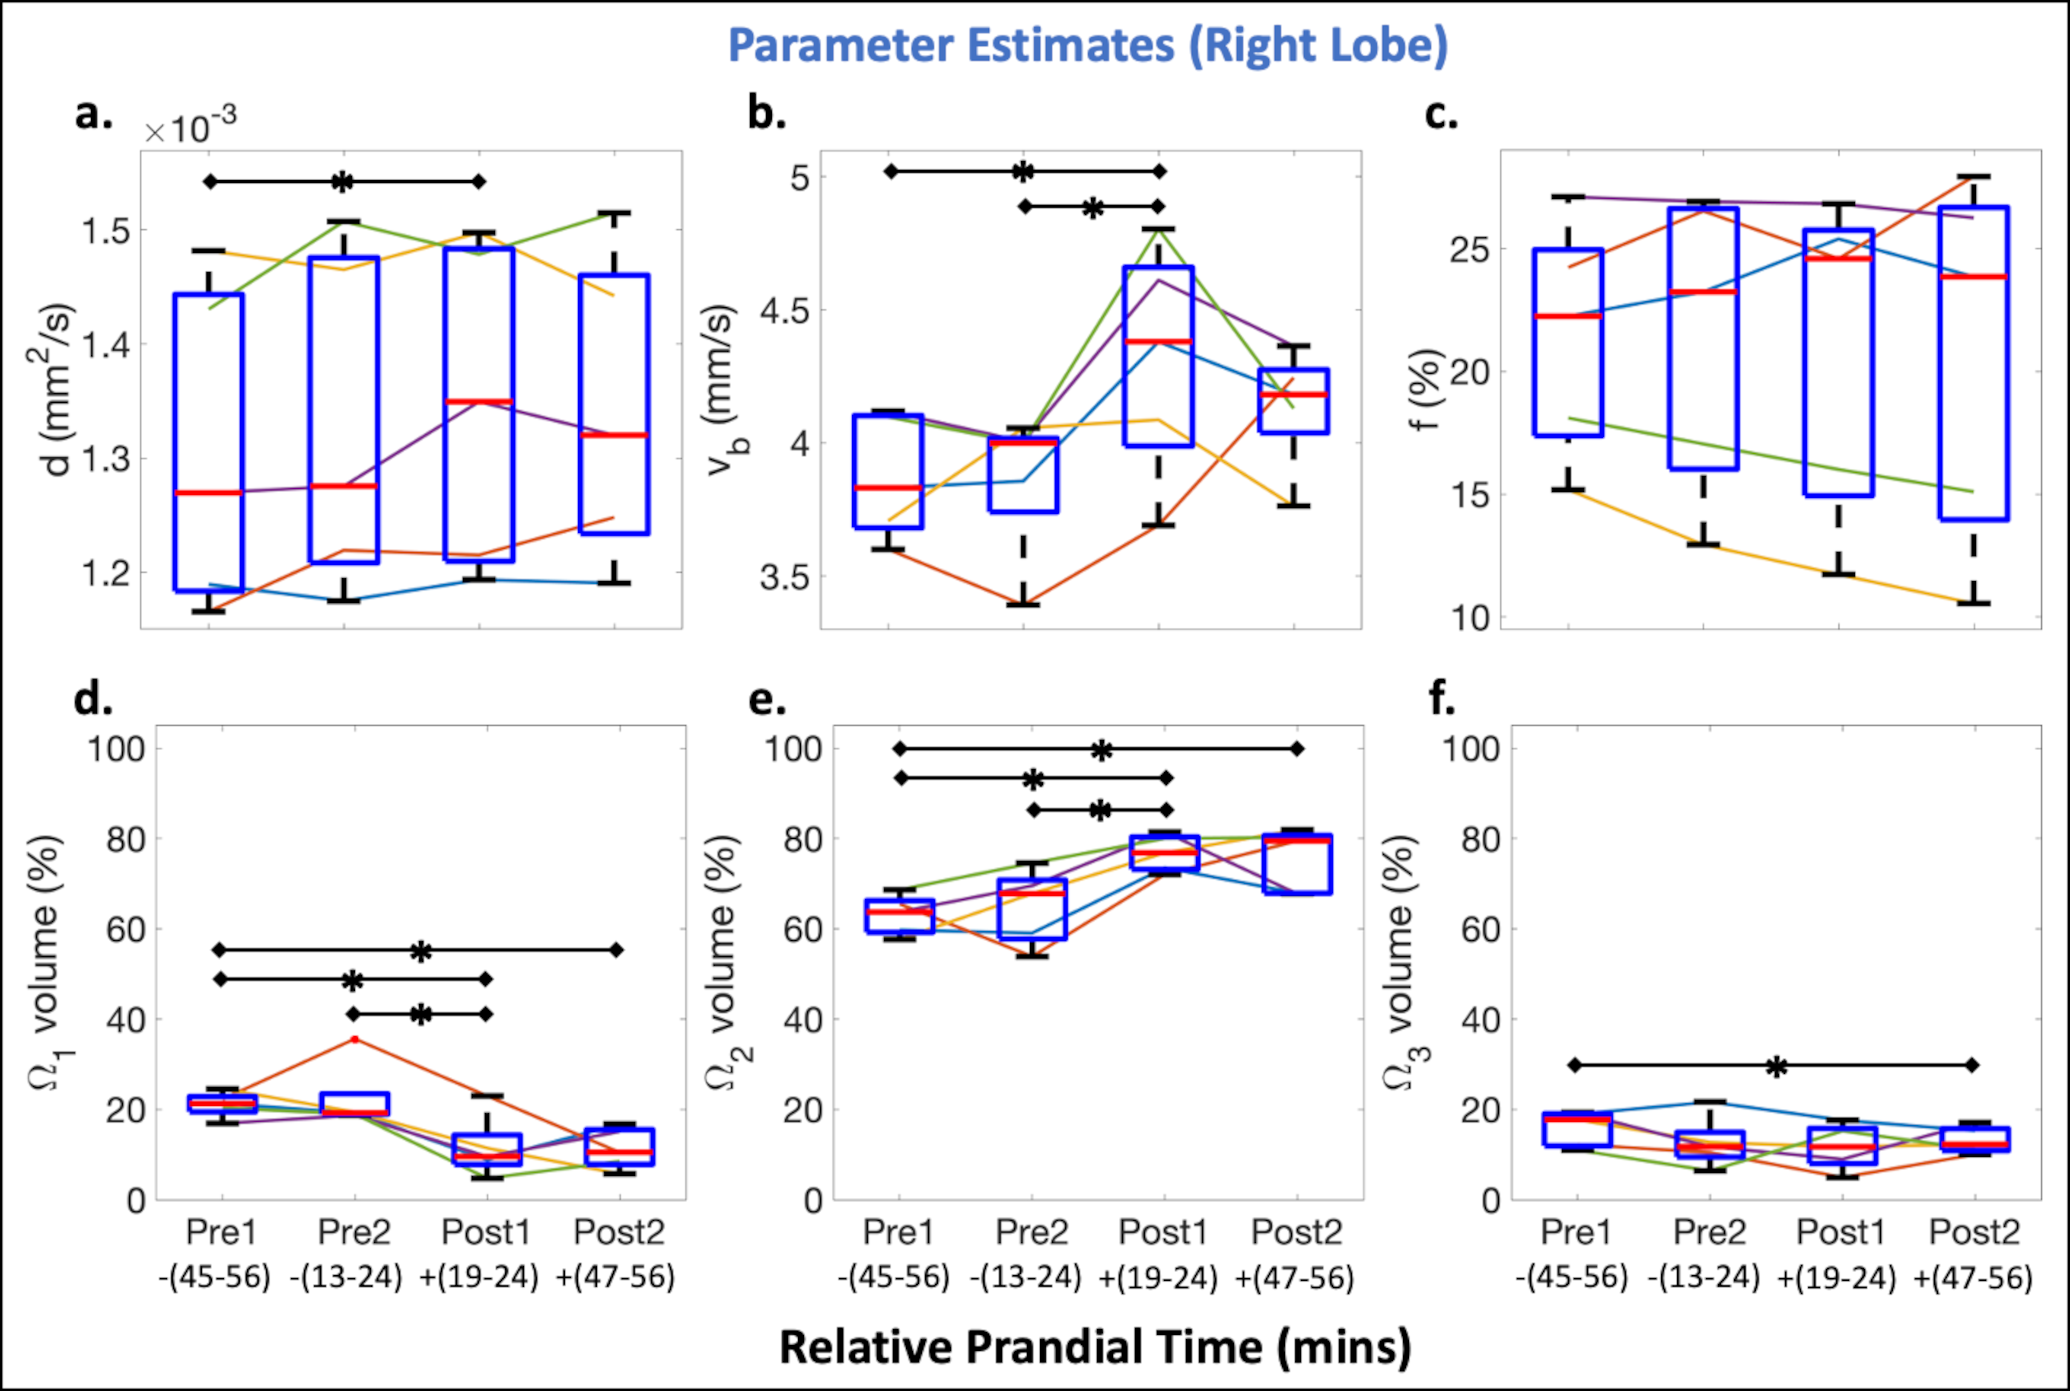
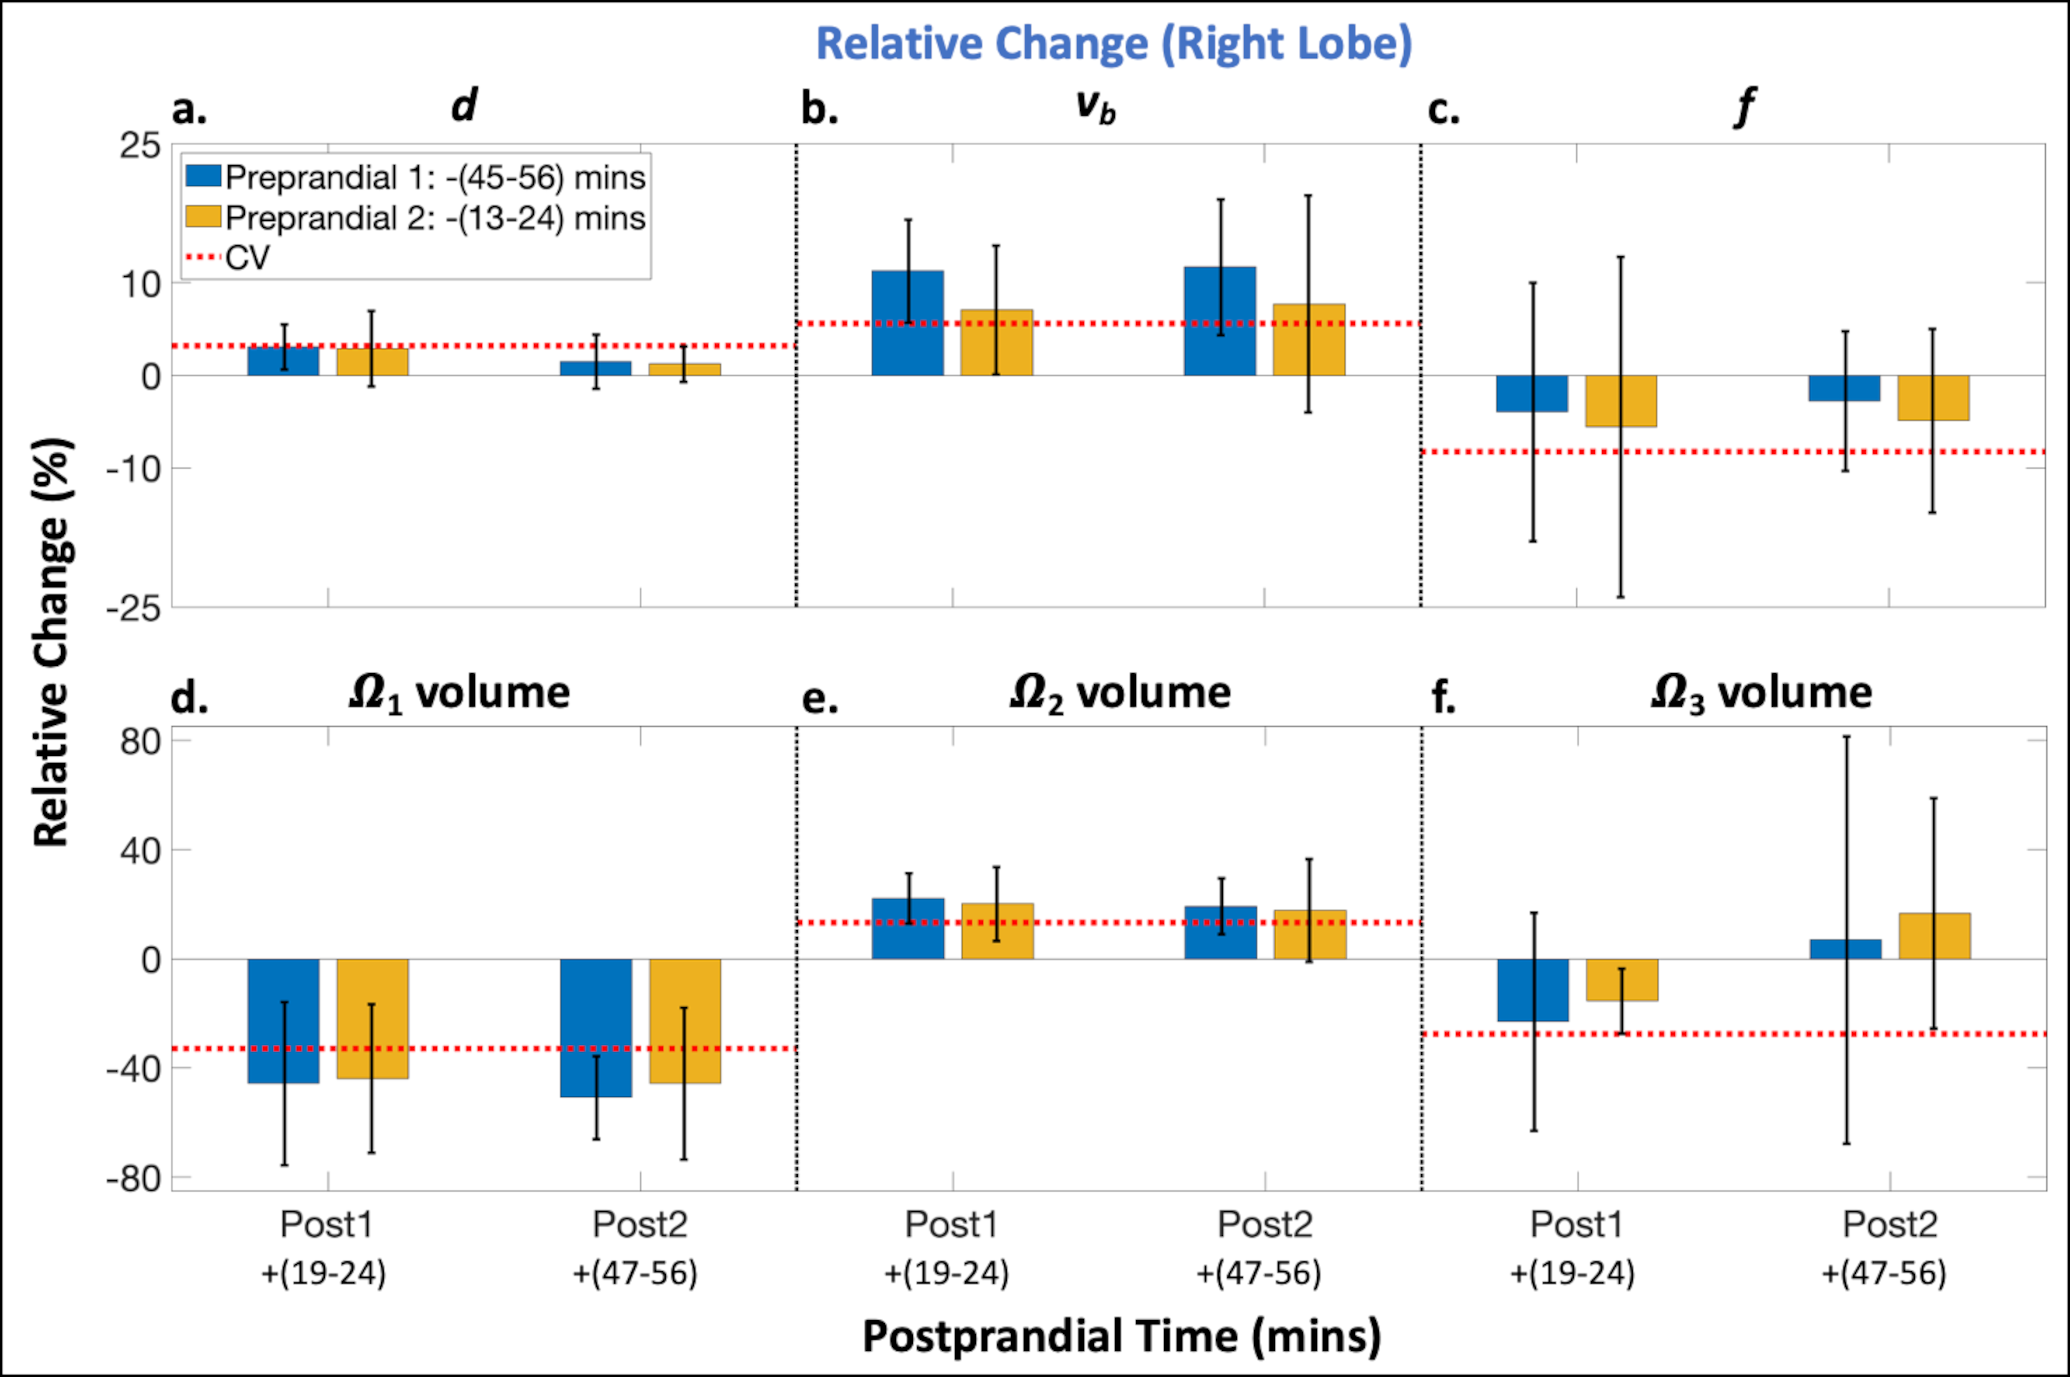
Representative histograms of Vb for each pre- and postprandial timepoint from a single subject are shown in Figure 3 and demonstrate prandial effects on Vb. Across all subjects, significant (p<0.05) increases in vb and Ω2 volume and a significant decrease in Ω1 volume was observed 19-24 minutes postprandial compared to both preprandial timepoints (Figure 4b,d,e).At both postprandial timepoints, changes in vb, Ω1 volume, and Ω2 volume were observed compared to both preprandial timepoints (mean relative changes >7.1, -43.9, and 17.7%, respectively, were greater than the corresponding CVs=5.6, 32.9, and 13.3%) (Figure 5b,d,e). No changes were observed in estimates of d, f, or Ω3 volume (mean relative changes < 3.1, 5.6, and 23.1%, respectively, were less than the corresponding CVs=3.2, 8.3, and 27.5%) (Figure 5a,c,f).
Discussion
In this work, optimized IVIM methods detected prandial-induced changes in blood perfusion (i.e., Vb) in the liver, while no changes were observed in diffusion estimates. This suggests that IVIM data may need to be acquired in a controlled fasting state to avoid confounding prandial effects and potentially improve the diagnostic performance of quantitative IVIM. Evaluation of prandial effects on quantitative IVIM parameters may also provide insight into various diseases, such as cirrhosis7 and portal hypertension,8 and their associated pathophysiological changes.Several works have evaluated prandial effects on blood perfusion in the liver using 4D flow MRI.8,9 However, 4D flow is only capable of quantification in larger vessels due to limited spatial resolution, whereas IVIM measures parameters related to microcirculatory perfusion and tissue microstructure. Therefore, the two may provide complementary information, potentially improving diagnostic performance.
Limitations of this work include a small sample size of healthy volunteers only and using a large voxel size during acquisition, which may be adequate for evaluation of diffuse liver disease, but inadequate for focal disease.
Conclusion
Optimized quantitative IVIM is capable of detecting prandial-induced changes in blood perfusion in the liver.Acknowledgements
The authors acknowledge support from the NIH (R01-EB030497), the University of Wisconsin-Madison Office of the Vice Chancellor for Research and Graduate Education with funding from the Wisconsin Alumni Research Foundation, as well as from the UW Departments of Radiology and Medical Physics. GE Healthcare also provides research support to the University of Wisconsin.References
1. Jajamovich GH, Dyvorne H, Donnerhack C, Taouli B. Quantitative liver MRI combining phase contrast imaging, elastography, and DWI: assessment of reproducibility and postprandial effect at 3.0 T. PloS one. 2014;9(5):e97355.
2. Regini F, Colagrande S, Mazzoni LN, et al. Assessment of liver perfusion by intravoxel incoherent motion (IVIM) magnetic resonance–diffusion-weighted imaging: correlation with phase-contrast portal venous flow measurements. Journal of computer assisted tomography. 2015;39(3):365-372.
3. Simchick G, Geng R, Zhang Y, Hernando D. b value and first‐order motion moment optimized data acquisition for repeatable quantitative intravoxel incoherent motion DWI. Magnetic Resonance in Medicine. 2022;87(6):2724-2740.
4. Simchick G, Hernando D. Precision of region of interest‐based tri‐exponential intravoxel incoherent motion quantification and the role of the Intervoxel spatial distribution of flow velocities. Magnetic Resonance in Medicine. 2022;88(6):2662-2678.
5. Simchick G, Allen T, Hernando D. Multi-Scanner Reproducibility of IVIM Quantification in the Liver using Pseudo-Diffusion and Physical IVIM Signal Models. In Proceedings of the 31th Annual Meeting of ISMRM, Toronto. 2023.
6. Ahlgren A, Knutsson L, Wirestam R, et al. Quantification of microcirculatory parameters by joint analysis of flow‐compensated and non‐flow‐compensated intravoxel incoherent motion (IVIM) data. NMR in Biomedicine. 2016;29(5):640-649.
7. Cox EF, Palaniyappan N, Aithal GP, Guha IN, Francis ST. MRI assessment of altered dynamic changes in liver haemodynamics following a meal challenge in compensated cirrhosis. European Radiology Experimental. 2018;2(1):1-11.
8. Roldán‐Alzate A, Frydrychowicz A, Said A, et al. Impaired regulation of portal venous flow in response to a meal challenge as quantified by 4D flow MRI. Journal of Magnetic Resonance Imaging. 2015;42(4):1009-1017.
9. Cox EF, Palaniyappan N, Aithal GP, Guha IN, Francis ST. Using MRI to study the alterations in liver blood flow, perfusion, and oxygenation in response to physiological stress challenges: Meal, hyperoxia, and hypercapnia. Journal of Magnetic Resonance Imaging. 2019;49(6):1577-1586.
Figures