1355
High Fidelity Imaging of Tissue Heterogeneity, Micro-Anisotropy and Diffusion-Time Effects in Prostate Cancer1Medical Radiation Physics, Lund University, Lund, Sweden, 2Cardiff University Brain Research Imaging Centre, Cardiff University, Cardiff, United Kingdom, 3Leeds Institute of Cardiovascular and Metabolic Medicine, University of Leeds, Leeds, United Kingdom, 4Danish Research Centre for Magnetic Resonance, Centre for Functional and Diagnostic Imaging and Research, Copenhagen University Hospital Amager and Hvidovre, Copenhagen, Denmark, 5Diagnostic Radiology, Clinical Sciences Lund, Lund University, Lund, Sweden, 6Image Sciences Institute, University Medical Center Utrecht, Utrecht, Netherlands
Synopsis
Keywords: Microstructure, Microstructure, Signal Representations, Prostate
Motivation: Clinical diffusion MRI for prostate cancer diagnosis has limited sensitivity and specificity to heterogenous microstructural changes.
Goal(s): Quantify time-dependent diffusion and diffusional variance at a high spatial resolution in human prostate in vivo.
Approach: The diffusion encoding waveforms were tailored to probe micro-anisotropy and diffusion time effects at high b-values. Ultra-strong gradients and spiral readout enabled high-resolution and high image fidelity at a high SNR.
Results: Significant time-dependent diffusion was observed in all diffusion parameters in three volunteers, including prostate cancer patients.
Impact: The proposed methodology enables evaluation of microscopic anisotropy and time-dependent diffusion in the prostate and provides insights into how dMRI should be interpreted at low and high b-values. The produced diffusion parameters may serve as biomarker candidates in future studies.
Introduction
Tensor-valued diffusion encoding enables a more comprehensive description of tissue microstructure than conventional diffusion encoding1. Optimized diffusion-encoding waveforms are highly efficient but exhibit different encoding frequencies, i.e., effective diffusion times2,3. If studied tissue contains restrictions on multiple scales, diffusion time effects may cause erroneous interpretation/quantification of its features2,4. An excellent example of this is the prostate where time-dependent diffusion has been demonstrated5 and exploited to better depict its microstructure6. Therefore, in the prostate, the application of tensor-valued diffusion-encoding requires careful attention to diffusion times across different b-tensors.We demonstrate for the first time an experimental design and analysis that accounts for diffusion time effects when using tensor-valued diffusion-encoding in the human prostate in vivo. To enable this technical challenge, we leveraged efficient diffusion-encoding waveforms7,8, spiral readout9,10, advanced image reconstruction11,12 with field monitoring13, and ultra-strong gradients14,15.
Methods
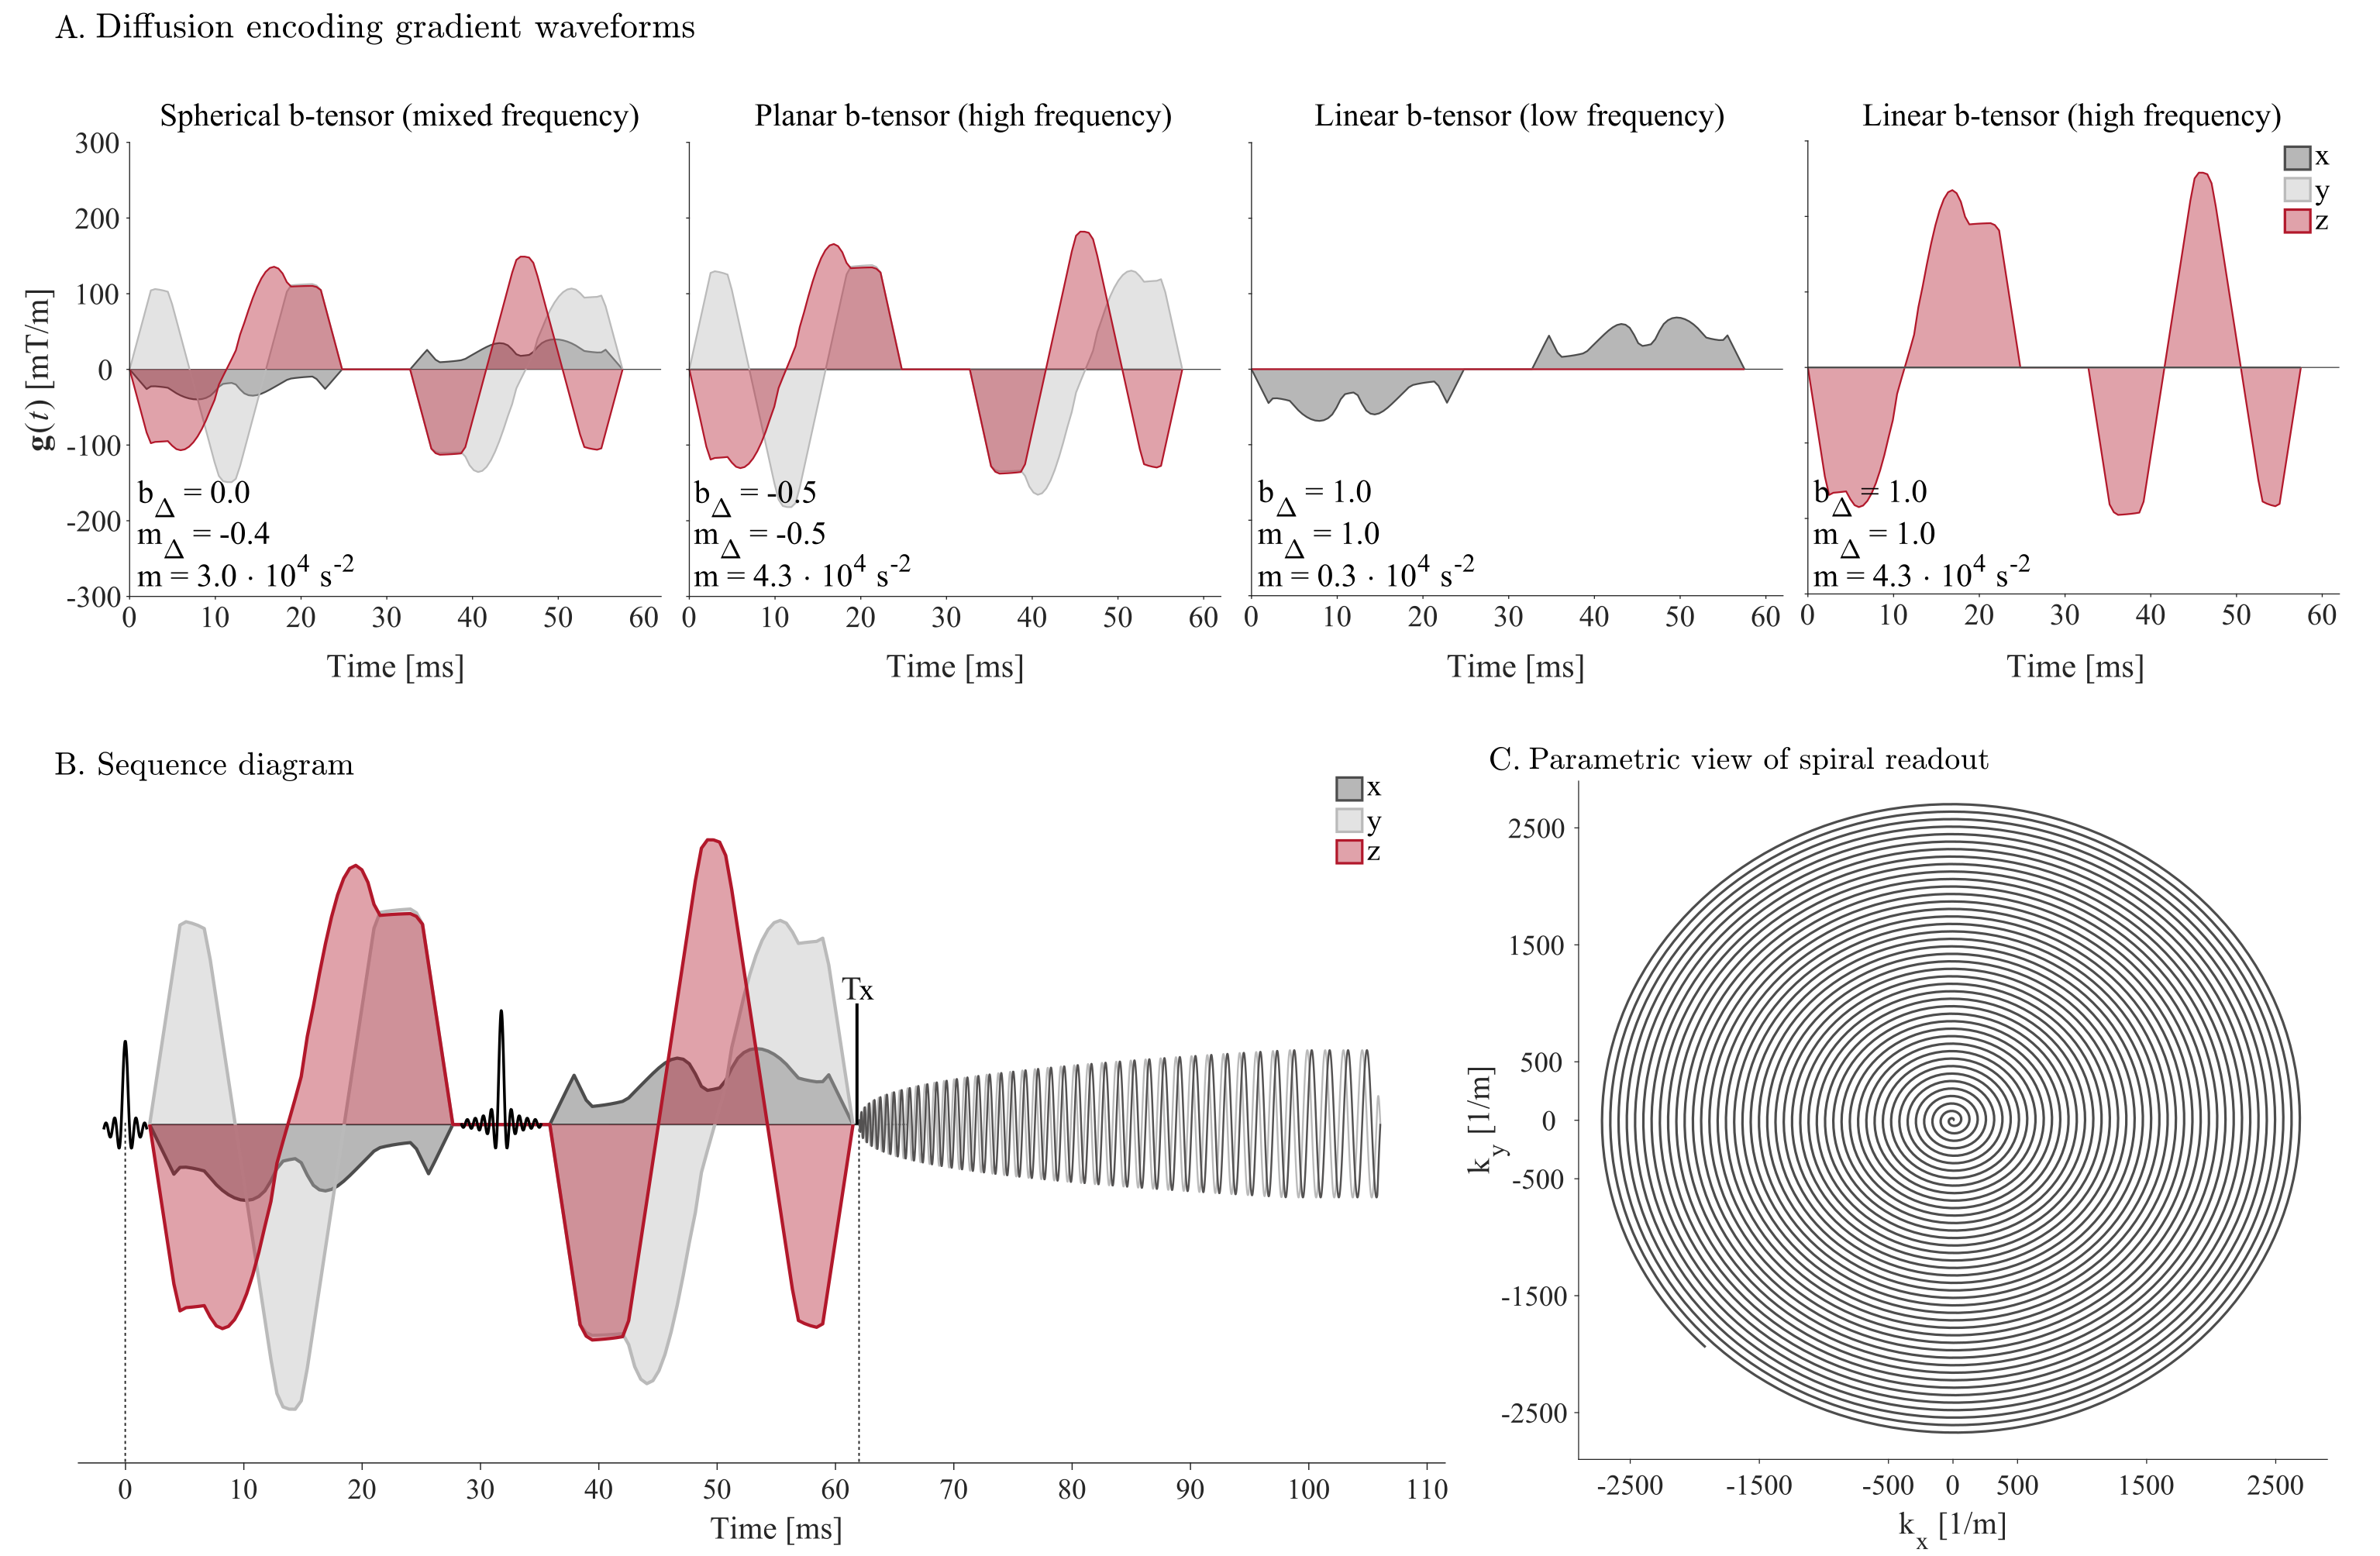
Study cohort: We scanned one healthy control (35y) and two patients (67 and 73y) with biopsy-confirmed cancers (Gleason grade 3+3, low-grade) with prior ethical approval.Diffusion-encoding waveforms: The waveforms (Fig.1) were designed to modulate the b-tensor ($$$\textbf{B}$$$)16 and the “m-tensor” ($$$\textbf{M}$$$)3. $$$\textbf{M}$$$ describes the variance of the encoding frequency spectra; high values correspond to short diffusion time and high frequencies. Across waveforms, we modulate:
1) the diffusion-weighting ($$$b=\mathrm{Tr(\textbf{B})}$$$),
2) the b-tensor “shape”/ “anisotropy” ($$$b_\Delta$$$)17
3) restriction weighting ($$$m=\mathrm{Tr(\textbf{M})}$$$), and
4) the m-tensor shape ($$$m_\Delta$$$, related to the spectral anisotropy)3.
The waveforms for spherical b-tensor encoding were obtained by numerical optimization18 with additional constraints that yield an approximately axisymmetric m-tensor8. Additional waveforms were derived from the first by selecting subsets from it (Fig.1). Obtained four waveforms provide four unique combinations of $$$b_\Delta$$$, $$$m$$$, and $$$m_\Delta$$$.
MRI data acquisition: Images were acquired on a 3T Connectom research-only scanner (Siemens Healthcare, Erlangen, Germany).
Multi-echo GRE images were used to estimate $$$B_0$$$-maps and coil sensitivities.
Diffusion MRI was performed with a prototype pulse sequence that enables user-defined diffusion- and spatial-encoding waveforms19 (Fig.1). Diffusion-encoding waveforms were scaled to yield b = [0, 0.1, 0.7, 1.4, 2] ms/μm2 in [5, 4, 6, 15, 20] rotations, respectively. The readout was accomplished with spirals20 to yield acceleration factor=2.24, voxel size=1.15×1.15×5 mm3, TE=62 ms, TR=3 s, #slices=18, and a scan time of 10:30 min.
Image reconstruction: Data were reconstructed using an “expanded encoding model”11,12,21,22 including static $$$B_0$$$ and higher order field23,24, measured with a field-camera (Skope Magnetic Resonance Technologies)13.
Post-processing and parameter estimation: Complex data was denoised25,26, motion-corrected27 and smoothed (2D-Gaussian, σ=0.7 mm). The signal representation was based on Lundell and Lasic3
$$log\left(\frac{S}{S_0}\right)=-b(D+mD_r)+\frac{b^2}{2}(V_I+m^2 V_{I_r})+\frac{b^2}{2}(b_∆^2V_A+m^2m_Δ^2V_{A_r})$$
where the long-time (zero-frequency) parameters are the apparent mean diffusivity ($$$D$$$), variance of isotropic diffusivities ($$$V_I$$$), and the variance due to microscopic diffusion anisotropy ($$$V_A$$$)1,28; parameters with subscript $$$“r”$$$ denote how fast each changes with the restriction weighting. We display parameters at zero-frequency (no subscript) and high-frequency (subscript hf, e.g., $$$D_{hf}=D+mD_r$$$), or their difference (prefix $$$\Delta$$$, e.g., $$$\Delta{D}=m_{max}D_r$$$).
Results & Discussion
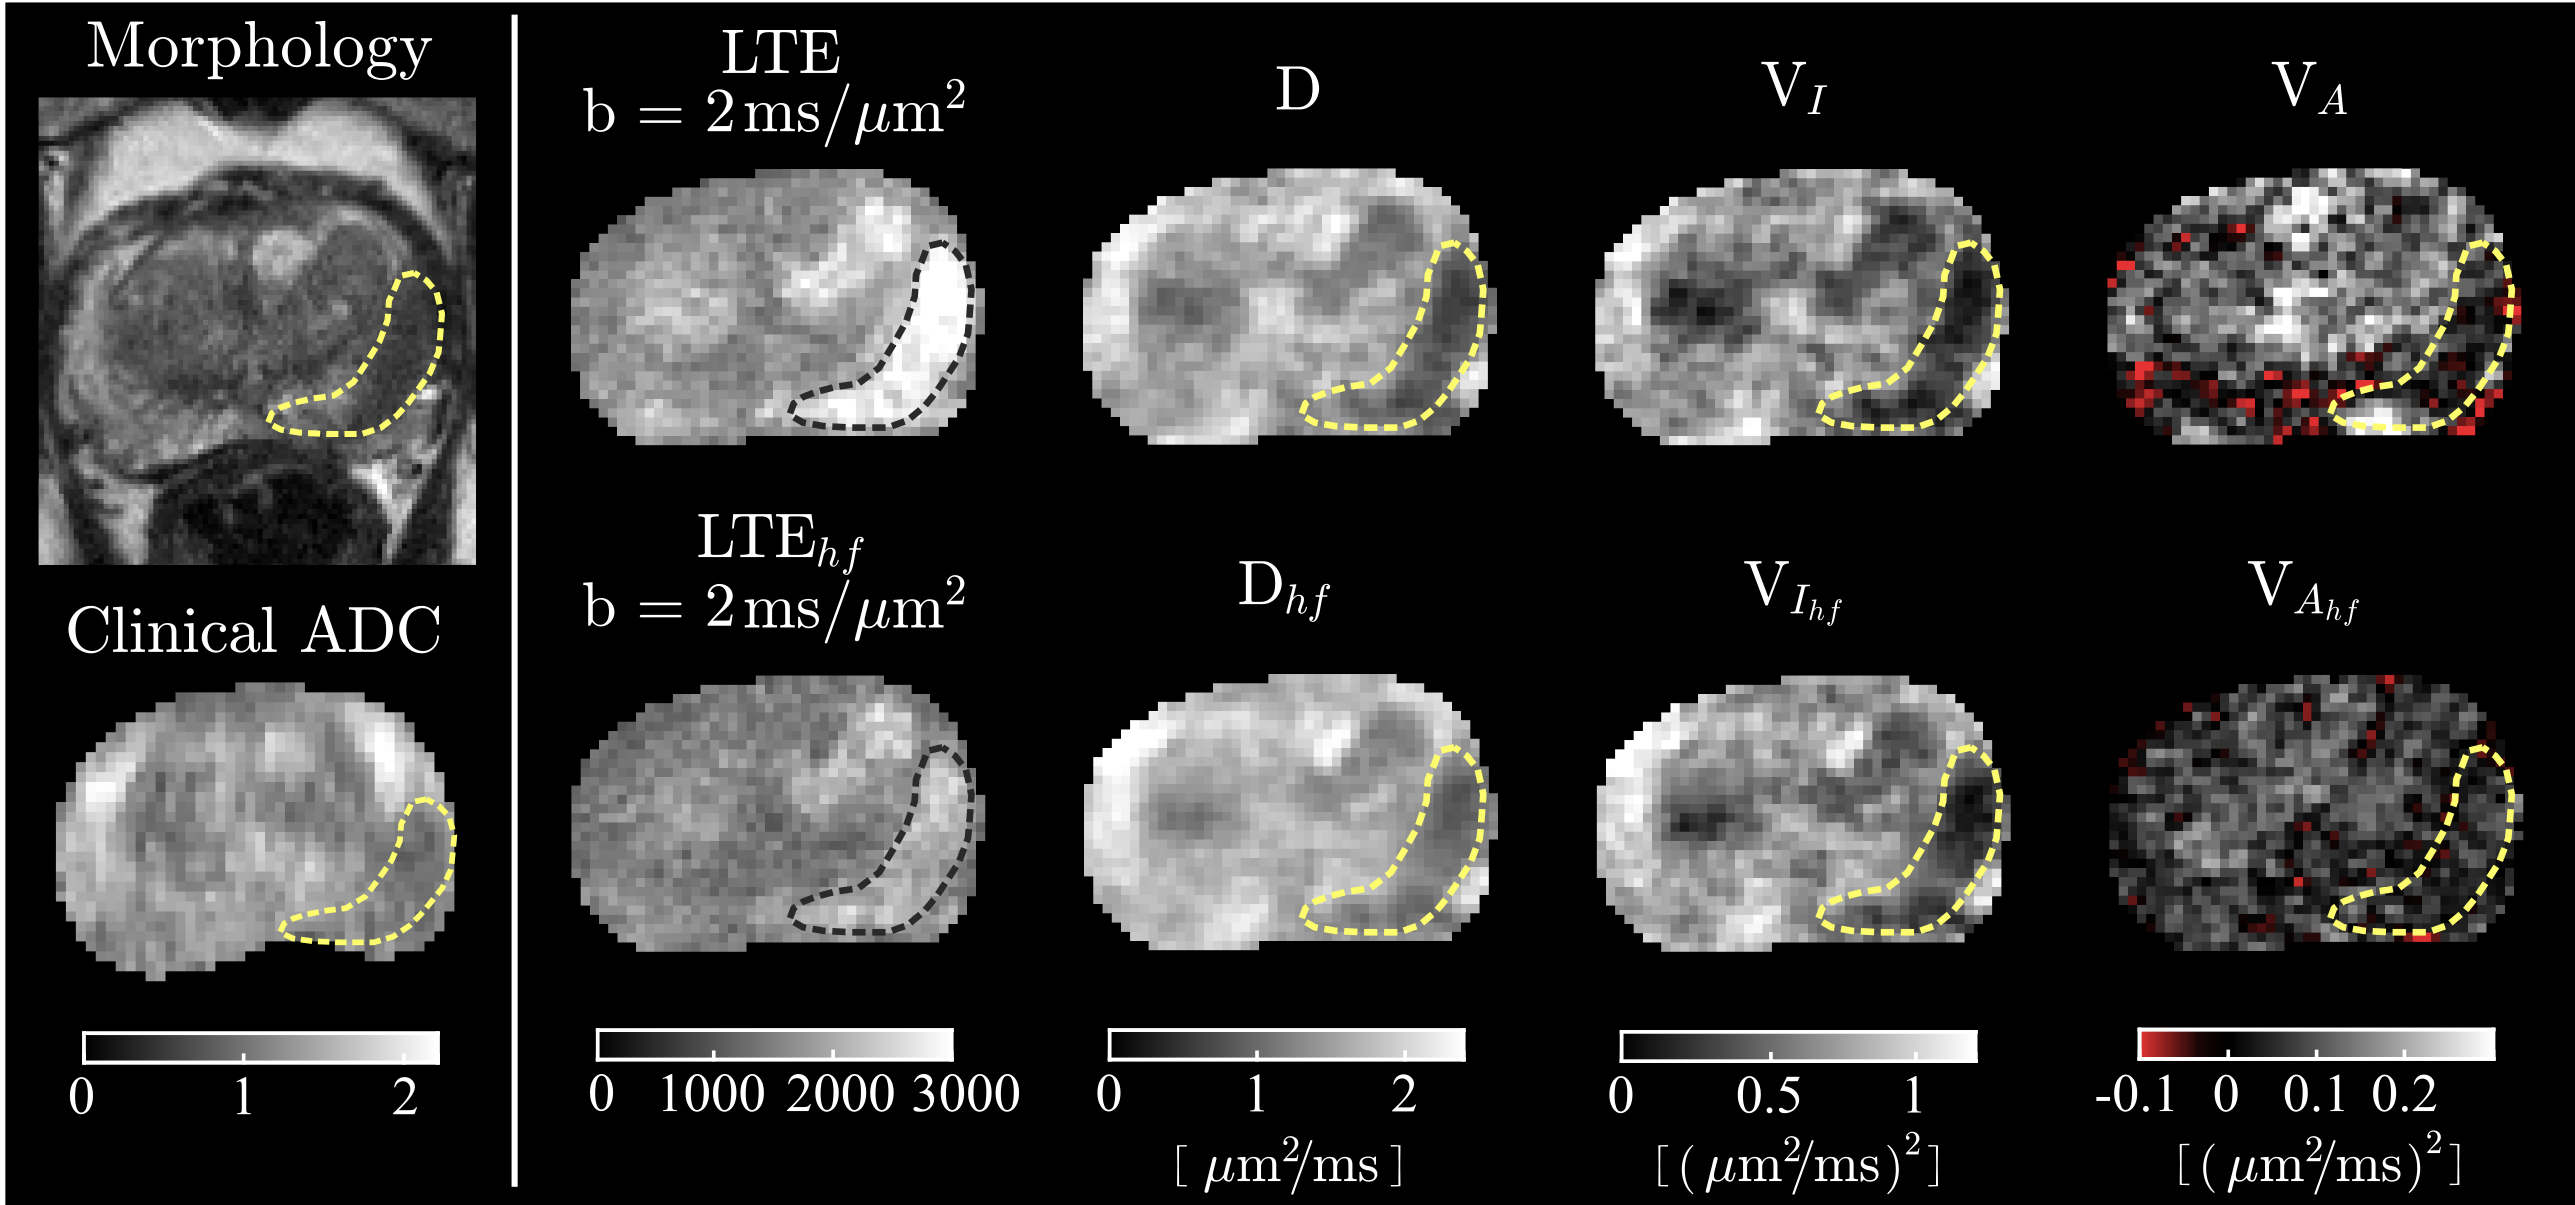
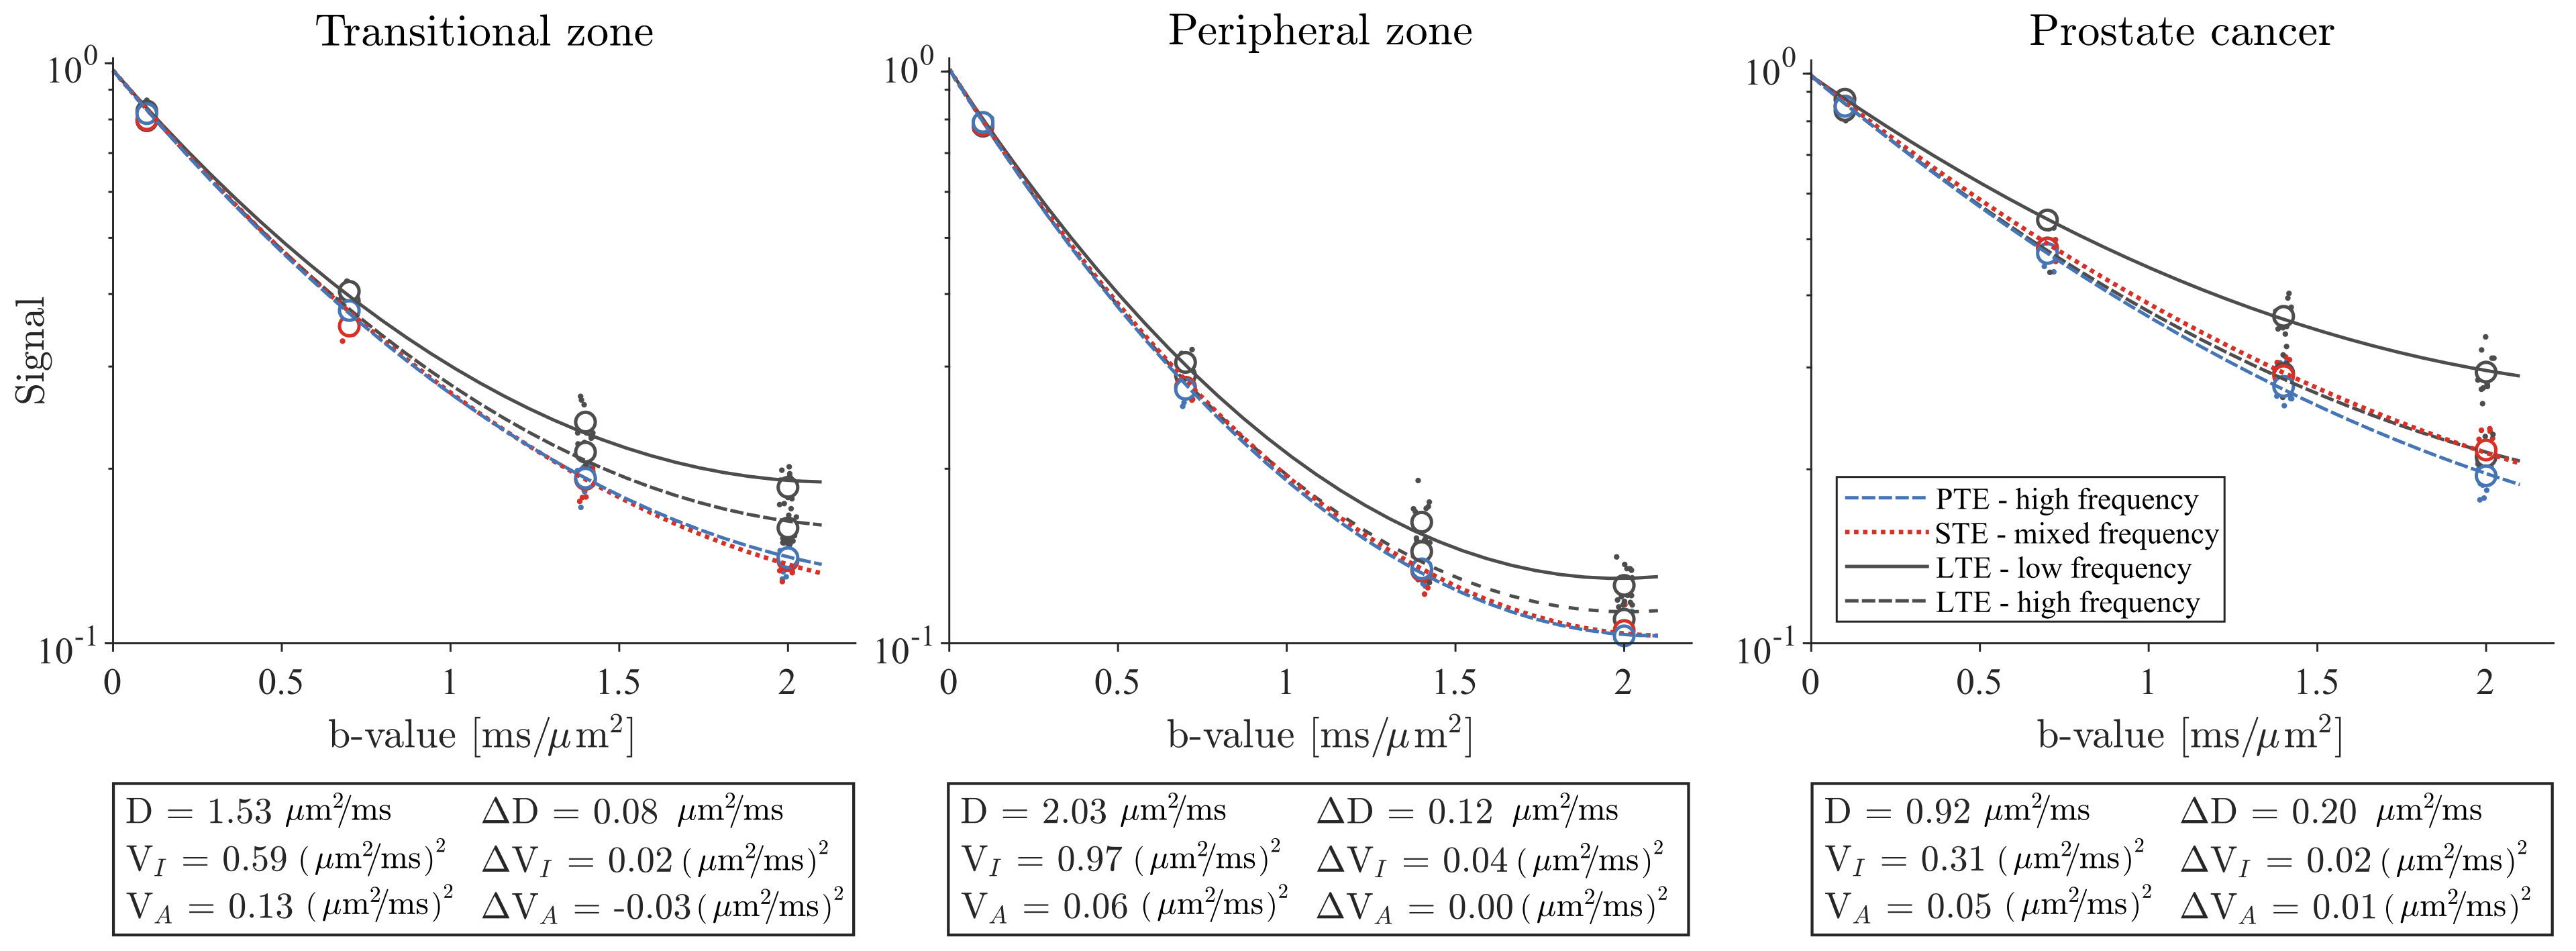
The signal and estimated parameters could be reconstructed without visible distortions (Fig.2). Higher encoding frequencies (shorter diffusion times) reduce the diffusion-weighted signal and increase the apparent diffusivity. The isotropic diffusional variance is consistently higher than the anisotropic variance ($$$V_I>V_A$$$) in partial agreement with previous works29,30.The signal representation accounted well for the dynamics of the signal (Fig.3). It visualizes the hallmarks of time-dependence (initial slope depends on restriction weighting) and diffusional variance (non-monoexponential signal decay). This means that diffusion time effects appear already at low b-values.
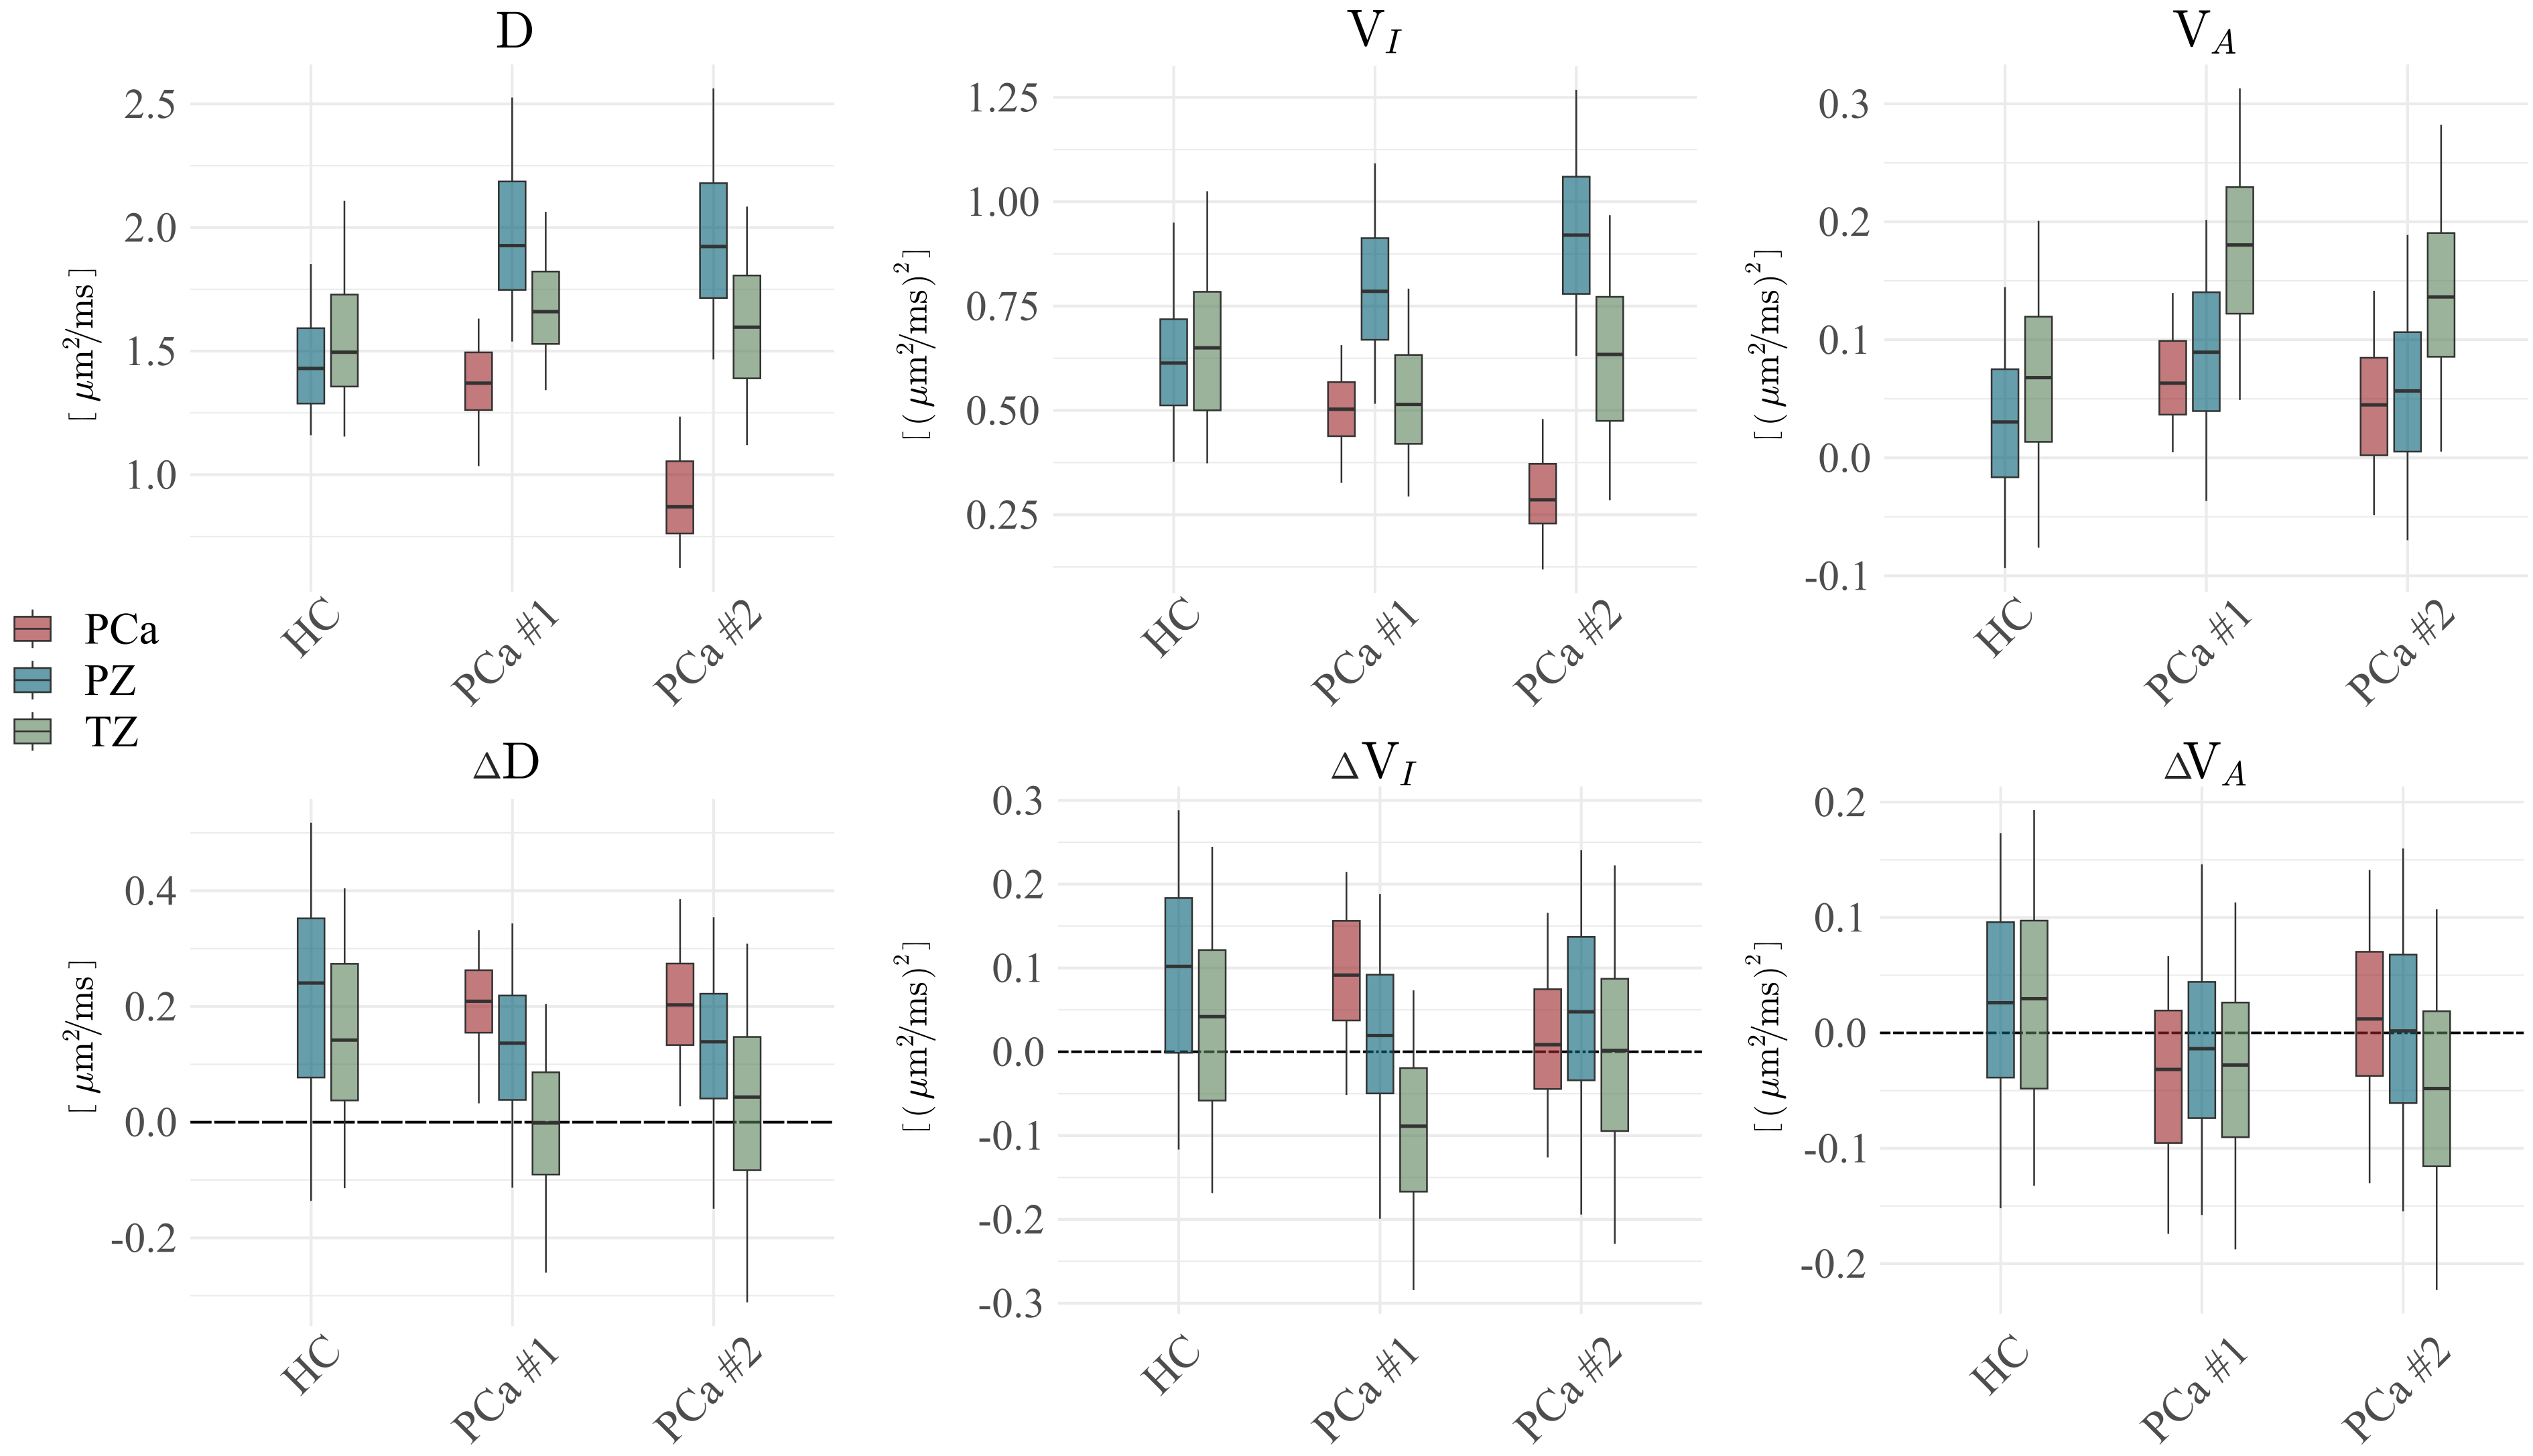
Based on descriptive statistics (Fig.4.), the tumours are distinguished by a low diffusivity and strong diffusion time dependence in the apparent diffusivity (low $$$D$$$ and high $$$\Delta{D}$$$) as compared to normal appearing tissue. In patients, the peripheral and transitional zones were dominated by $$$V_I$$$ and $$$V_A$$$, respectively, whereas these parameters were similar across the healthy prostate. This could be explained by the large age difference or a yet unknown pathological effect. The time-dependence of $$$V_I$$$ and $$$V_A$$$, was generally weak (small $$$\Delta{V_I}$$$ and $$$\Delta{V_A}$$$). From theory, we expect the diffusional variance to decrease at higher encoding frequency4, but limited signal precision and sensitivity to a positive noise floor bias can counteract this.
Conclusions
We presented a novel approach to measure time-dependent diffusivity and diffusional variance in in vivo prostate. Time-dependence was mainly observed in the apparent diffusivity, and among patients, it was strongest in the tumour.Our results indicate that diffusion time effects may require consideration when using waveforms adapted for tensor-valued encoding in the prostate. Although our approach uses relatively high frequencies, similar frequencies are achievable at clinical systems at lower b-values, and these effects may thus be visible in more common acquisitions.
Acknowledgements
This work was supported by the Swedish Cancer Society (22 0592 JIA and 22 2011 Pj), the Swedish Research Council (2021-04844), Franke and Margareta Bergqvists Foundation (SAMV 2022/364), a Wellcome Trust Investigator Award (096646/Z/11/Z), a Wellcome Trust Strategic Award (104943/Z/14/Z), an EPSRC equipment grant (EP/M029778/1), and Siemens Healthcare Limited grant to DKJ. CMWT is supported by a Sir Henry Wellcome Fellowship (215944/Z/19/Z) and a Veni grant (17331) from the Dutch Research Council (NWO). This study was supported by a Cancer Research Wales Innovation Grant and a Royal College of Radiologists Pump Priming Grant. SL is supported by the European Research Council under the European Union’s Horizon 2020 research and innovation programme (grant number 804746) and NIH (National Institutes of Health) (grant numbers R01NS125781, R01MH074794).
The authors thank Fabrizio Fasano (Siemens Healthineers) and Kieran Foley MD (School of Medicine, Cardiff University) for technical and scientific support.
References
1. Lasič S, Szczepankiewicz F, Eriksson S, Nilsson M, Topgaard D. Microanisotropy imaging: Quantification of microscopic diffusion anisotropy and orientational order parameter by diffusion MRI with magic-angle spinning of the q-vector. Front Phys. 2014;2(February):1-14. doi:10.3389/fphy.2014.000112. Szczepankiewicz F, Westin CF, Nilsson M. Gradient waveform design for tensor-valued encoding in diffusion MRI. J Neurosci Methods. 2021;348. doi:10.1016/j.jneumeth.2020.109007
3. Lundell H, Lasič S. Diffusion Encoding with General Gradient Waveforms. In: Topgaard D, ed. Advanced Diffusion Encoding Methods in MRI. Royal Society of Chemistry; 2020.
4. Lundell H, Nilsson M, Dyrby TB, et al. Multidimensional diffusion MRI with spectrally modulated gradients reveals unprecedented microstructural detail. Sci Rep. 2019;9(1):1-12. doi:10.1038/s41598-019-45235-7
5. Lemberskiy G, Rosenkrantz AB, Veraart J, Taneja SS, Novikov DS, Fieremans E. Time-dependent diffusion in prostate cancer. Invest Radiol. 2017;52(7):405-411. doi:10.1097/RLI.0000000000000356
6. Panagiotaki E, Chan RW, Dikaios N, et al. Microstructural characterization of normal and malignant human prostate tissue with vascular, extracellular, and restricted diffusion for cytometry in tumours magnetic resonance imaging. Invest Radiol. 2015;50(4):218-227. doi:10.1097/RLI.0000000000000115
7. Sjölund J, Szczepankiewicz F, Nilsson M, Topgaard D, Westin CF, Knutsson H. Constrained optimization of gradient waveforms for generalized diffusion encoding. J Magn Reson. 2015;261:157-168. doi:10.1016/J.JMR.2015.10.012
8. Szczepankiewicz F, Safi M, Ceberg C, et al. Multidimensional diffusion MRI for monitoring radiotherapy response in human prostate cancer xenografts in mice: a longitudinal pilot study. In: Proc Int Soc Magn Reson Med. ; 2023.
9. Meyer CH, Hu BS, Nishimura DG, Macovski A. Fast Spiral Coronary Artery Imaging. Magn Reson Med. 1992;28(2). doi:10.1002/mrm.1910280204
10. Molendowska M. Diffusion MRI of the Prostate at 300 MT/M. Cardiff University; 2023.
11. Wilm BJ, Nagy Z, Barmet C, et al. Diffusion MRI with concurrent magnetic field monitoring. Magn Reson Med. 2015;74(4):925-933. doi:10.1002/MRM.25827
12. Wilm BJ, Barmet C, Gross S, et al. Single-shot spiral imaging enabled by an expanded encoding model: Demonstration in diffusion MRI. Magn Reson Med. 2017;77(1):83-91. doi:10.1002/mrm.26493
13. Dietrich BE, Brunner DO, Wilm BJ, et al. A field camera for MR sequence monitoring and system analysis. Magn Reson Med. 2016;75(4):1831-1840. doi:10.1002/MRM.25770
14. Kimmlingen R. Pioneers of Connectome gradients. MAGENTOM Flash. 2017;68(2):122-136.
15. Jones DK, Alexander DC, Bowtell R, et al. Microstructural imaging of the human brain with a ‘super-scanner’: 10 key advantages of ultra-strong gradients for diffusion MRI. Neuroimage. 2018;182:8-38. doi:10.1016/J.NEUROIMAGE.2018.05.047
16. Westin CF, Knutsson H, Pasternak O, et al. Q-space trajectory imaging for multidimensional diffusion MRI of the human brain. Neuroimage. 2016;135:345-362. doi:10.1016/j.neuroimage.2016.02.039
17. Eriksson S, Lasič S, Nilsson M, Westin CF, Topgaard D. NMR diffusion-encoding with axial symmetry and variable anisotropy: Distinguishing between prolate and oblate microscopic diffusion tensors with unknown orientation distribution. J Chem Phys. 2015;142(10). doi:10.1063/1.4913502
18. Szczepankiewicz F, Westin CF, Nilsson M. Maxwell-compensated design of asymmetric gradient waveforms for tensor-valued diffusion encoding. Magn Reson Med. 2019;82(4):1424-1437. doi:10.1002/mrm.27828
19. Mueller L, Afzali M, Molendowska M, et al. Boosting the SNR-efficiency of Free Gradient Waveform Diffusion MRI using Spiral Readouts and Ultra-Strong Gradients. In: ; 2021.
20. Lustig M, Kim SJ, Pauly JM. A fast method for designing time-optimal gradient waveforms for arbitrary k-space trajectories. IEEE Trans Med Imaging. 2008;27(6):866-873. doi:10.1109/TMI.2008.922699
21. Wilm BJ, Barmet C, Pavan M, Pruessmann KP. Higher order reconstruction for MRI in the presence of spatiotemporal field perturbations. Magn Reson Med. 2011;65(6):1690-1701. doi:10.1002/mrm.22767
22. Pruessmann KP, Weiger M, Börnert P, Boesiger P. Advances in sensitivity encoding with arbitrary k-space trajectories. Magn Reson Med. 2001;46(4):638-651. doi:10.1002/MRM.1241
23. Bernstein MA, Zhou XJ, Polzin JA, et al. Concomitant gradient terms in phase contrast MR: Analysis and correction. Magn Reson Med. 1998;39(2):300-308. doi:10.1002/MRM.1910390218
24. Vannesjo SJ, Graedel NN, Kasper L, et al. Image reconstruction using a gradient impulse response model for trajectory prediction. Magn Reson Med. 2016;76(1):45-58. doi:10.1002/MRM.25841/ASSET/SUPINFO/MRM25841-SUP-0001-SUPPINFO01.DOCX
25. Tournier JD, Smith R, Raffelt D, et al. MRtrix3: A fast, flexible and open software framework for medical image processing and visualisation. Neuroimage. 2019;202. doi:10.1016/j.neuroimage.2019.116137
26. Cordero-Grande L, Christiaens D, Hutter J, Price AN, Hajnal J V. Complex diffusion-weighted image estimation via matrix recovery under general noise models. Neuroimage. 2019;200:391-404. doi:10.1016/J.NEUROIMAGE.2019.06.039
27. Klein S, Staring M, Murphy K, Viergever MA, Pluim JPW. Elastix: A toolbox for intensity-based medical image registration. IEEE Trans Med Imaging. 2010;29(1). doi:10.1109/TMI.2009.2035616
28. Szczepankiewicz F, Lasič S, van Westen D, et al. Quantification of microscopic diffusion anisotropy disentangles effects of orientation dispersion from microstructure: Applications in healthy volunteers and in brain tumors. Neuroimage. 2015;104:241-252. doi:10.1016/J.NEUROIMAGE.2014.09.057
29. Langbein BJ, Szczepankiewicz F, Westin CF, et al. A Pilot Study of Multidimensional Diffusion MRI for Assessment of Tissue Heterogeneity in Prostate Cancer. Invest Radiol. 2021;56(12):845-853. doi:10.1097/RLI.0000000000000796
30. Nilsson M, Eklund G, Szczepankiewicz F, et al. Mapping prostatic microscopic anisotropy using linear and spherical b-tensor encoding: A preliminary study. Magn Reson Med. 2021;86(4). doi:10.1002/mrm.28856
Figures