1351
Different distribution patterns of blood flow velocity in venous stenosis segment in idiopathic intracranial hypertension using 7T 4D flow MRI1Tiantan Neuroimaging Center of Excellence, China National Clinical Research Center for Neurological Diseases, Beijing Tiantan Hospital, Capital Medical University, Beijing, China, 2Department of Radiology, Beijing Tiantan Hospital, Capital Medical University, Beijing, China, 3Department of Radiology, University of Southern California, Los Angeles, CA, United States, 4MR Research Collaboration Team, Siemens Healthineers, Beijing, China, 5Interventional Neuroradiology Center, Beijing TianTan Hospital, Capital Medical University, Beijing, China
Synopsis
Keywords: Blood Vessels, Velocity & Flow
Motivation: The distribution pattern of blood flow velocity in venous sinus stenosis is worth exploring, and its screening value for venous stenting is unknown yet.
Goal(s): To explore velocity distribution pattern in idiopathic intracranial hypertension (IIH) patients with venous stenosis and its relationships with clinical characteristics.
Approach: Fifteen IIH patients with venous stenosis were scanned through 4D flow MRI with 7.0T scanner, and data was processed for the velocity distribution patterns.
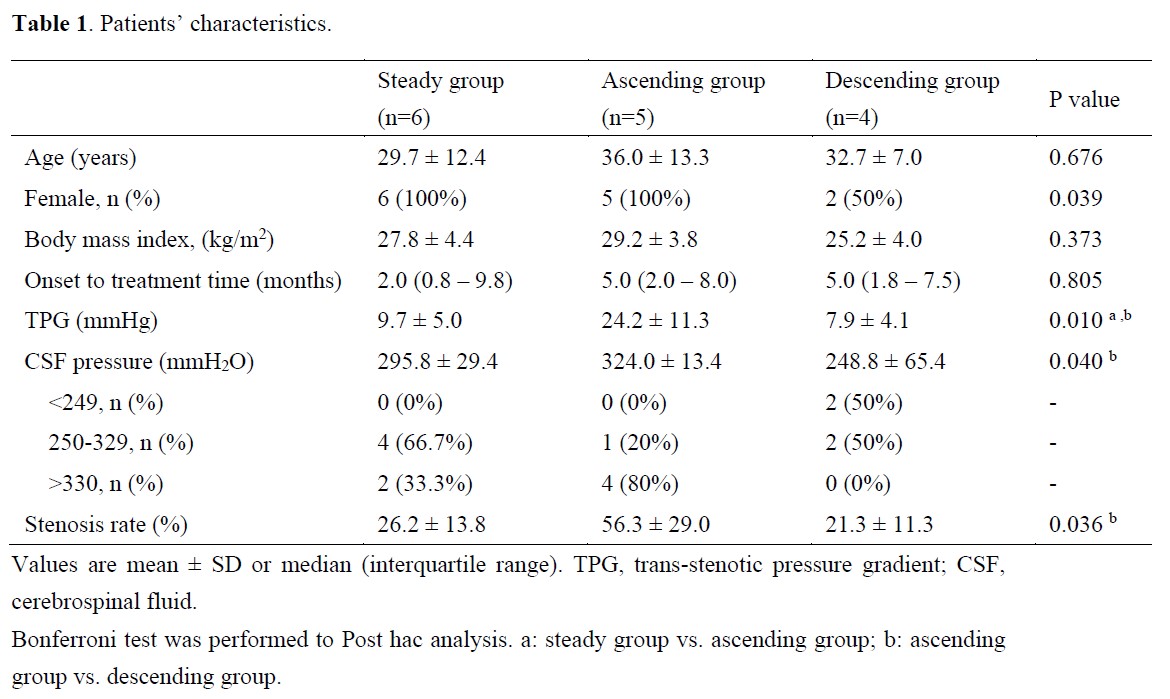
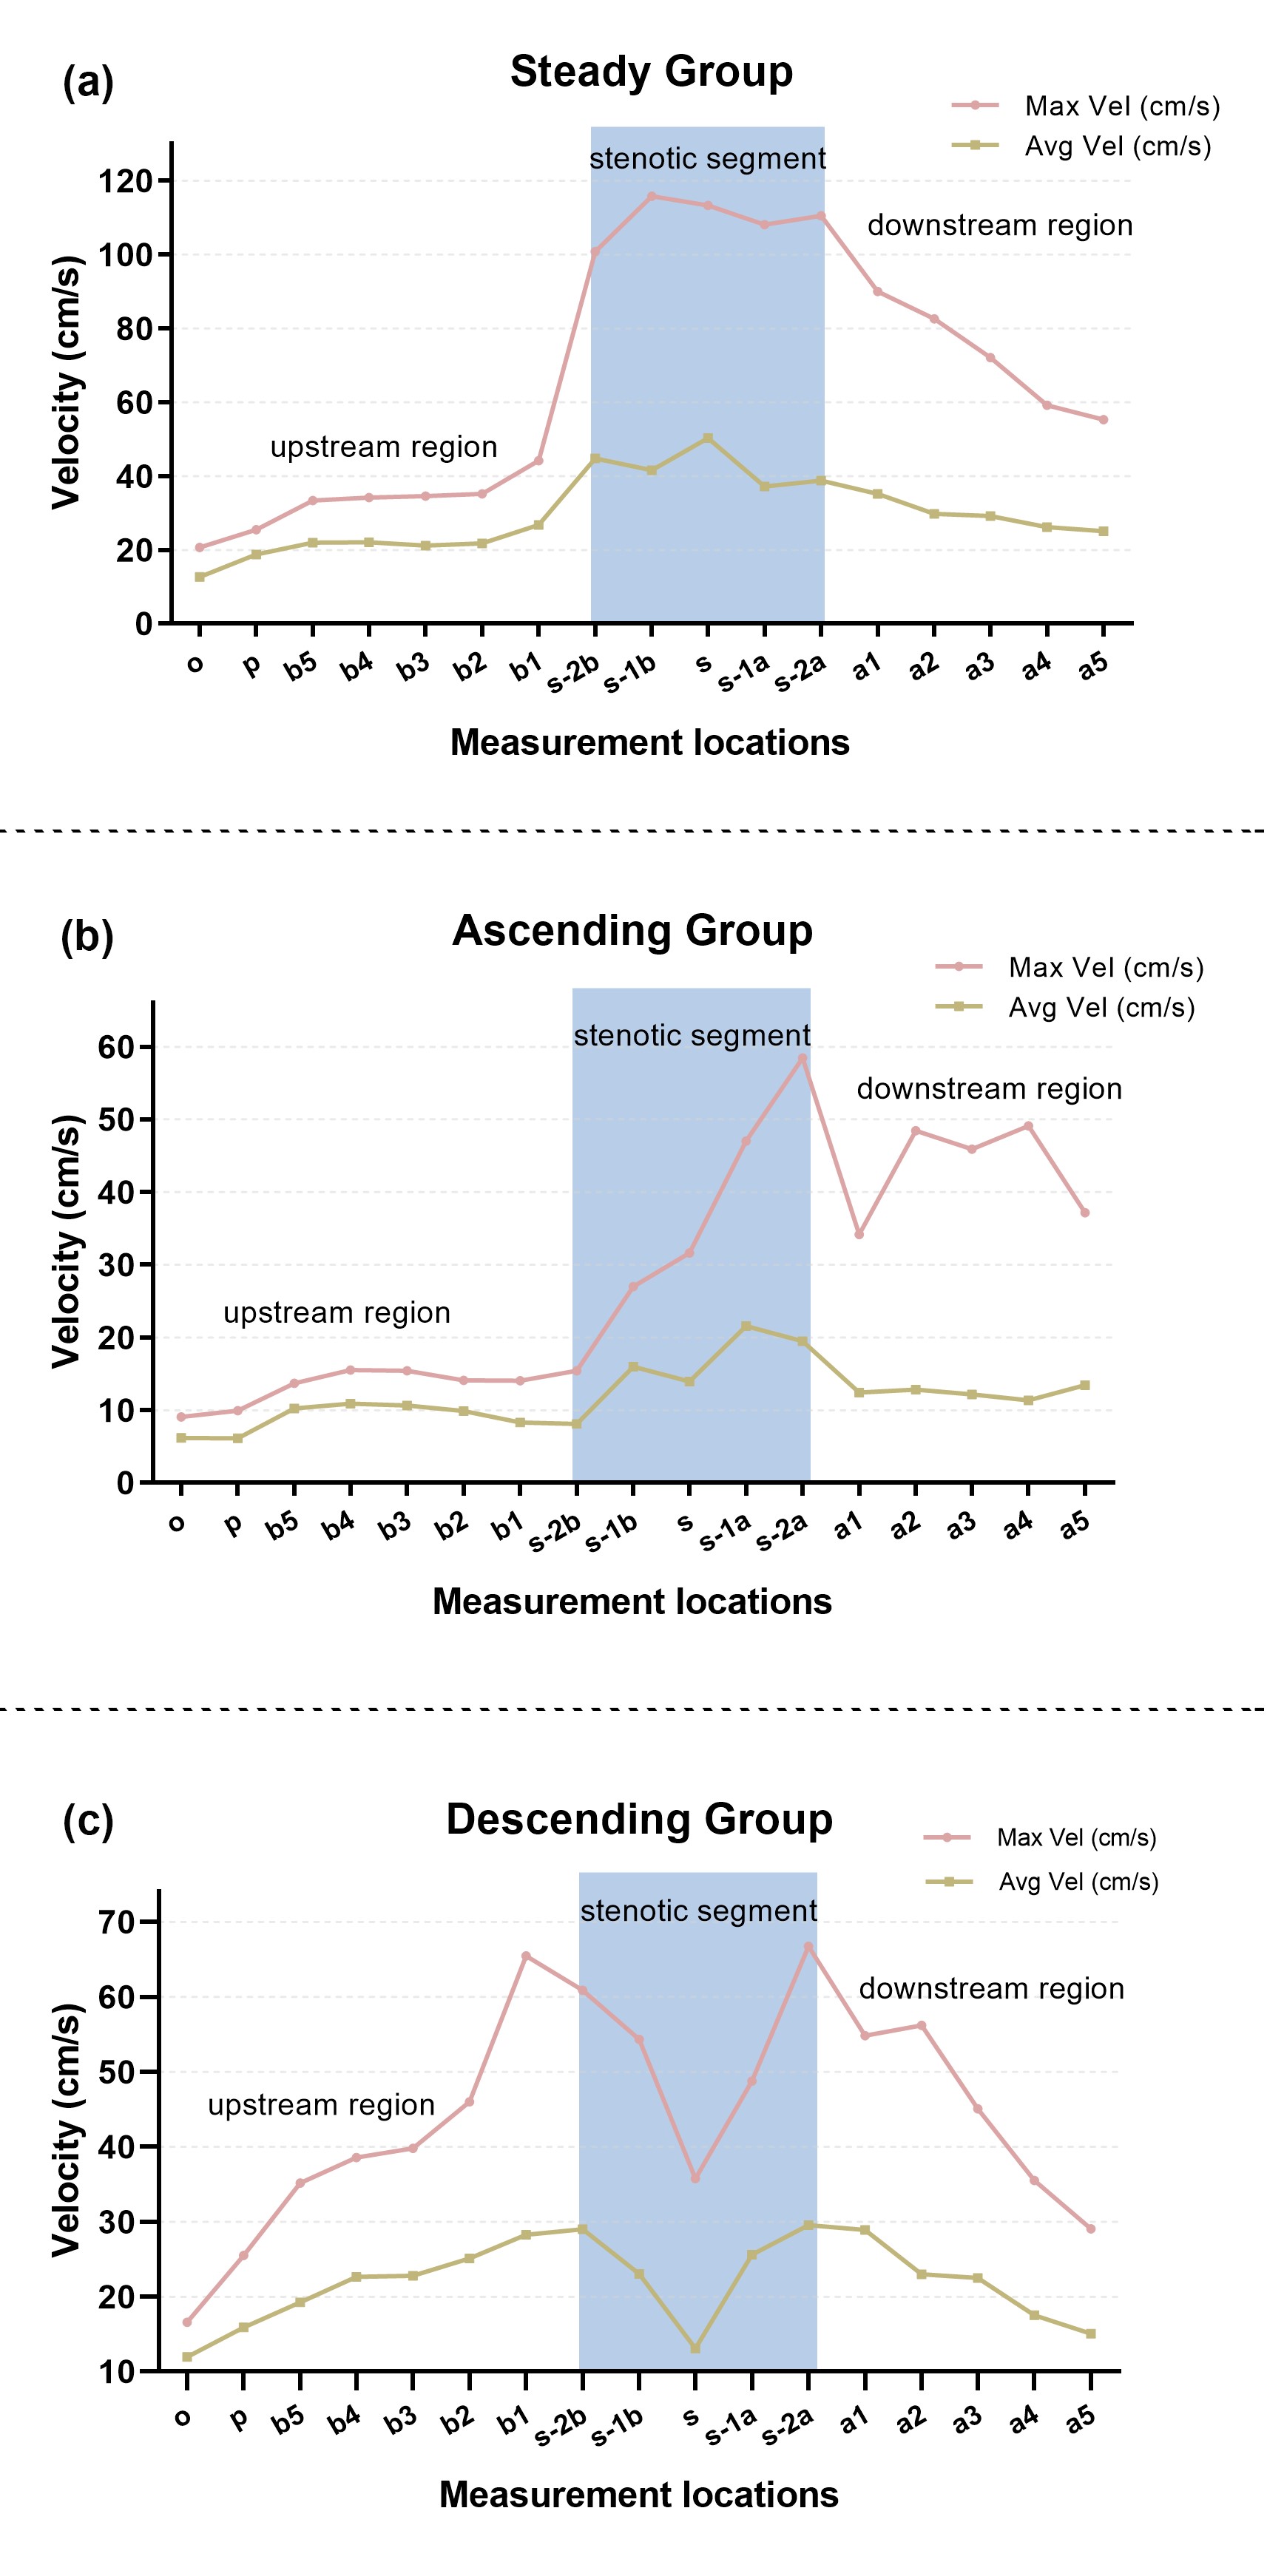
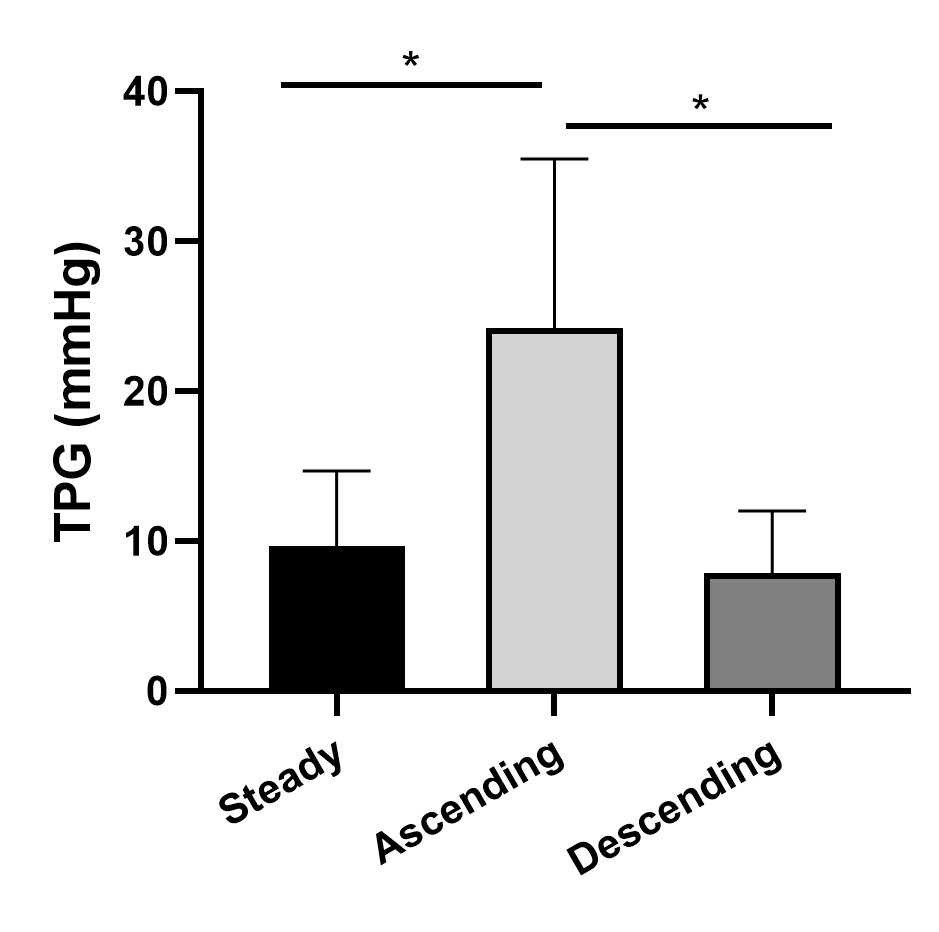
Results: Steady, ascending, and descending distribution patterns were identified. TPG, CSF pressure and stenosis rate were significantly different among three patterns, with significantly higher value in ascending velocity group.
Impact: As a noninvasive imaging technique, 4D flow MRI may provide some support from a hemodynamic perspective for screening IIH patients who would benefit from venous manometry and venous stenting.
Introduction
Idiopathic intracranial hypertension (IIH) is a disorder characterized by sustained elevated increased intracranial pressure (ICP) and a wide range of accompanying symptoms. The etiology is unknown but has been thought to relate to cerebrospinal fluid disturbance or cerebral venous stenosis1. Venous stenting resolves stenosis and reduces ICP, and it has been considered as an effective treatment for IIH2. Trans-stenotic pressure gradient (TPG) measured by cerebral venography with manometry is a crucial indicator for stenting3, but this method is invasive, and may cause additional pain, extra radiation, and costs. Four-dimensional (4D) flow MRI, a noninvasive imaging technique, can provide volumetric quantification of the blood flow velocity throughout the imaging volume and visualization of complex blood flow patterns4. A previous study reported that blood flow velocity was related to pressure gradient5, so hemodynamic assessment using 4D flow MRI may reflect the TPG to some extent, providing some support for screening patients suitable to venous stenting. In this study, we aimed to explore the velocity distribution patterns and clinical features in IIH patients with venous sinus stenosis.Methods
Fifteen IIH patients (13 female; mean age, 31.0 ± 11.1 years) with TS stenosis scheduled for cerebral venography with manometry from June 2022 to Nov 2022 were enrolled. 4D-flow MRI was acquired 24–48 h before venous manometry using a 7.0T scanner (MAGNETOM Terra, Siemens Healthcare, Erlangen, Germany). The parameters were set as follows: TR/TE: 59.84/3.61 msec, Field of view: 192×192 mm2, slice thickness: 0.8 mm, Flip angle: 15°, velocity encoding: 80 cm/sec. The cardiac phases were 14. The scanning time was about 15–18 minutes, depending on the heart rate.Cerebral venography with manometry
Cerebral venography was performed in a conscious state under local anesthesia in all the patients. Intrasinus pressure measurements (manometry) were obtained in the venous sinus segments, downstream and upstream to the stenosis.
4D Flow Data Analysis
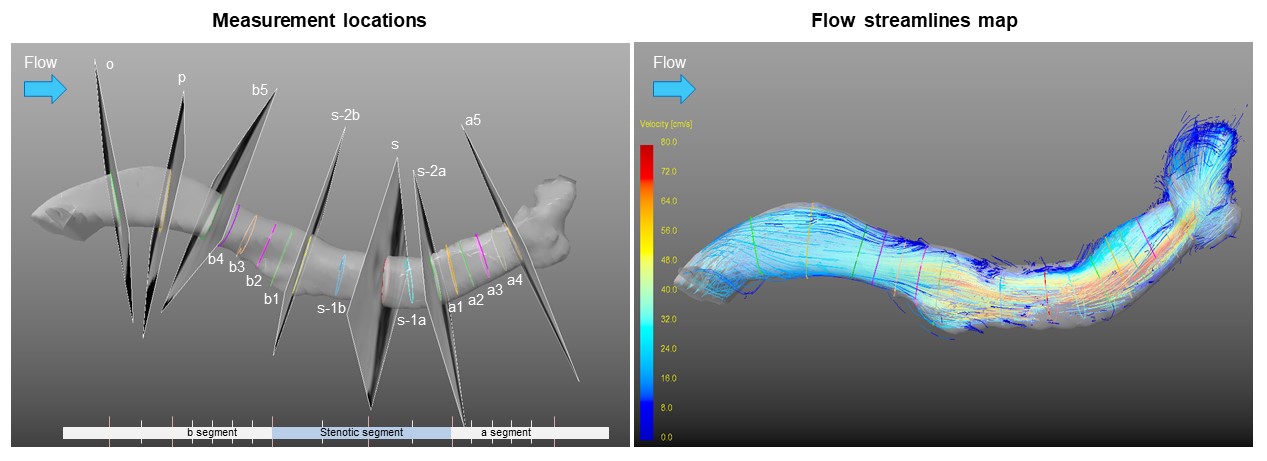
The 4D flow data analysis was performed using GTflow software (Gyro Tools, version 2.2.14, Zurich, Switzerland). Before data visualization and quantification, preprocessing steps including eddy current correction, velocity aliasing correction, and velocity mask application were performed, and streamline map was reconstructed6. Regarding the quantitative measurement of blood flow velocity, all planes were placed perpendicular to the venous sinus (Figure 1). A contour was drawn manually along the vessel wall in each plane, and the velocity of flowing blood that passed through this contour was calculated automatically.
Additionally, the stenosis rate of TS was evaluated by combined 4D flow MRI and MRV, and calculated as (reference area – stenotic area) / reference area. The average of the normal lumen area before and after stenosis was used as the reference area.
Statistical analysis
Differences among the three groups were analyzed using one-way analysis of variance or Kruskal-Wallis H test. Statistical significance was set at a two-tailed p-value < 0.05.
Results
All patients were included in the final analysis. Three velocity distribution patterns in stenotic segment were identified, including velocity relatively steady, ascending, and descending (Figure 2). Patients were divided into these three groups by their blood flow velocity distribution patterns. In the velocity ascending group, TPG was significantly higher than that in steady group (p = 0.024) and descending group (p = 0.022). The CSF pressure and stenotic rate were significant different among the three group (p = 0.040, p = 0.036), with the highest values in the ascending group (Table 1).Discussion
In this study, we explored the distribution patterns of velocity in TS stenotic segment in IIH patients using 4D flow MRI, and its relations to clinical characteristics. Our results suggested that the changes in blood flow velocity of stenosis may be related to TPG, CSF pressure, and stenosis degree. In other words, the distribution pattern of blood flow velocity may reflect the TPG to a certain extent. Patients with elevated blood flow velocity tend to have higher TPG, and venous stenting may be most beneficial to these individuals, which suggests that hemodynamic assessment using 4D flow MRI is of great value for IIH patients with venous stenosis. Future studies with larger samples will further investigate the relationship between venous pressure and quantitative hemodynamics using 4D flow MRI, in an attempt to find an optimal noninvasive index for screening suitable patients for venous manometry and venous stenting.Conclusion
Different distribution patterns of blood flow velocity in TS stenotic segment obtained from 4D flow MRI may be of screening value for venous stenting in IIH patients with venous stenosis.Acknowledgements
None.References
1. Colman BD, Boonstra F, Nguyen MN, et al. Understanding the pathophysiology of idiopathic intracranial hypertension (IIH): a review of recent developments. J Neurol Neurosurg Psychiatry. 2023; jnnp-2023-332222.
2. Lenck S, Vallée F, Labeyrie M-A, et al. Stenting of the Lateral Sinus in Idiopathic Intracranial Hypertension According to the Type of Stenosis. Neurosurgery. 2017;80:393-400.
3. Fargen KM, Liu K, Garner RM, Greeneway GP, Wolfe SQ, Crowley RW. Recommendations for the selection and treatment of patients with idiopathic intracranial hypertension for venous sinus stenting. J Neurointerv Surg. 2018;10:1203-1208.
4. Soulat G, McCarthy P, Markl M. 4D Flow with MRI. Annu Rev Biomed Eng. 2020;22:103-126.
5. Kweon J, Yang DH, Kim GB, et al. Four-dimensional flow MRI for evaluation of post-stenotic turbulent flow in a phantom: comparison with flowmeter and computational fluid dynamics. Eur Radiol. 2016;26:3588-3597.
6. Li Y, Chen H, He L, et al. Hemodynamic assessments of venous pulsatile tinnitus using 4D-flow MRI. Neurology. 2018;91:e586-e593.
Figures