1348
Non-invasive segmentation of individual watershed areas allows detection of hemodynamic impairments in internal carotid artery stenosis1School of Medicine and Health, Department of Neuroradiology, Technical University of Munich, Munich, Germany, 2School of Medicine and Health, TUM-Neuroimaging Center, Technical University of Munich, Munich, Germany, 3School of Medicine and Health, Clinic of Neurology, Technical University of Munich, Munich, Germany, 4C.J. Gorter MRI Center, Department of Radiology, Leiden University Medical Center, Leiden, Netherlands, 5Leiden Institute of Brain and Cognition, Leiden University, Leiden, Netherlands, 6School of Medicine and Health, Department of Vascular and Endovascular Surgery, Technical University of Munich, Munich, Germany, 7Philips GmbH Market DACH, Hamburg, Germany
Synopsis
Keywords: Blood Vessels, Atherosclerosis, Vascular Territories
Motivation: Internal carotid artery stenosis (ICAS) accounts for ≈10% of strokes. Individual watershed areas (iWSA) are especially susceptible to hemodynamic impairments. Currently, iWSA are segmented from contrast agent-based time-to-peak (TTP), limiting applicability.
Goal(s): We aimed towards non-invasive iWSA segmentation based on arterial transit time (ATT) from Hadamard-encoded pseudo-continuous ASL.
Approach: Overlap of iWSA from ATT and TTP was investigated and agreement of extracted hemodynamic parameter values such as cerebrovascular reactivity (CVR) was evaluated and ICAS-induced parameter-lateralization was investigated.
Results: ATT-based and TTP-based iWSAs overlapped well, with excellent agreement in quantitative parameters and significant lateralization of hemodynamic parameters in ICAS within both iWSA delineation approaches.
Impact: We successfully segmented iWSA from non-invasive ATT and demonstrated sensitivity to ICAS-related impairments, in agreement with TTP-based iWSA segmentation. ATT-based iWSAs facilitate longitudinal investigation without contrast application in cerebrovascular diseases such as ICAS or Moyamoya.
Introduction
Internal carotid artery stenosis (ICAS) is a macrovascular manifestation of atherosclerosis, accounting for ≈10% of strokes.1,2 Watershed areas (WSA), located at the junction of cerebral vascular territories, are especially susceptible to hypoperfusion and therefore of particular interest in patients with cerebrovascular diseases (CVD).3 Notably, perfusion territories exhibit variability in healthy individuals4,5 and even greater heterogeneity among patients with ICAS.6,7 Individual WSA (iWSA) can be reliably segmented based on time-to-peak (TTP) maps from clinically established dynamic susceptibility contrast (DSC) MRI.6,8 In unilateral ICAS, iWSA are highly sensitive to hemodynamic alterations, and show normalization after revascularization-therapy.8,9 However, Gadolinium-based contrast agent (CA) needed for DSC MRI limits applicability, especially in renal malfunction.10-14 A non-invasive alternative yielding perfusion delay information is arterial transit time (ATT) mapping. Hadamard-encoded pseudo-continuous ASL (Hadamard-pCASL)15 uses water as an endogenous tracer and allows time-efficient acquisition of multiple post label delays (PLDs) for ATT quantification.16,17 Thus Hadamard-pCASL-based ATT appears promising for iWSAs segmentation.Here, we present data of our ongoing study in asymptomatic unilateral ICAS. We compared iWSAs from Hadamard-pCASL-based ATT and DSC-based TTP, and used resulting masks to extract parameter values of TTP, ATT, cerebral blood flow (CBF), cerebral blood volume (CBV), and cerebrovascular reactivity (CVR). The latter is an especially promising indicator of the vascular health status in CVD.18
We hypothesized that ATT-based iWSAs spatially agree with TTP-based iWSA and facilitate volume-of-interest analysis of relevant biomarkers, in particular CVR. Additionally, we expected to detect hemodynamic alterations within ICAS patients’ iWSAs.
Methods
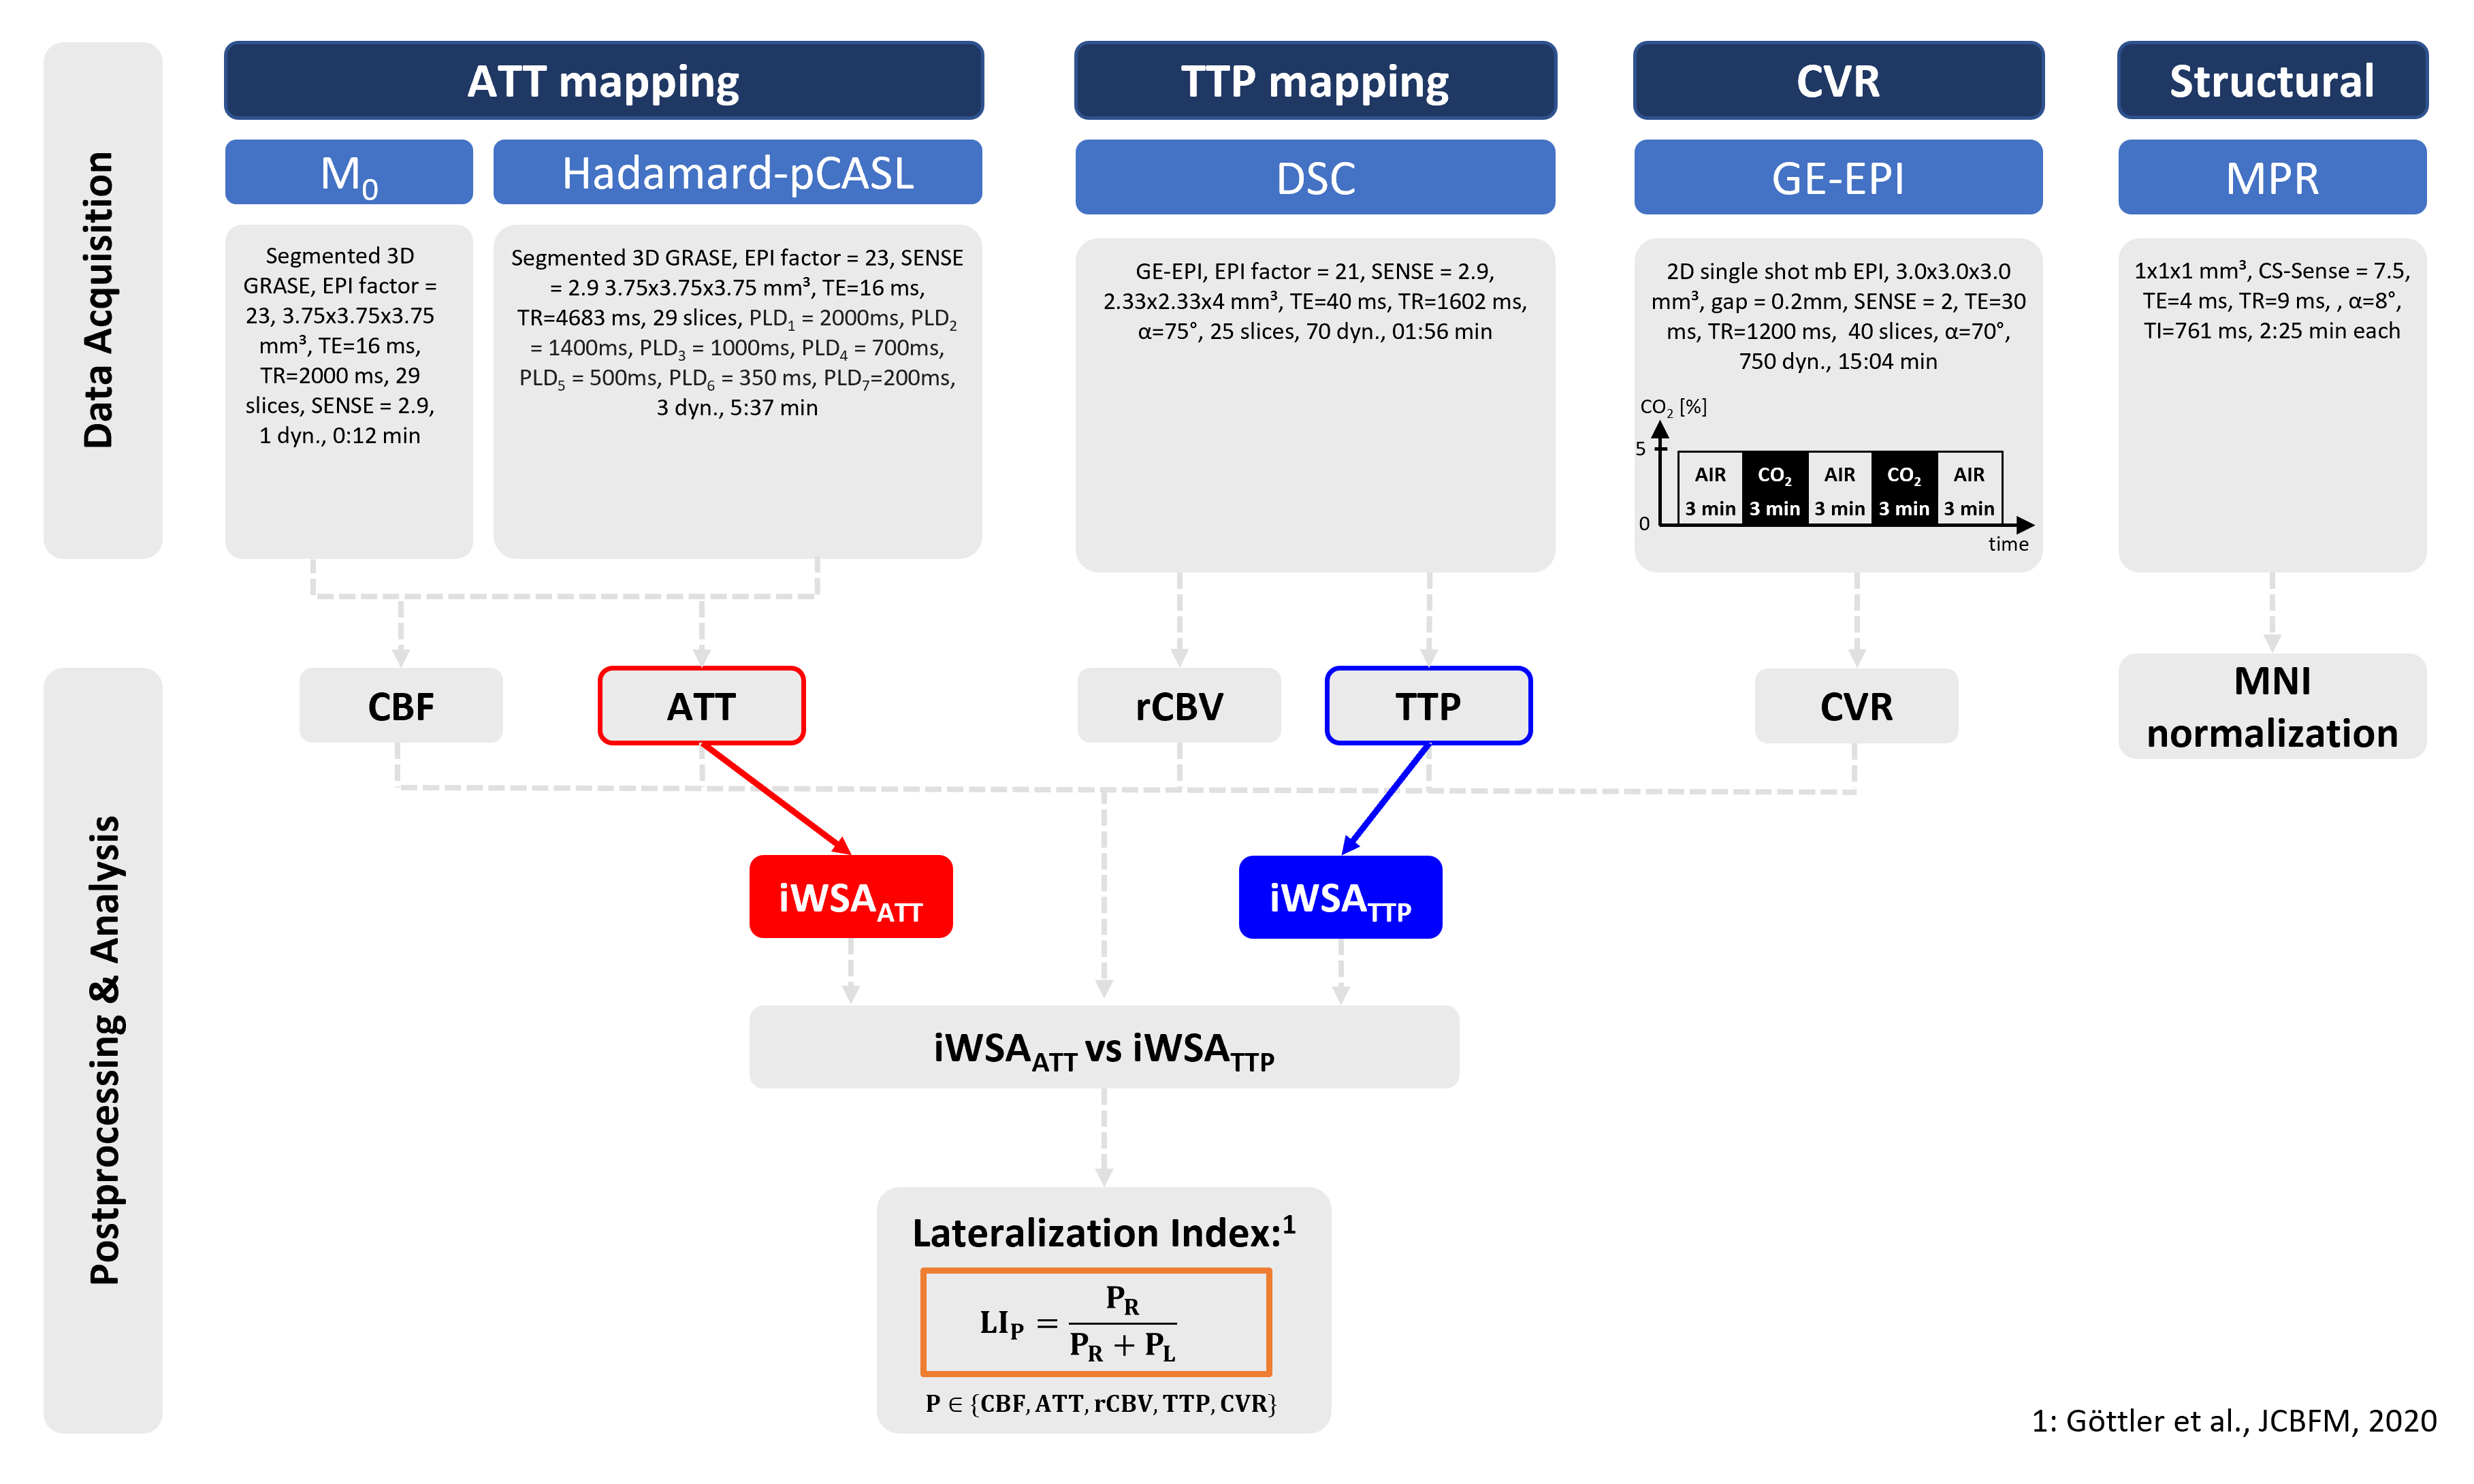
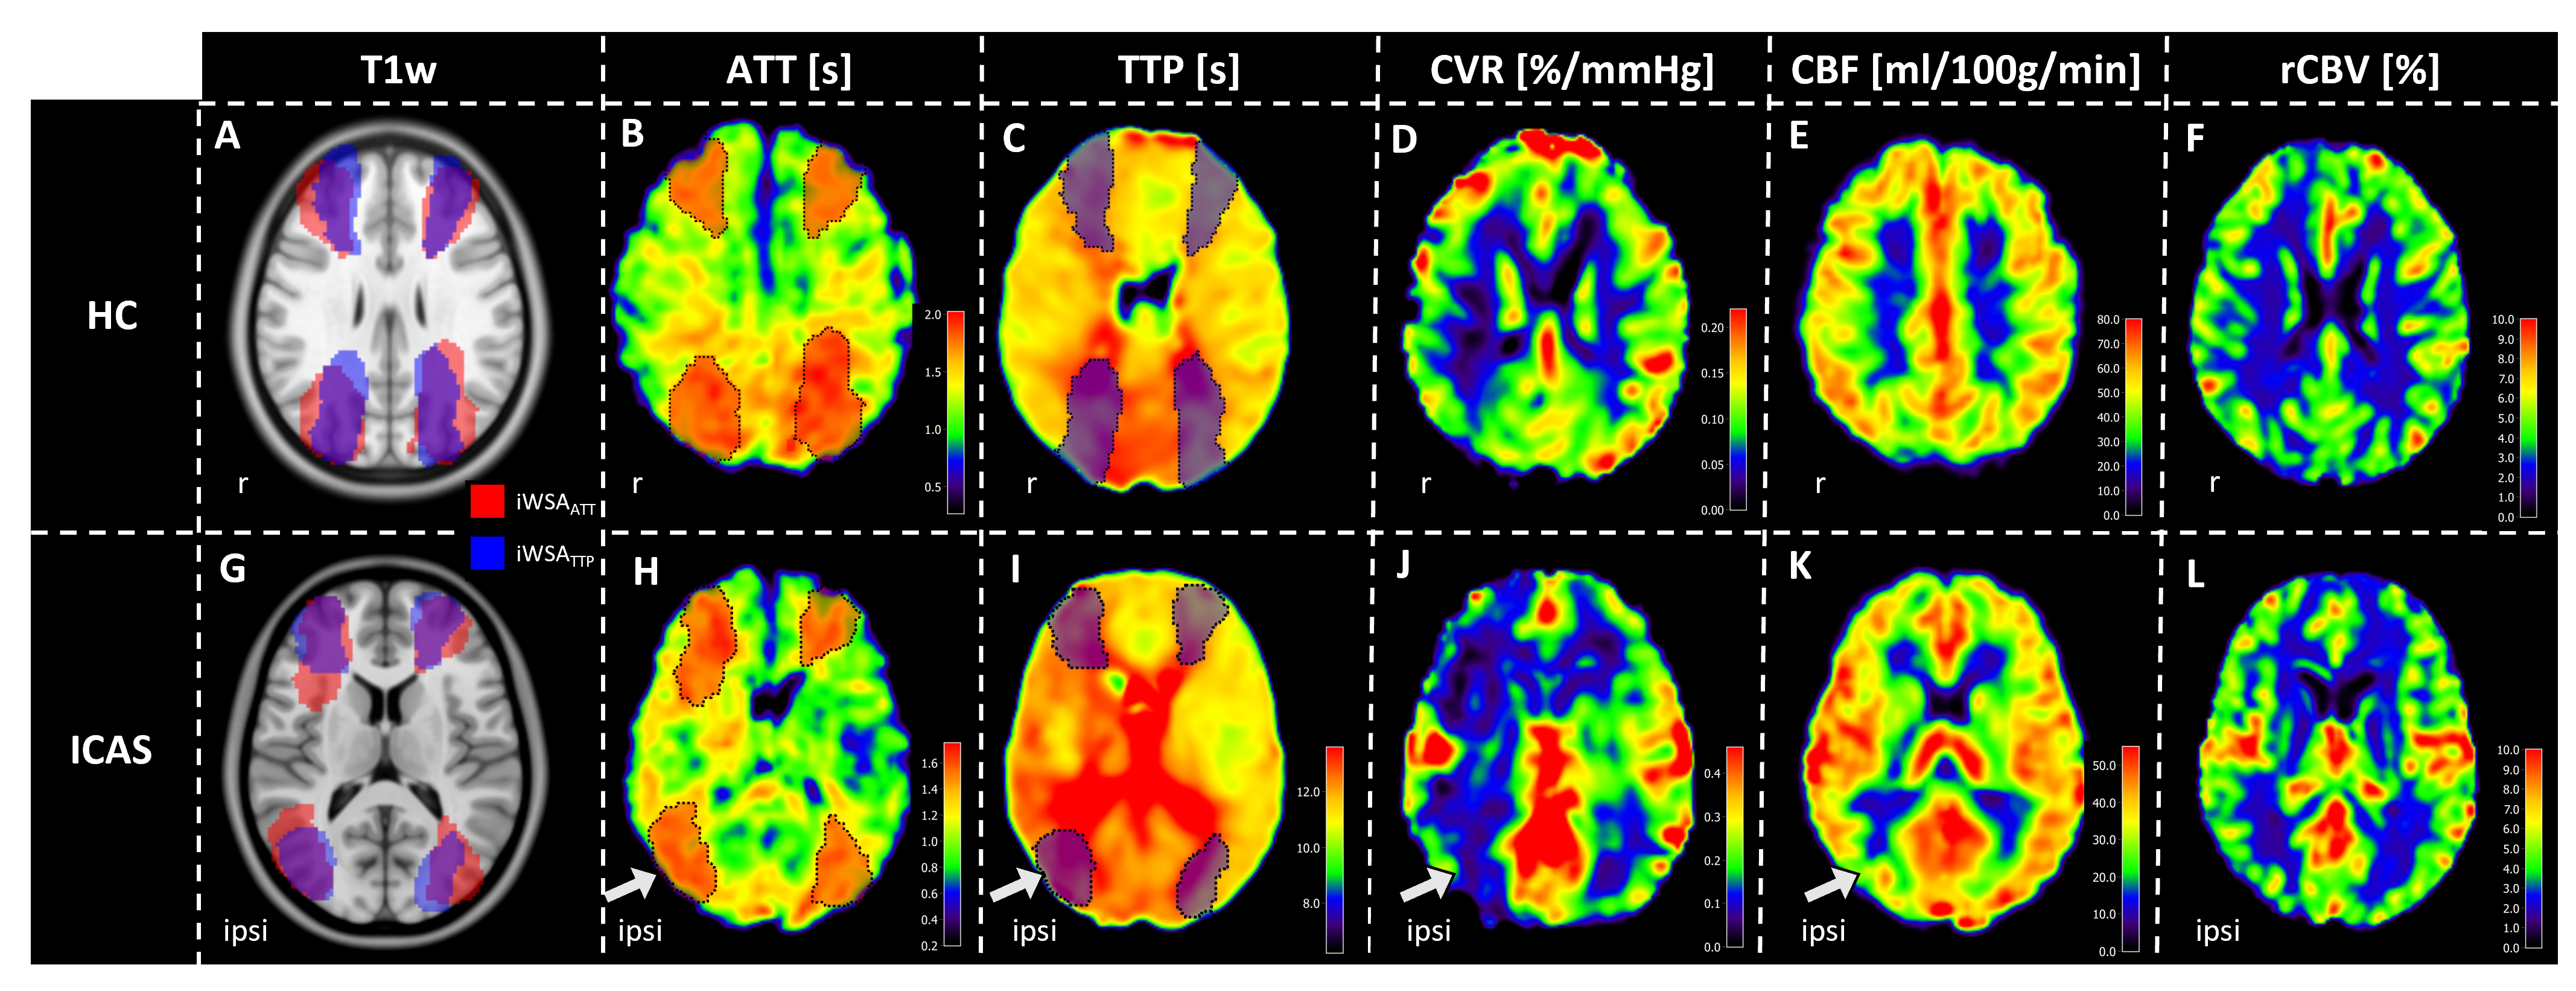
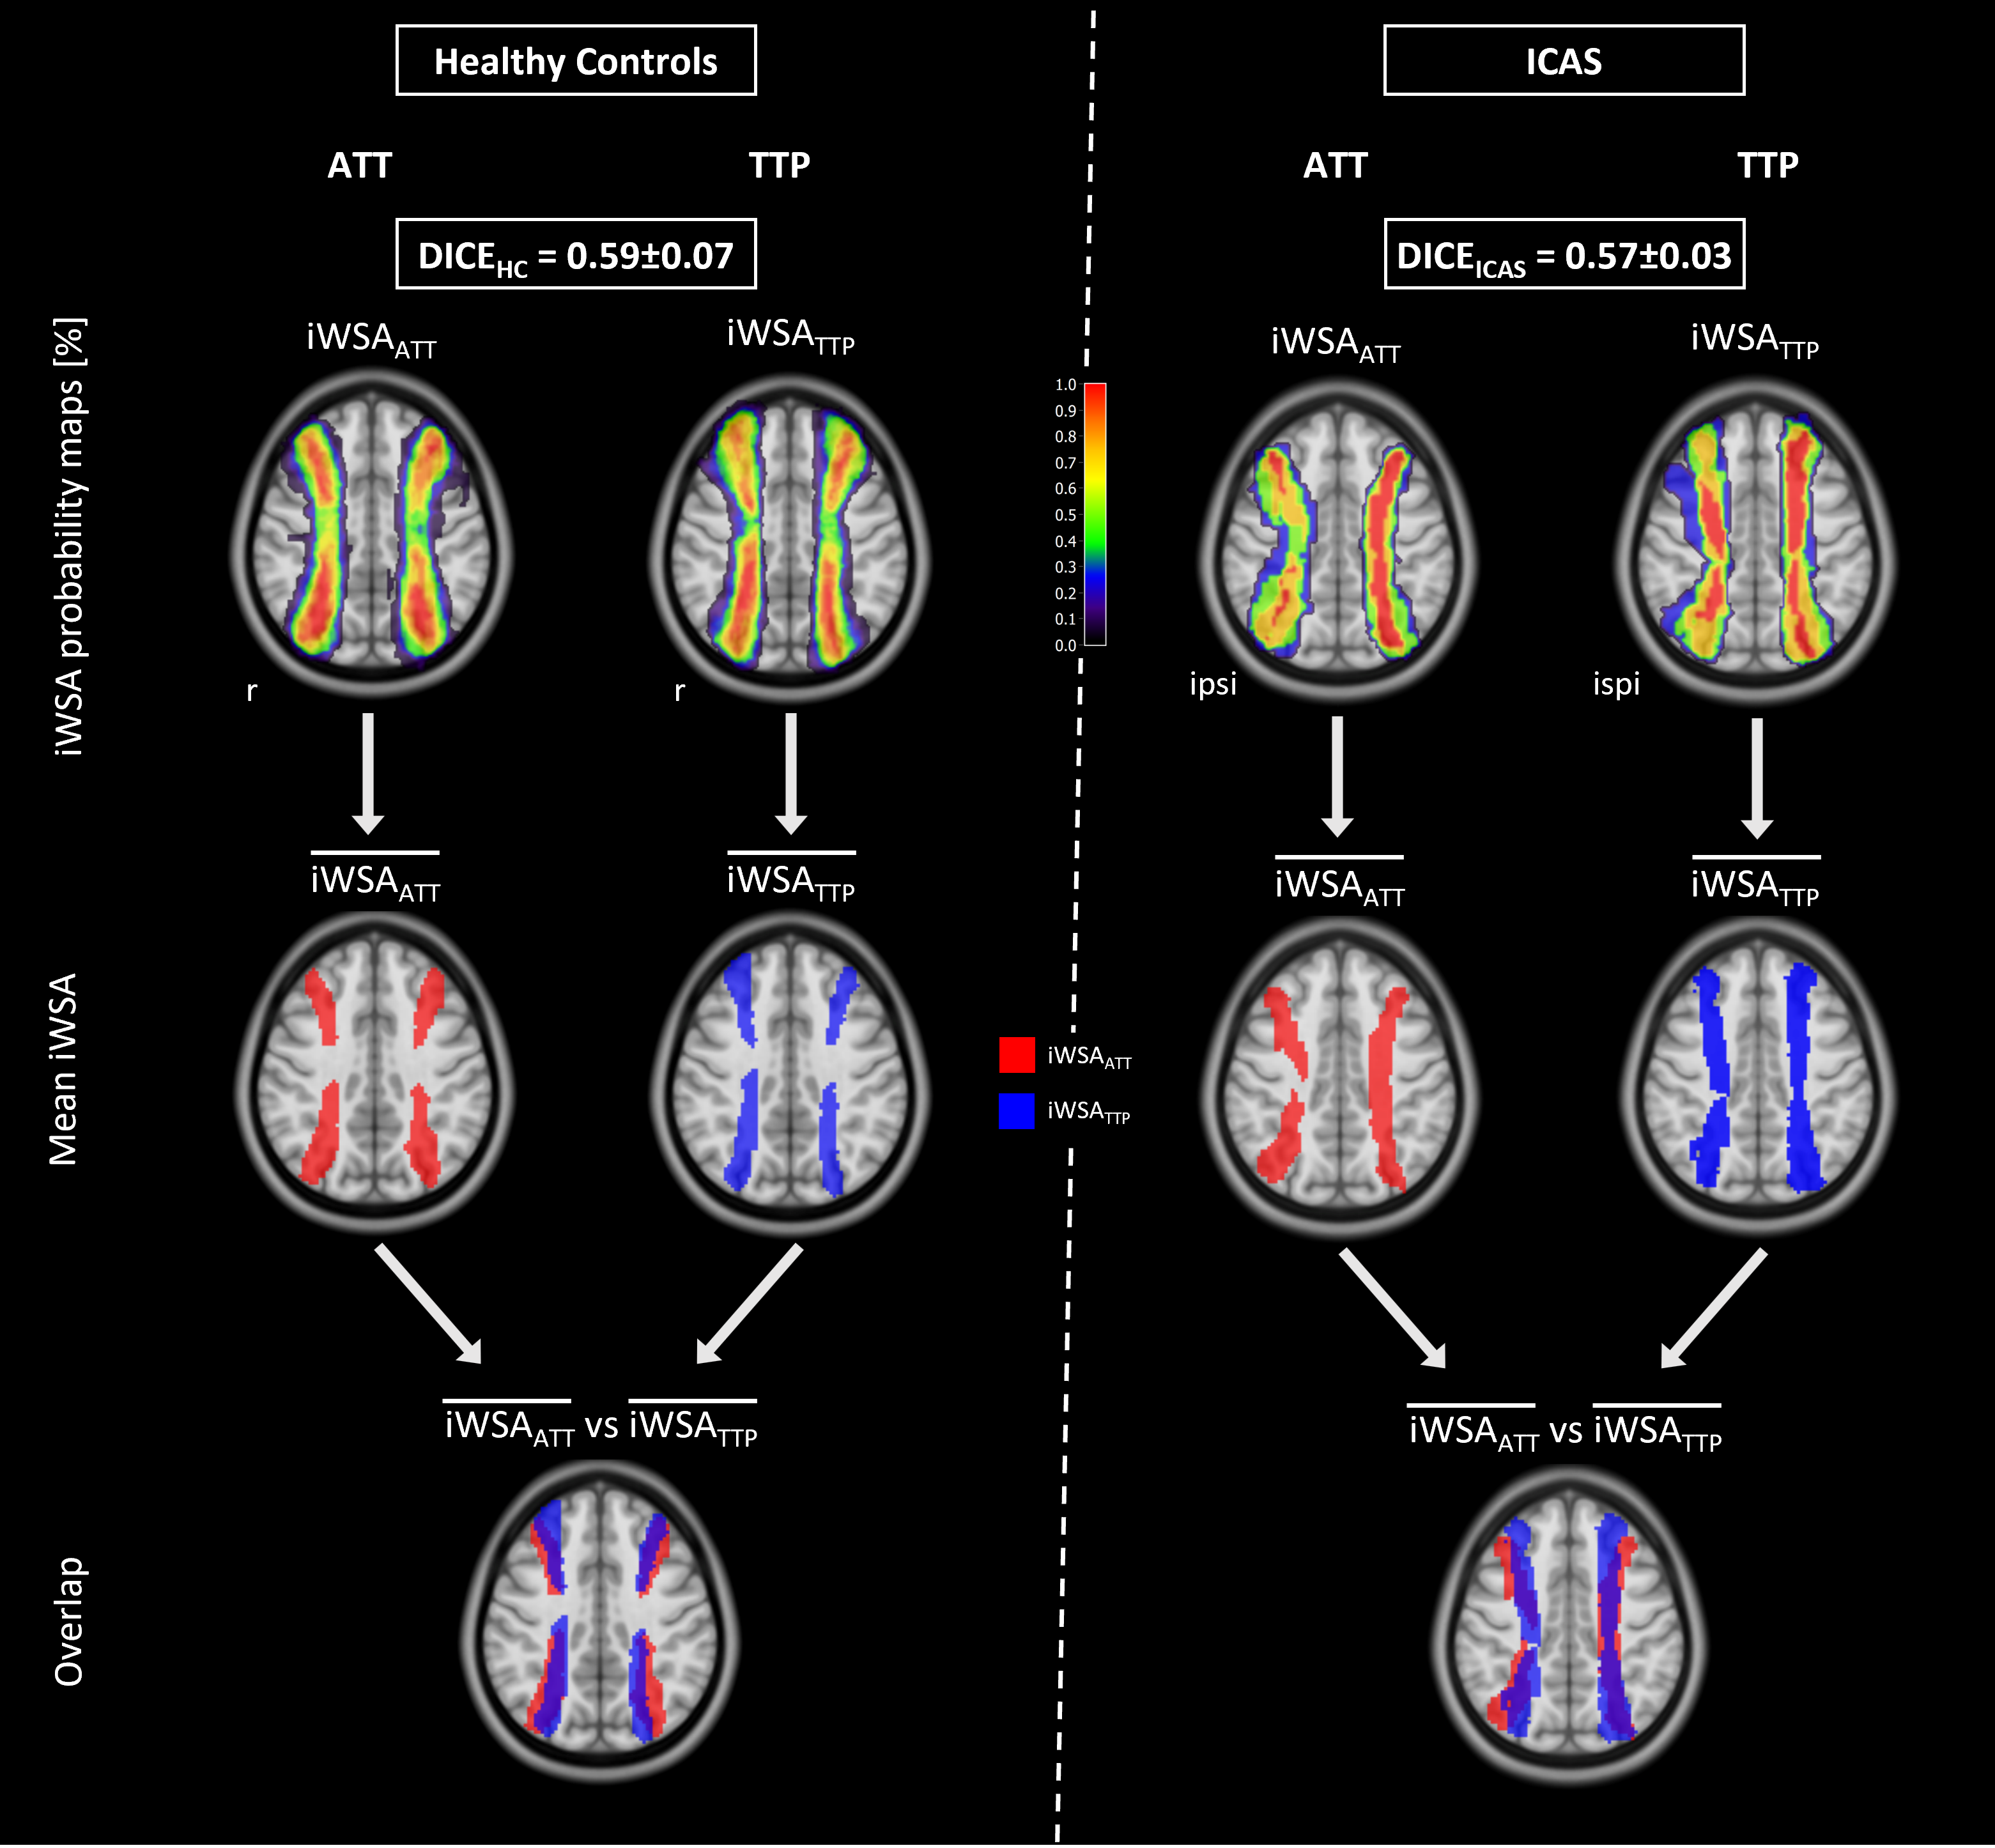
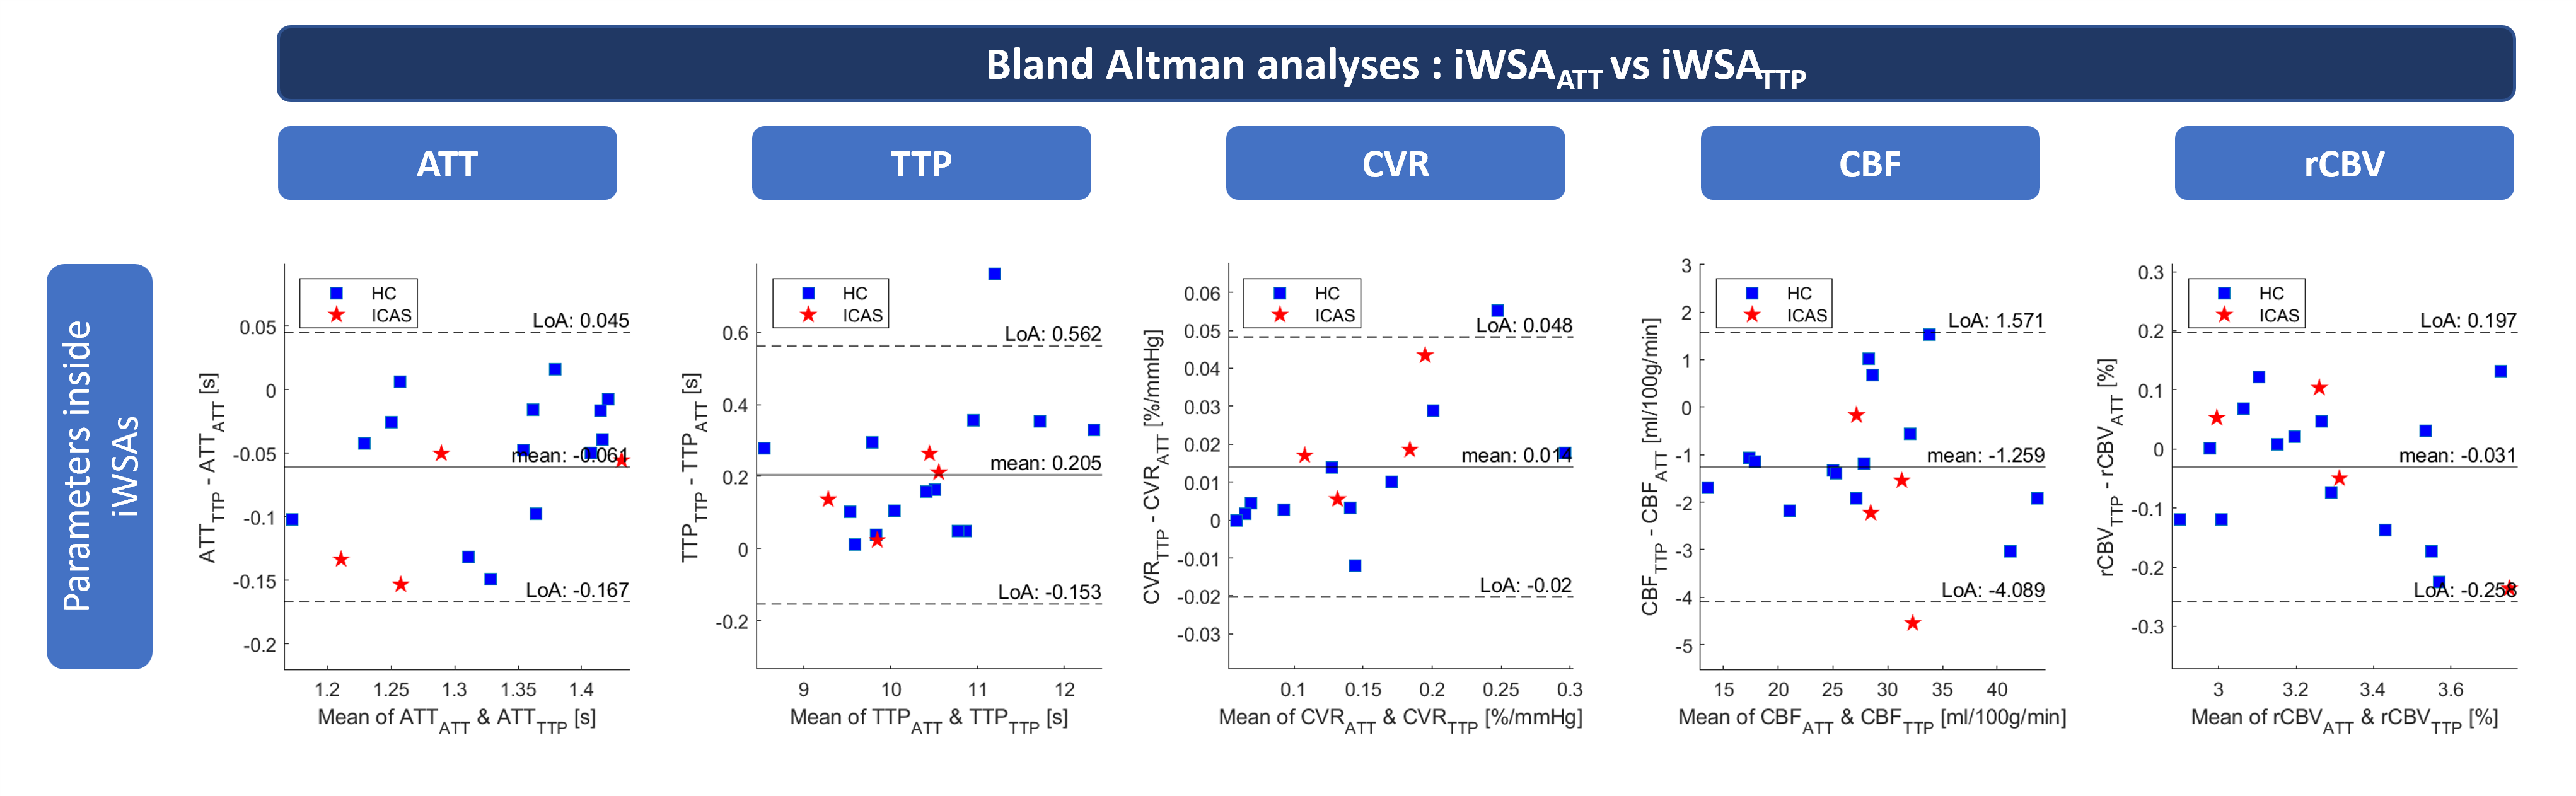
We acquired data of 26 subjects on a 3T Ingenia Elition X MRI (Philips,Best,Netherlands). Patients (n=6, 71.7±8.8y,2f) with unilateral ICAS (NASCET≥60%) were compared to age-matched healthy controls (HC, n=20,69.2±5.8y,12f). Four subjects were excluded due to incomplete data acquisition. The multi-parametric MRI protocol (Fig.1) included Hadamard-pCASL15,19 for ATT and CBF, DSC for TTP and relative CBV (rCBV) and gradient-echo echo-planar-imaging (GE-EPI) for CVR. Hypercapnia (5% CO2) was applied using a sealed face-mask, expiratory gas levels were recorded (ML206,AD Instruments,USA). Hadamard-pCASL data were decoded prior to modelling ATT and CBF using FSL-BASIL.20,21 Further image processing based on SPM1222 was implemented in MATLAB (R2021b, TheMathWorksInc.,Natick USA) and comprised MNI normalization.Based on ATT and TTP, iWSA masks were semi-automatically segmented, as previously described6,8 (see Fig.2 A-C&G-I). The DICE coefficient of spatial overlap was determined subject-wise and group mean iWSAs (p>0.7) were calculated (see Fig.3). Possible systematic differences of parameter values inside iWSA were evaluated using Bland-Altman analyses.23-25 Lateralization indices (LI)26 were calculated for all parameters separately in ATT- and TTP-based iWSAs, and compared between patients and HCs (unpaired t-test, p<0.05).
Results
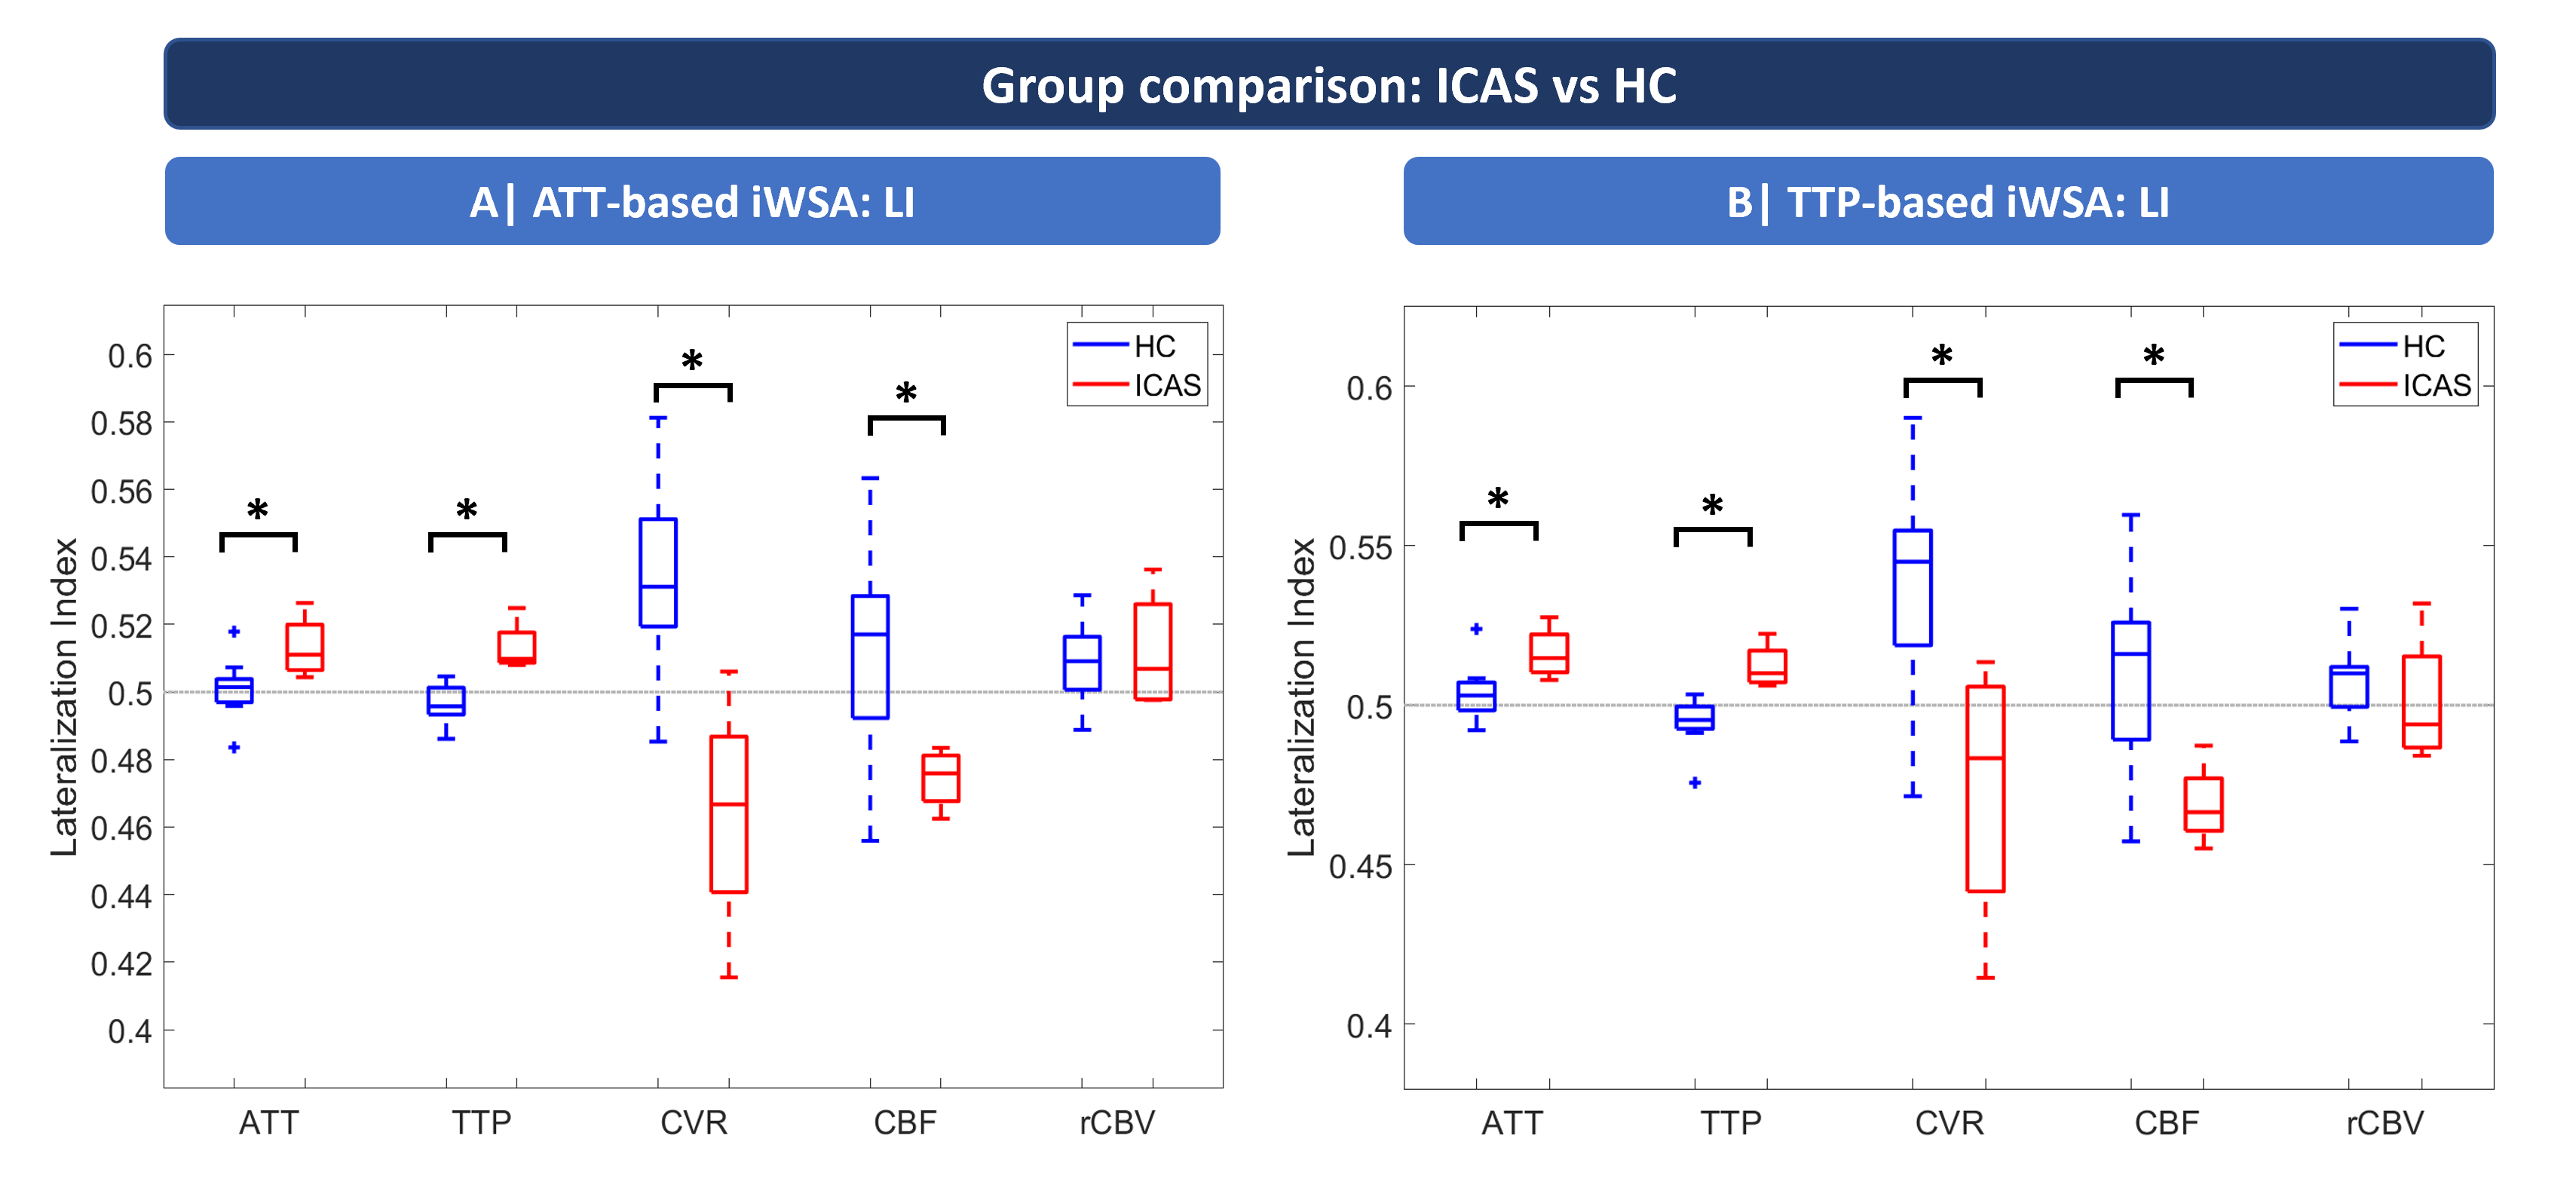
Exemplary data (Fig.2) show good concordance of iWSAs from ATT and TTP both for HC (A) and ICAS (G) (additional iWSA overlay on ATT (B,H) and TTP (C,I)). In the ICAS patient (G-L) ATT (H) and TTP (I) are ipsilaterally increased, while CVR (J) and CBF (K) are ipsilaterally reduced and rCBV shows no lateralization (L). Quantitative analysis of iWSA-overlap (Fig.3) revealed comparable group-average DICE (DICEHC=0.59±0.07, DICEICAS=0.57±0.03). ICAS’ probability values were ipsilaterally reduced (Fig.3,top right). Visually, mean iWSA overlap well (Fig.3,bottom) and Bland-Altmann analyses (Fig.4) revealed no systematic differences between hemodynamic parameters inside ATT- and TTP-based iWSAs (Fig.4). Lateralization analyses from ATT-based iWSA, in ICAS compared to HC, yielded significantly increased LI for ATT and TTP, lower LI for CVR and CBF and insignificant lateralization for rCBV (Fig.5A), resembling results from TTP-based iWSAs (Fig.5B).Discussion
As hypothesized, our results indicate good agreement of iWSA from ATT and TTP. While DICE coefficients were similar for HCs and ICAS, increased variability for ipsilateral iWSAs is expected in ICAS.6 Moderate DICE (≈0.58) might be explained by T2*-blooming in TTP-maps and rater-dependency. However, good agreement between parameter values extracted from ATT- and TTP-based iWSA is indicated by Bland-Altman plots (Fig.4), underlining reliability of quantitative analyses. Moreover, despite the small sample size, LI from ATT-based iWSAs revealed ipsilaterally impaired hemodynamics in ICAS. Increased LI for ATT and TTP and decreased LI for CVR and CBF resemble results in TTP-based iWSA, in excellent agreement with literature.9,26 The applicability of ATT-based iWSA is particularly highlighted by the sensitivity to impaired CVR, which was acquired independently of both sequences used for iWSA segmentation. Moreover, CVR is assumed to be an important indicator of ICAS-induced hemodynamic impairments.18Conclusion
In conclusion, iWSA segmented from non-invasive ATT are in good agreement with iWSA from TTP. In ICAS, ATT-based iWSA revealed ipsilaterally impaired hemodynamics in multiple parameters, including especially clinically promising CVR. Therefore, ATT-based iWSAs may be used for non-invasive longitudinal mapping of vascular border-zones in ICAS and other CVD such as Moyamoya.Acknowledgements
We would like to acknowledge support by the Ev. Studienwerk Villigst (personal grant to GH) and by the Deutsche Forschungsgemeinschaft (DFG, German Research Foundation) – project number 395030489.References
1. Petty, G.W., Brown Jr, R.D., Whisnant, J.P., Sicks, J.D., O’Fallon, W.M. & Wiebers, D.O. Ischemic stroke subtypes: a population-based study of incidence and risk factors. Stroke 30, 2513-2516 (1999).
2. Jörgensen, L. & Torvik, A. Ischaemic cerebrovascular diseases in an autopsy series Part 2. Prevalence, location, pathogenesis, and clinical course of cerebral infarcts. Journal of the neurological sciences 9, 285-320 (1969).
3. Momjian-Mayor, I. & Baron, J.-C. The pathophysiology of watershed infarction in internal carotid artery disease: review of cerebral perfusion studies. Stroke 36, 567-577 (2005).
4. van der Zwan, A., Hillen, B., Tulleken, C.A., Dujovny, M. & Dragovic, L. Variability of the territories of the major cerebral arteries. Journal of neurosurgery 77, 927-940 (1992).
5. van Laar, P.J., Hendrikse, J., Golay, X., Lu, H., van Osch, M.J. & van der Grond, J. In vivo flow territory mapping of major brain feeding arteries. Neuroimage 29, 136-144 (2006).
6. Kaczmarz, S., Griese, V., Preibisch, C., Kallmayer, M., Helle, M., Wustrow, I., Petersen, E.T., Eckstein, H.-H., Zimmer, C. & Sorg, C. Increased variability of watershed areas in patients with high-grade carotid stenosis. Neuroradiology 60, 311-323 (2018).
7. van Laar, P.J., Hendrikse, J., Klijn, C.J., Kappelle, L.J., van Osch, M.J. & van der Grond, J. Symptomatic carotid artery occlusion: flow territories of major brain-feeding arteries. Radiology 242, 526-534 (2007).
8. Schmitzer, L., Sollmann, N., Kufer, J., Kallmayer, M., Eckstein, H.H., Zimmer, C., Preibisch, C., Kaczmarz, S. & Gottler, J. Decreasing Spatial Variability of Individual Watershed Areas by Revascularization Therapy in Patients With High-Grade Carotid Artery Stenosis. J Magn Reson Imaging 54, 1878-1889 (2021).
9. Kaczmarz, S., Göttler, J., Petr, J., Hansen, M.B., Mouridsen, K., Zimmer, C., Hyder, F. & Preibisch, C. Hemodynamic impairments within individual watershed areas in asymptomatic carotid artery stenosis by multimodal MRI. Journal of Cerebral Blood Flow & Metabolism 41, 380-396 (2021).
10. European Medicines Agency (EMA). EMA's final opinion confirms restrictions on use of linear gadolinium agents in body scans. (2017).
11. Harvey, H.B., Gowda, V. & Cheng, G. Gadolinium deposition disease: a new risk management threat. Journal of the American College of Radiology 17, 546-550 (2020).
12. Marckmann, P., Skov, L., Rossen, K., Dupont, A., Damholt, M.B., Heaf, J.G. & Thomsen, H.S. Nephrogenic systemic fibrosis: suspected causative role of gadodiamide used for contrast-enhanced magnetic resonance imaging. Journal of the American Society of Nephrology 17, 2359-2362 (2006).
13. Semelka, R.C., Ramalho, J., Vakharia, A., AlObaidy, M., Burke, L.M., Jay, M. & Ramalho, M. Gadolinium deposition disease: initial description of a disease that has been around for a while. Magnetic resonance imaging 34, 1383-1390 (2016).
14. Gulani, V., Calamante, F., Shellock, F.G., Kanal, E. & Reeder, S.B. Gadolinium deposition in the brain: summary of evidence and recommendations. Lancet Neurol 16, 564-570 (2017).
15. Günther, M. Highly efficient accelerated acquisition of perfusion inflow series by cycled arterial spin labeling. in Proceedings of the 15th Annual Meeting of ISMRM (Berlin, 2007).
16. Hendrikse, J., Petersen, E.T., van Laar, P.J. & Golay, X. Cerebral border zones between distal end branches of intracranial arteries: MR imaging. Radiology 246, 572-580 (2008).
17. Mildner, T., Müller, K., Hetzer, S., Trampel, R., Driesel, W. & Möller, H.E. Mapping of arterial transit time by intravascular signal selection. NMR Biomed 27, 594-609 (2014).
18. Donahue, M.J., Achten, E., Cogswell, P.M., De Leeuw, F.E., Derdeyn, C.P., Dijkhuizen, R.M., Fan, A.P., Ghaznawi, R., Heit, J.J., Ikram, M.A., Jezzard, P., Jordan, L.C., Jouvent, E., Knutsson, L., Leigh, R., Liebeskind, D., Lin, W., Okell, T.W., Qureshi, A.I., Stagg, C.J., van Osch, M.J., van Zijl, P.C., Watchmaker, J.M., Wintermark, M., Wu, O., Zaharchuk, G., Zhou, J. & Hendrikse, J. Consensus statement on current and emerging methods for the diagnosis and evaluation of cerebrovascular disease. Journal of Cerebral Blood Flow & Metabolism 38, 1391-1417 (2018).
19. van Osch, M.J., Teeuwisse, W.M., Chen, Z., Suzuki, Y., Helle, M. & Schmid, S. Advances in arterial spin labelling MRI methods for measuring perfusion and collateral flow. Journal of Cerebral Blood Flow & Metabolism 38, 1461-1480 (2018).
20. Chappell, M.A., Groves, A.R., Whitcher, B. & Woolrich, M.W. Variational Bayesian inference for a nonlinear forward model. IEEE Transactions on Signal Processing 57, 223-236 (2009).
21. Woolrich, M.W., Jbabdi, S., Patenaude, B., Chappell, M., Makni, S., Behrens, T., Beckmann, C., Jenkinson, M. & Smith, S.M. Bayesian analysis of neuroimaging data in FSL. Neuroimage 45, S173-S186 (2009).
22. Wellcome Centre for Human Neuroimaging. Statistical Parametric Mapping Software (SPM 12).
23. Altman, D.G. & Bland, J.M. Measurement in Medicine: The Analysis of Method Comparison Studies. Journal of the Royal Statistical Society. Series D (The Statistician) 32, 307-317 (1983).
24. Bland, J.M. & Altman, D.G. Comparing methods of measurement: why plotting difference against standard method is misleading. Lancet 346, 1085-1087 (1995).
25. Martin Bland, J. & Altman, D. STATISTICAL METHODS FOR ASSESSING AGREEMENT BETWEEN TWO METHODS OF CLINICAL MEASUREMENT. The Lancet 327, 307-310 (1986).
26. Göttler, J., Kaczmarz, S., Nuttall, R., Griese, V., Napiórkowski, N., Kallmayer, M., Wustrow, I., Eckstein, H.-H., Zimmer, C. & Preibisch, C. The stronger one-sided relative hypoperfusion, the more pronounced ipsilateral spatial attentional bias in patients with asymptomatic carotid stenosis. Journal of Cerebral Blood Flow & Metabolism 40, 314-327 (2020).
Figures