1347
Analysis of Bolus Arrival Time in Moyamoya Disease Using Ultra-Fast 3D Dynamic Contrast-Enhanced MR Imaging by GRASP technique1Department of Diagnostic Imaging and Nuclear Medicine, Kyoto University Graduate School of Medicine, Kyoto, Japan, 2Department of Advanced Imaging in Medical Magnetic Resonance, Kyoto University Graduate School of Medicine, Kyoto, Japan, 3Department of Neurosurgery, Kyoto University Graduate School of Medicine, Kyoto, Japan
Synopsis
Keywords: Blood Vessels, DSC & DCE Perfusion, GRASP technique, Moyamoya disease
Motivation: To better understand the hemodynamics in moyamoya disease (MMD), high temporal and spatial resolution DCE-MRI using GRASP technique could estimate bolus arrival time (BAT) in MMD.
Goal(s): To find optimal condition for measuring BAT and to elucidate clinical value of BAT on MMD.
Approach: Thirty-seven MMD patients were included. Images with 5, 8, 13, and 21 spokes/frame were post-processed to derive time-intensity curves and estimate BATs.
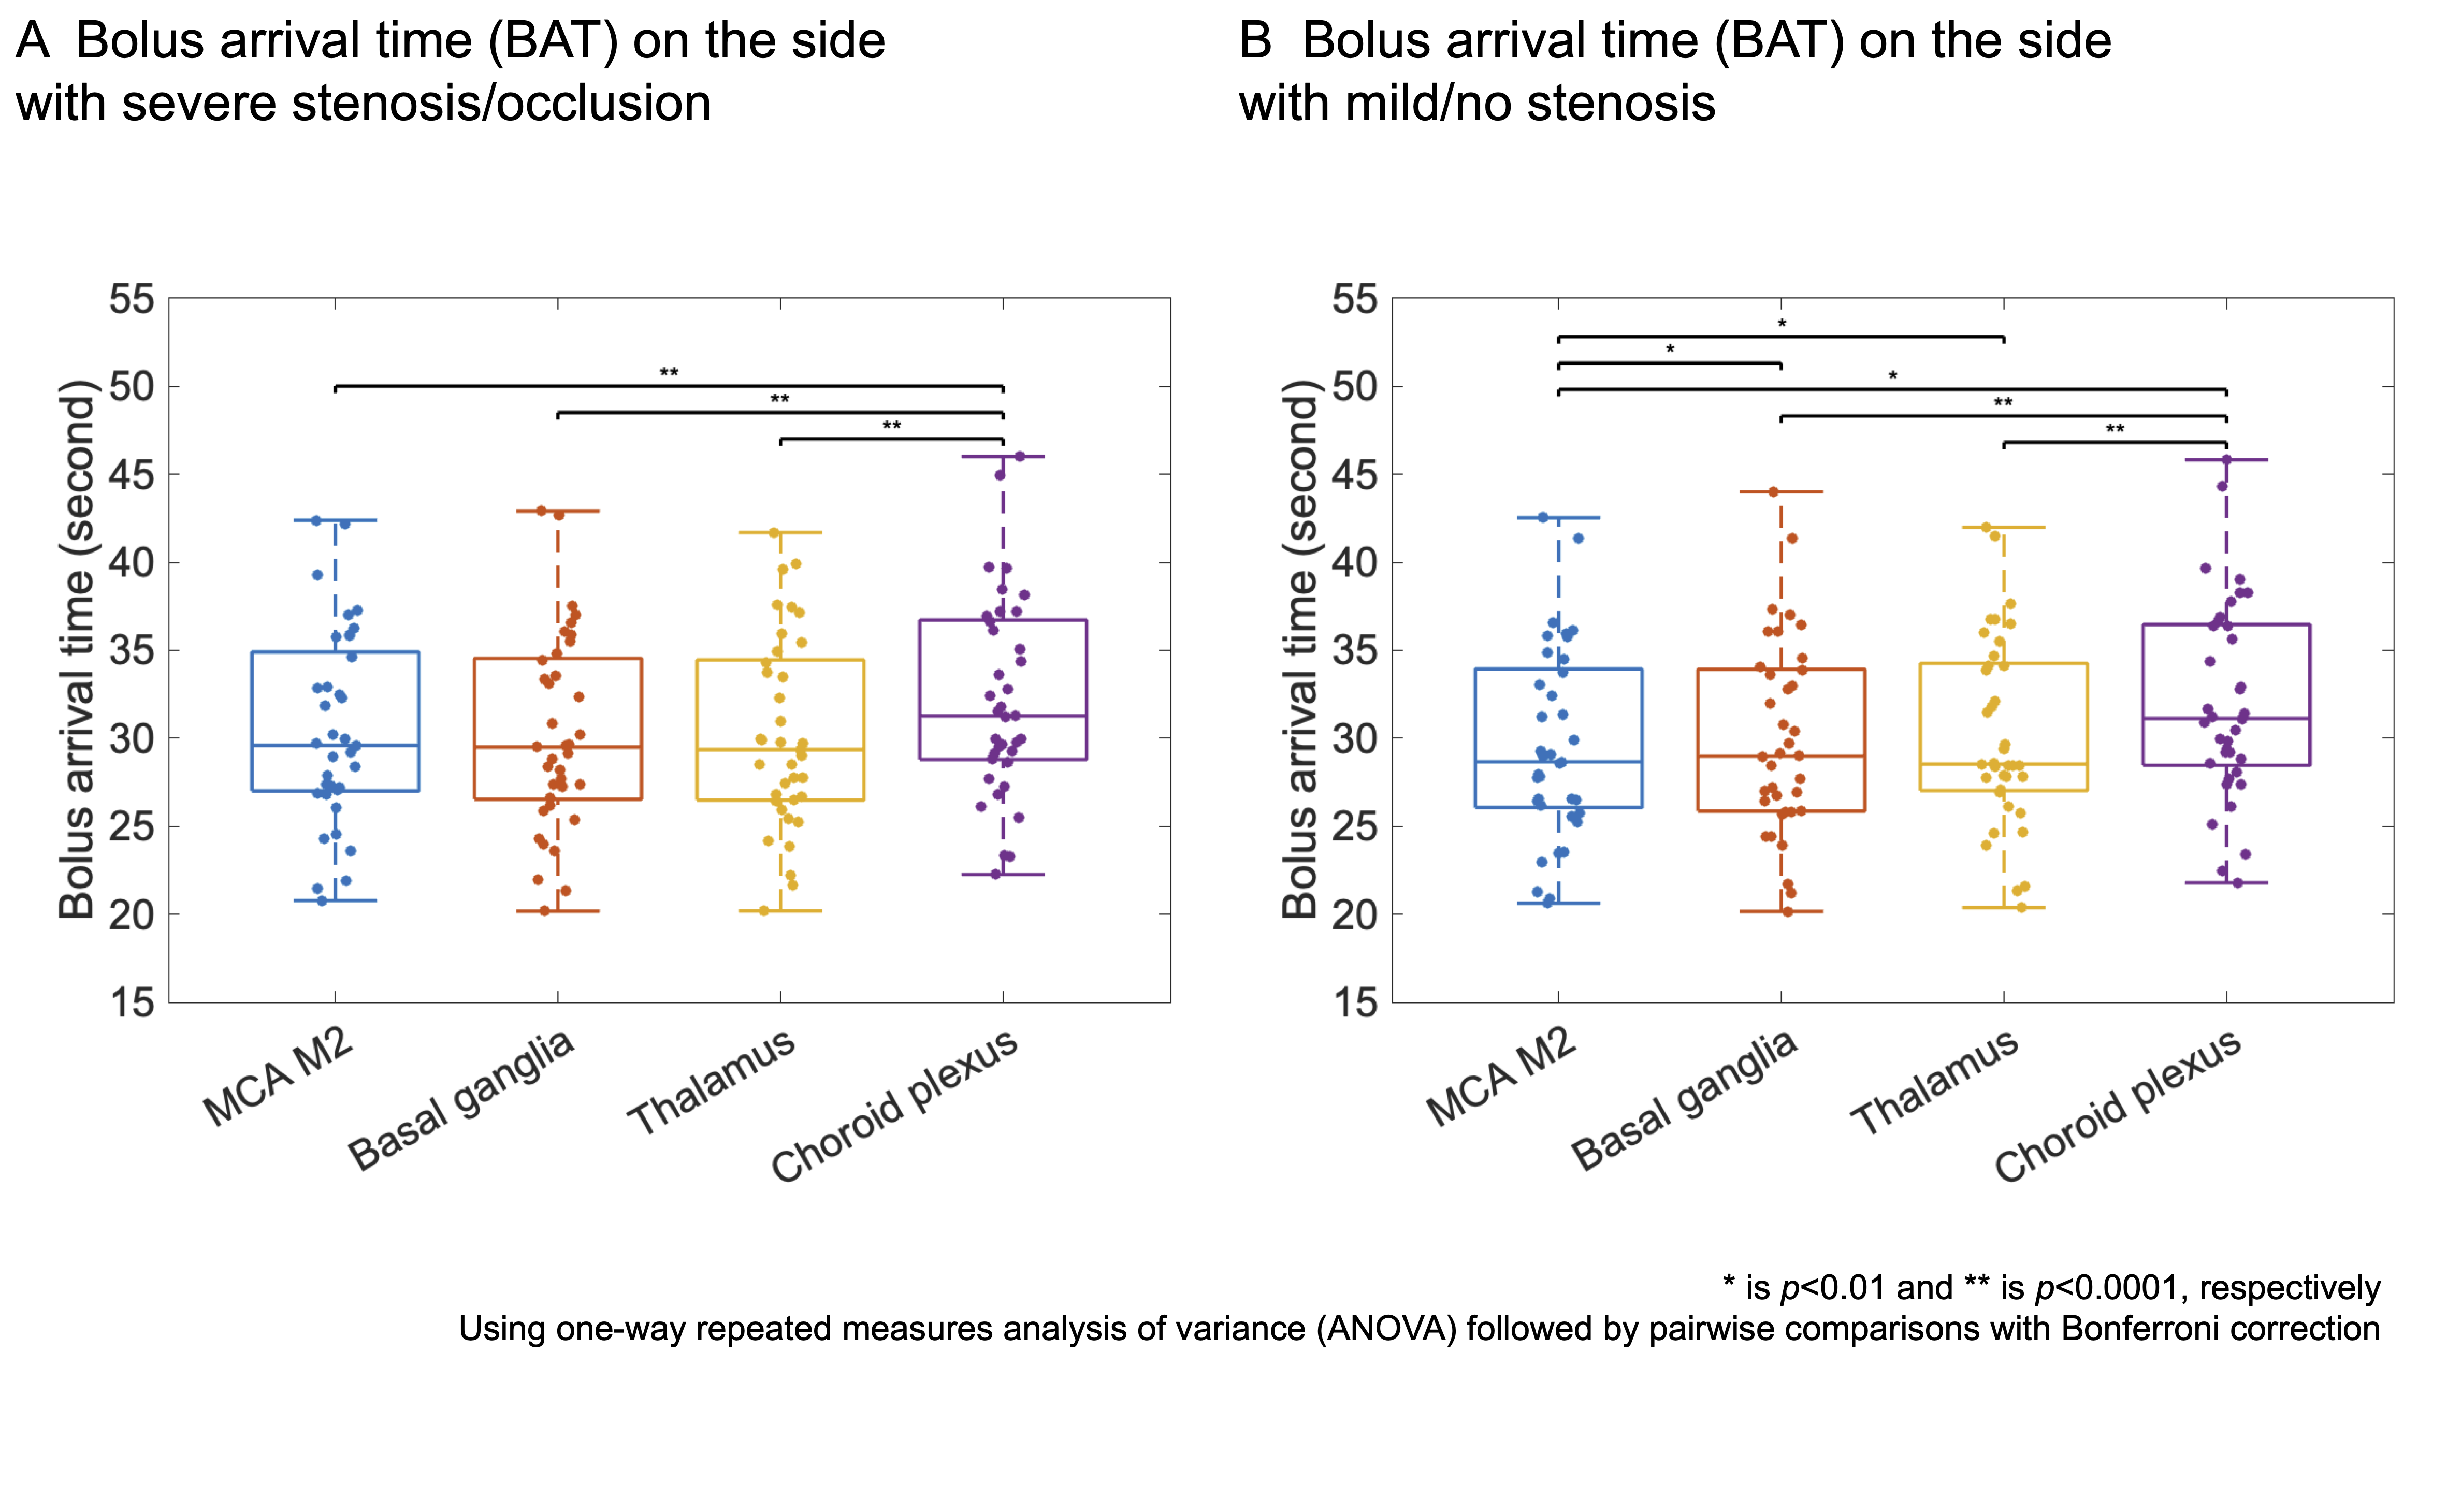
Results: Using the optimal 13 spokes/frame, BATs were delayed on the side with severe stenosis/occlusion and were in the order of MCA M2, basal ganglia, thalamus, and choroid plexus.
Impact: Bolus arrival time in moyamoya disease estimated by using high temporal and spatial resolution 3D dynamic contrast-enhanced MR imaging using GRASP technique facilitates our understanding of the hemodynamics in moyamoya disease by elucidating regional difference.
Introduction
Moyamoya disease (MMD) is characterized by the steno-occlusion of the circle of Willis, especially the terminal internal carotid arteries, with moyamoya vessels compensating for the insufficient blood supply. Various imaging modalities have reported the hemodynamics in MMD1. However, precise estimation of bolus arrival time (BAT) on contrast-enhanced MR imaging has been challenging due to low temporal and spatial resolution. Recently, ultra-fast 3D dynamic contrast-enhanced MR imaging (DCE-MRI) using Golden angle RAdial Sparse Parallel (GRASP) technique was developed2. We aimed to use high temporal and spatial resolution of GRASP technique to estimate BAT in MMD.Methods
SubjectsUnder IRB approval, we enrolled preoperative patients clinically diagnosed as MMD3 who underwent DCE-MRI using GRASP technique between October 2018 and September 2023. Thirty-seven patients, consisting of 16 patients with unilateral MMD and 21 patients with MMD with unilateral side predominance, were included (mean age 28.5, range 5–66 years; 27 females).
Image Acquisition
Radial vibe sequence was performed using 3T MR scanners (Skyra or Prisma; Siemens Healthineers) with a preceding 10-second scan before the administration of contrast agent. Acquisition parameter was as follows: TR/TE, 3.25/1.53 ms; FA, 9 °; BW, 890 Hz/pixel; FOV, 250 × 250 mm2; base resolution, 256; number of slices, 52; slice thickness, 1.0 mm; acquisition time, 1 minute and 37 seconds; total number of spokes, 600.
Image Reconstruction and Creation of BAT Map
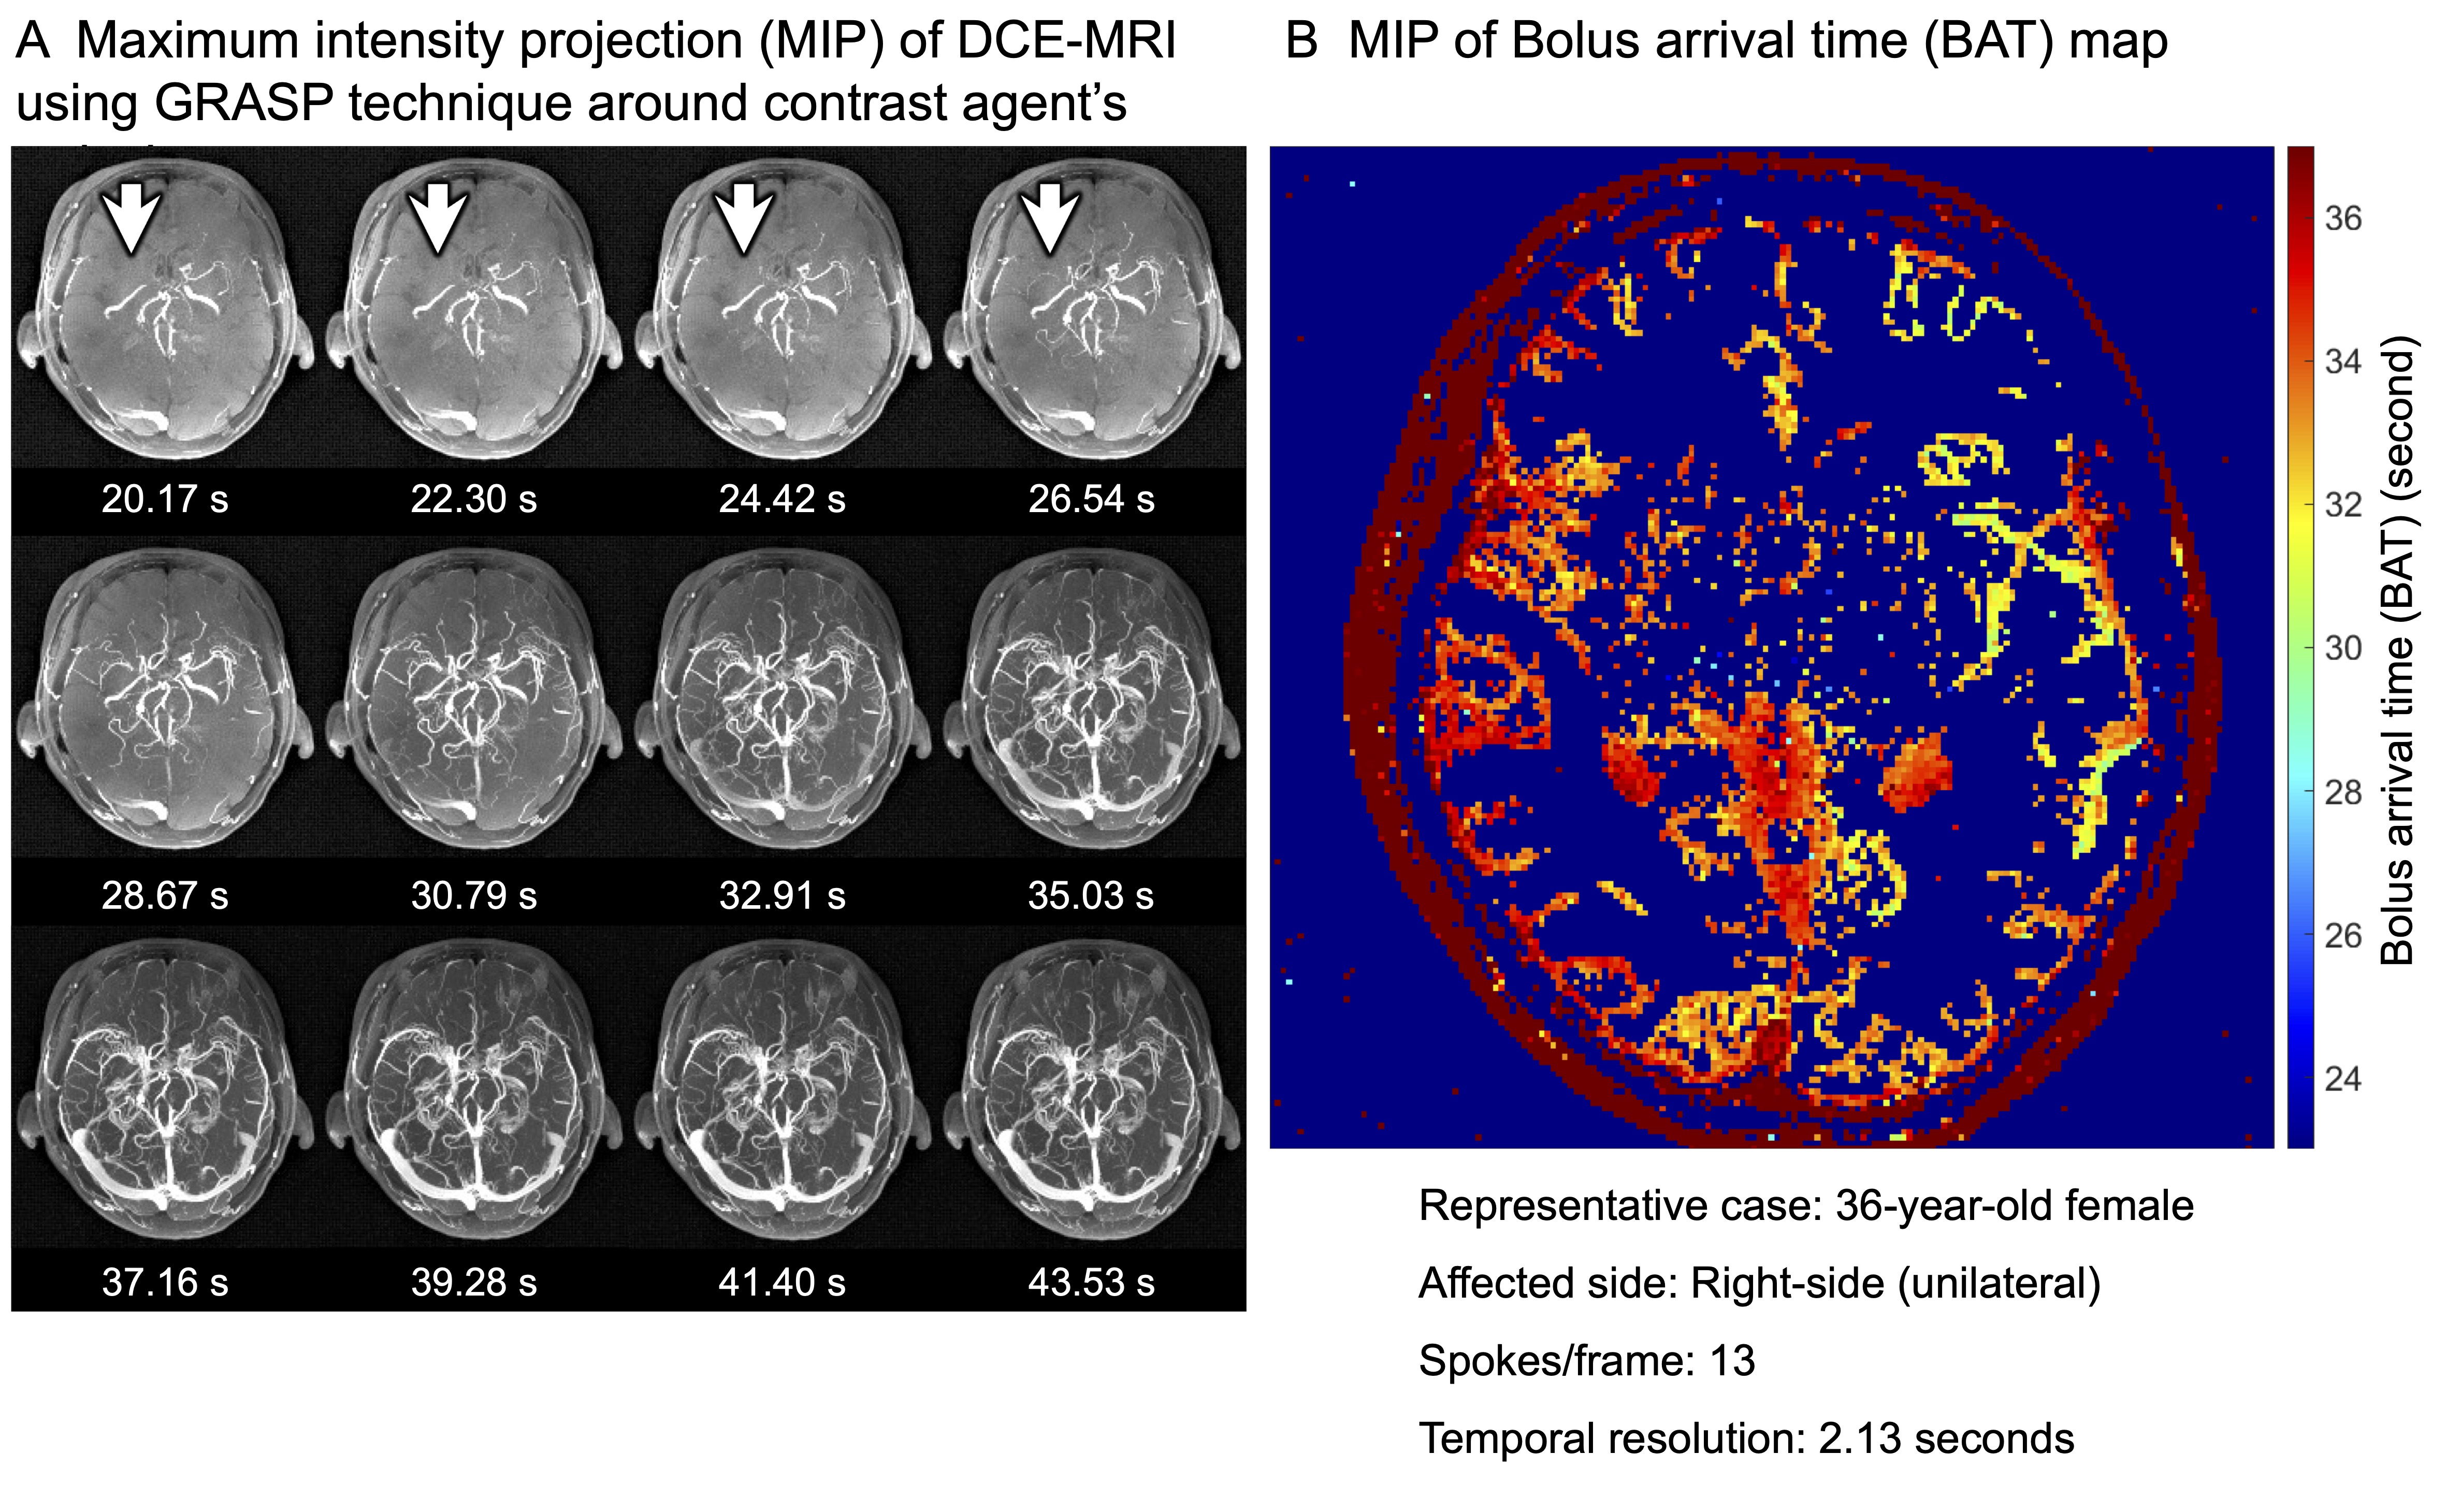
Images were reconstructed using a dedicated offline reconstruction software4. Temporal resolution of reconstructed DCE-MRI (Figure 1A) was determined by number of spokes/frame, taken from the Fibonacci number5. BAT map (Figure 1B) was created by analyzing DCE-MRI voxel-by-voxel using in-house MATLAB script6, which first fitted the data to the time-intensity curve (TIC) based on the Tofts’ pharmacokinetic model7, extracted the maximum slope, and then estimated BAT. BAT was defined as an intersection between the baseline and the maximum slope line. Note that BAT showed the time after the beginning of the imaging sequence.
Image Analysis
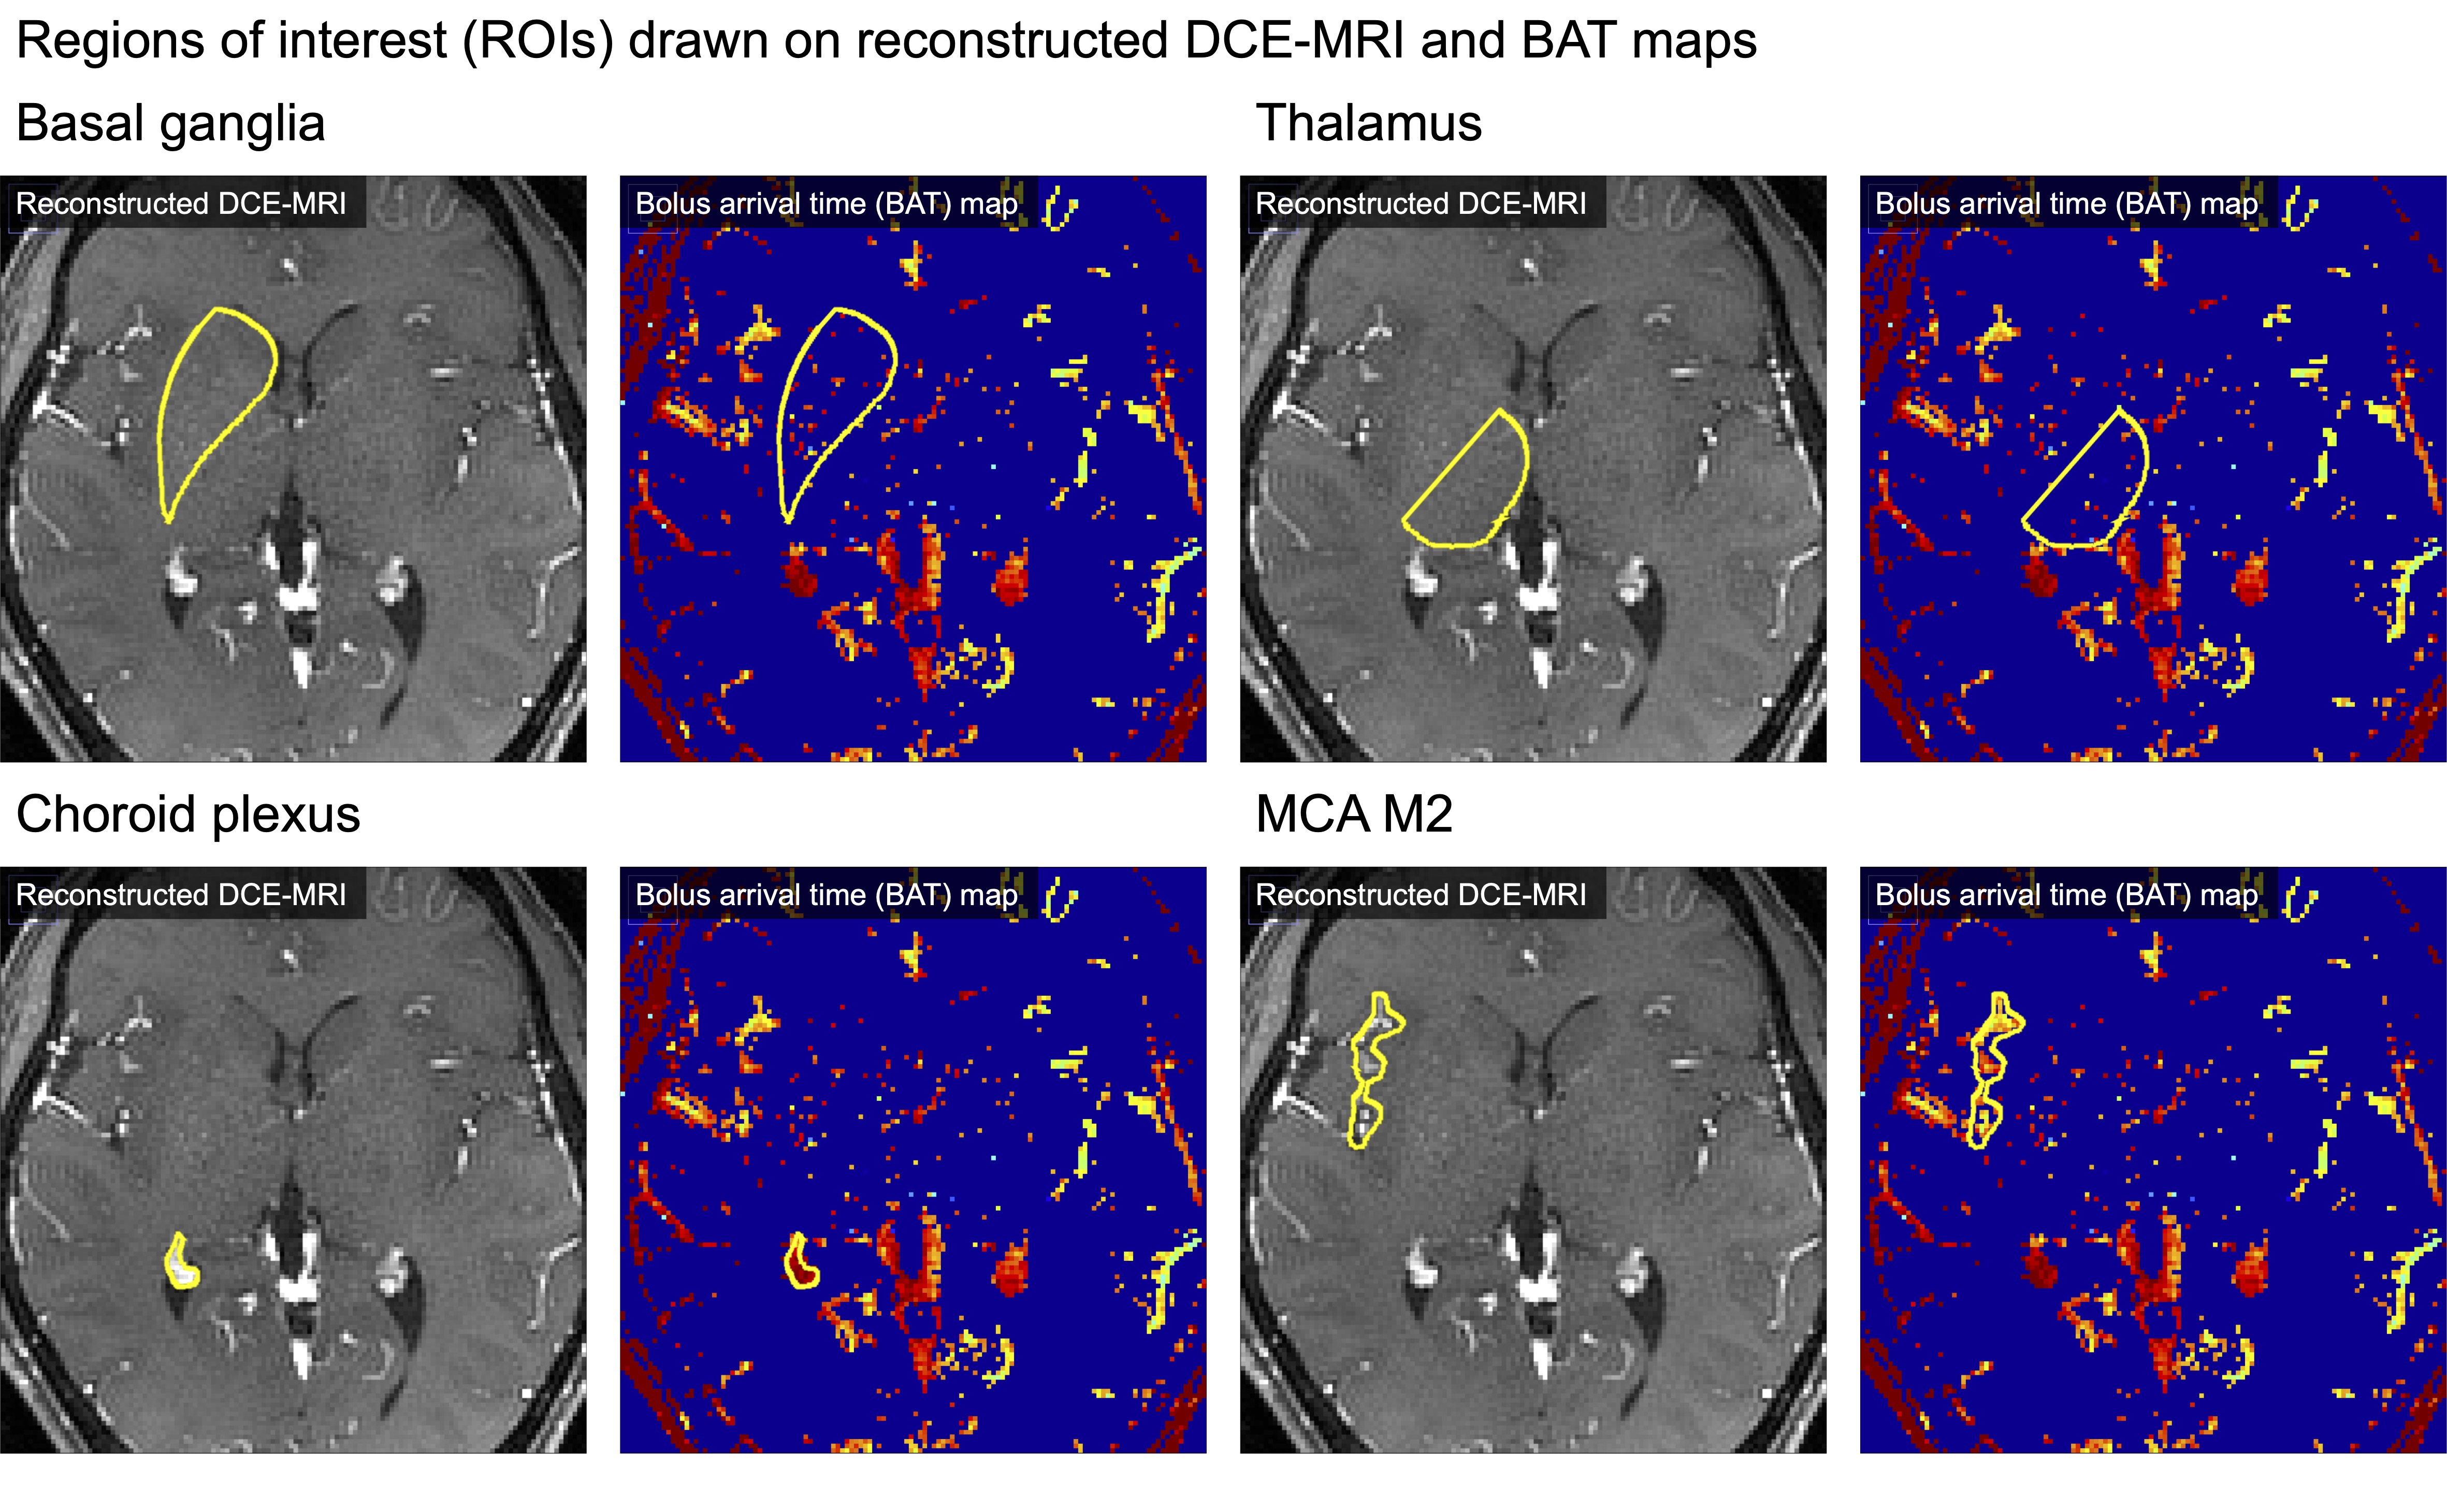
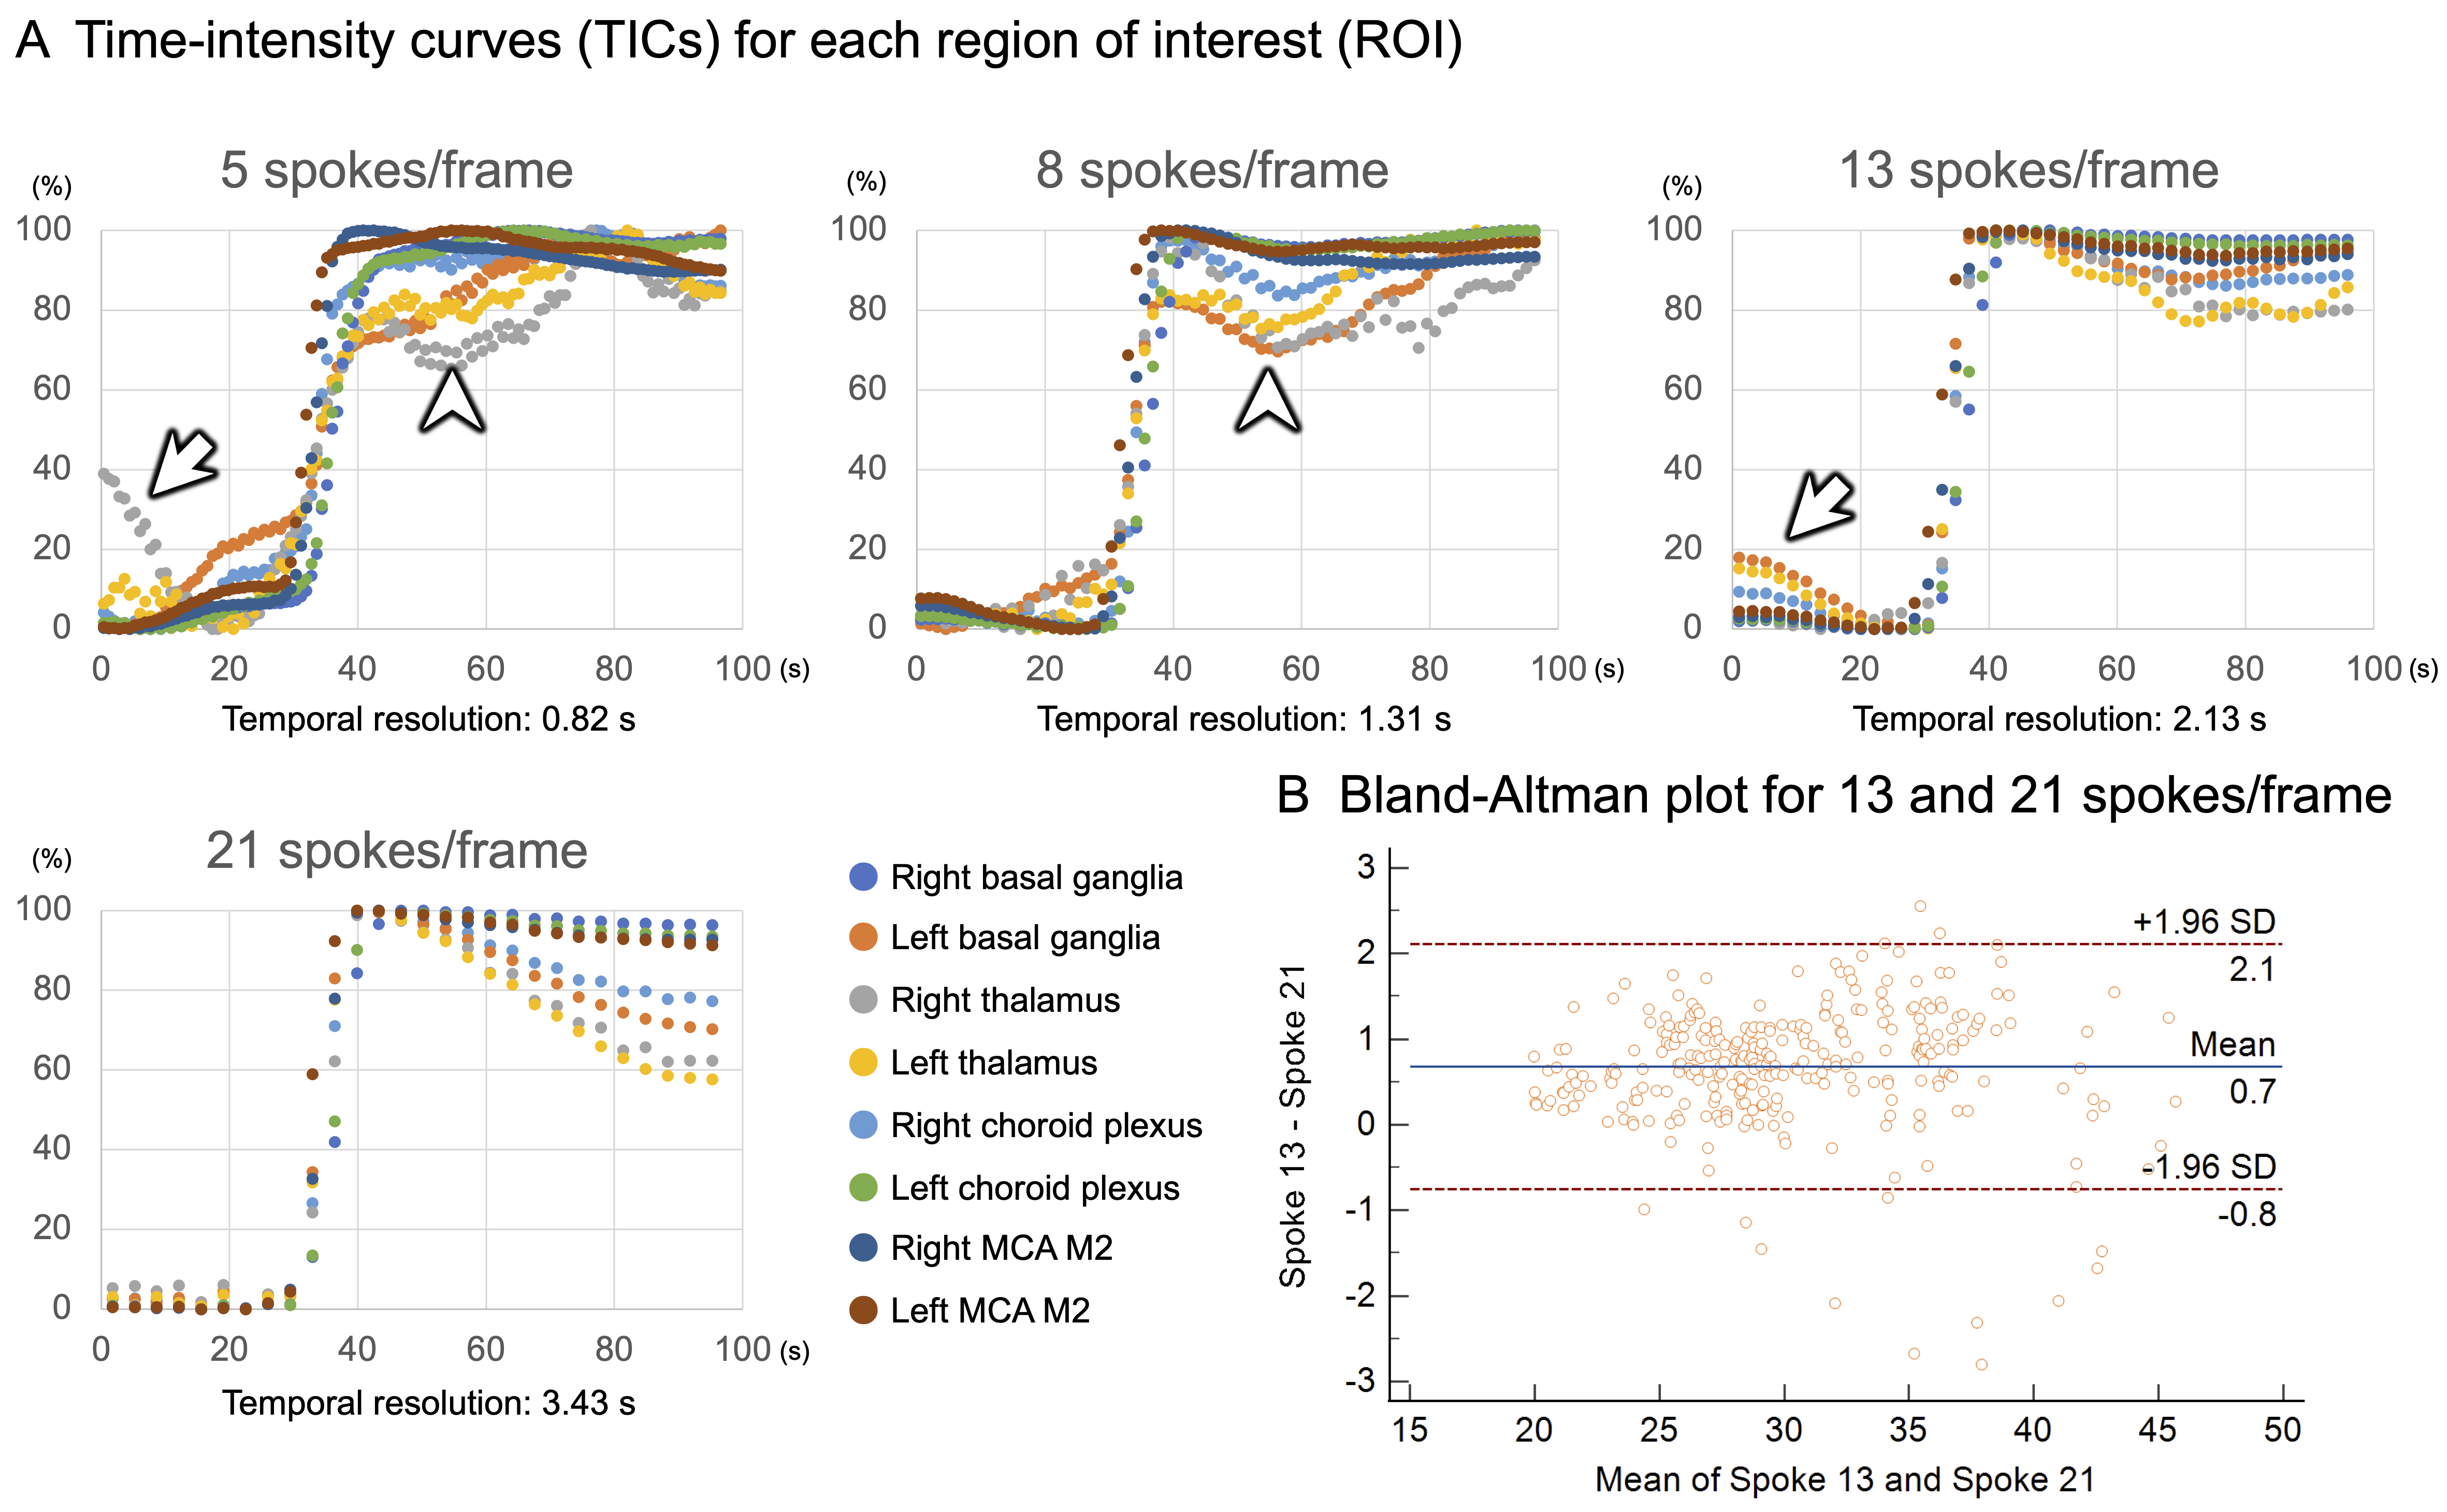
Regions of interest (ROIs) for bilateral basal ganglia, thalami, choroid plexus, and MCA M2 were drawn manually on DCE-MRI and BAT maps with 5, 8, 13, and 21 spokes/frame using ImageJ (Figure 2). TICs were obtained from each ROI on DCE-MRI. BATs within each ROI were measured on BAT map. TICs with different spokes/frame were visually compared focusing on constancy of signal intensity, especially around the slope. BATs were compared between 13 and 21 spokes/frame by assessing agreement using Bland-Altman plot. BAT delay was defined as mean delay of BATs between the side with severe stenosis/occlusion and the contralateral side (mild/no stenosis) for each ROI.
Statistical Analysis
BATs were compared between sides using the Student’s t-test. BATs for each ROI on the same side were compared using one-way repeated measures analysis of variance (ANOVA) followed by pairwise comparison with Bonferroni correction.
Results
Optimization of Spokes for BAT EstimationTICs in a representative case with right-sided unilateral MMD are shown (Figure 3A). The temporal resolution of 5, 8, 13, and 21 spokes/frame were 0.82, 1.31, 2.13, and 3.43 seconds, respectively. Five and 8 spokes/frame showed inconstant signal intensity after contrast arrival. Meanwhile, 13 spokes/frame showed relatively constant signal intensity after contrast arrival. Twenty-one spokes/frame showed overall constant signal intensity. The Bland-Altman plot revealed good concordance between 13 and 21 spokes/frame (Figure 3B). Considering temporal resolution, spoke 13 was selected for optimal condition.
Comparison of BATs
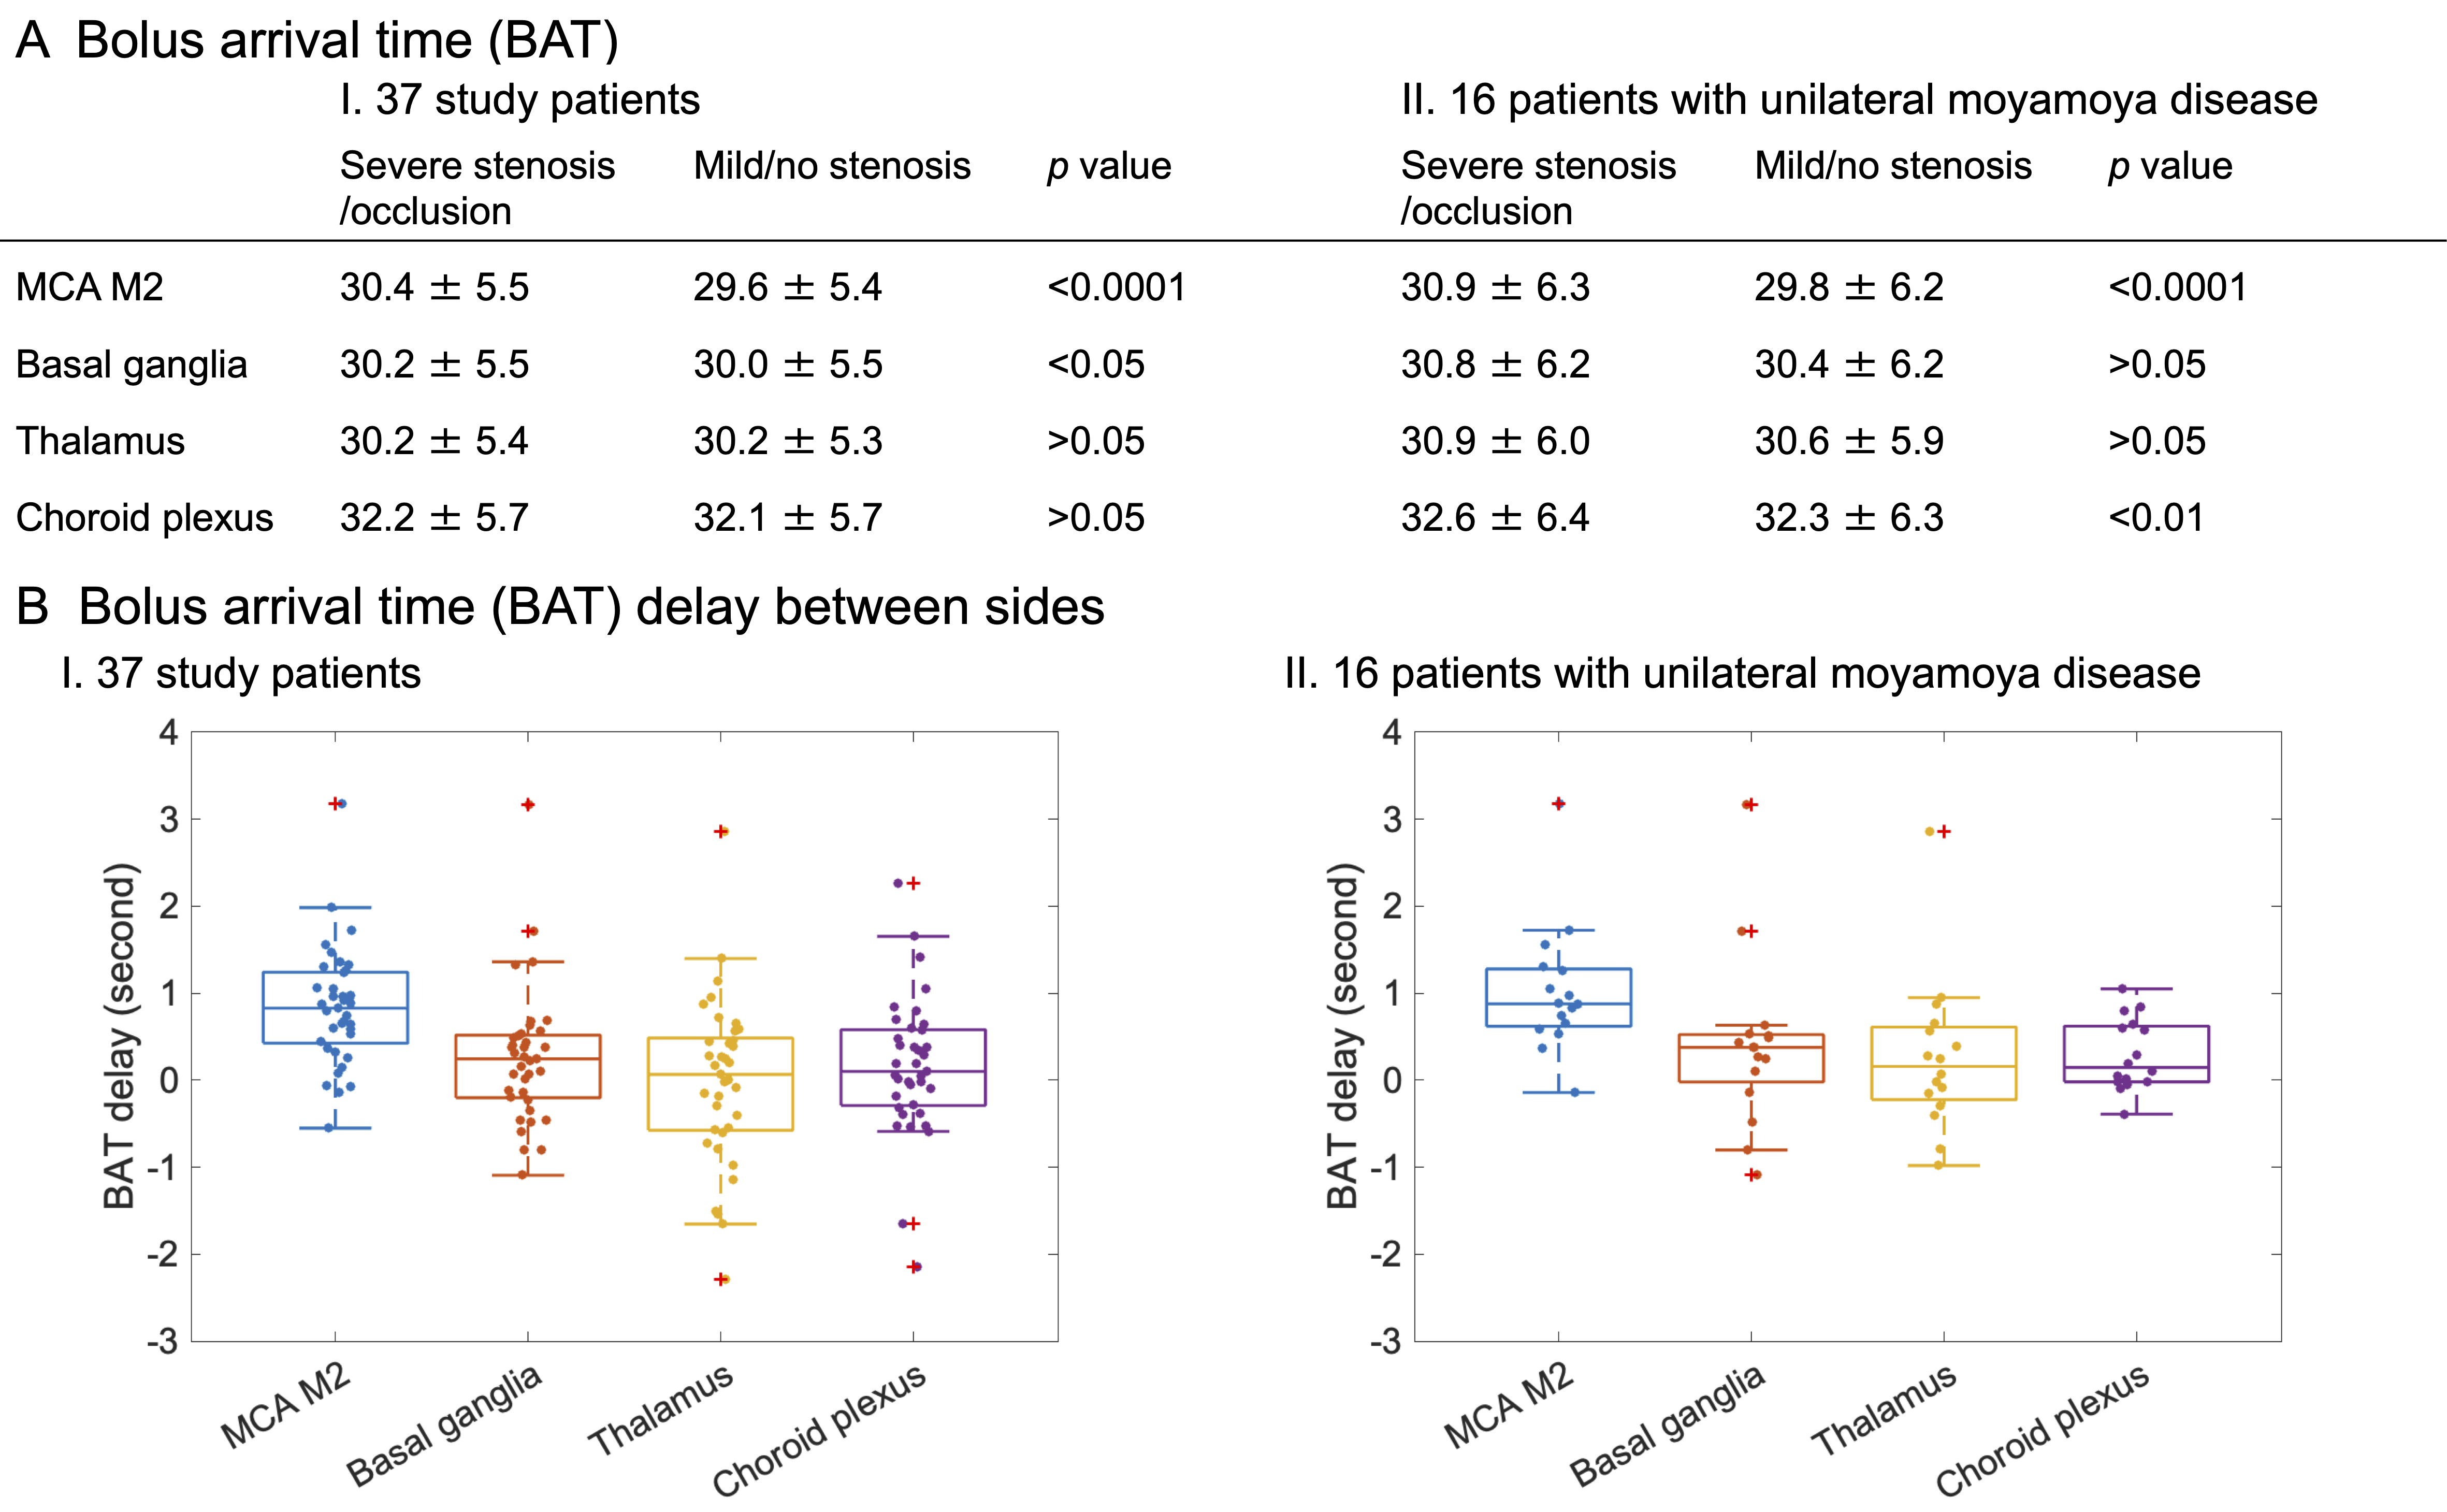
On the side with severe stenosis/occlusion, BATs were significantly delayed in the MCA M2 and the basal ganglia (Figure 4AI and BI). BAT delays were larger in unilateral MMD (Figure 4AII and BII). On the side with severe stenosis/occlusion, BATs were earlier in the basal ganglia, the thalamus, and the MCA M2 than in the choroid plexus (Figure 5A). On the contralateral side (mild/no stenosis), BATs were the earliest in the MCA M2 and significantly earlier in the basal ganglia and the thalamus than in the choroid plexus (Figure 5B).
Discussion
In the GRASP technique, smaller number of spokes/frame achieves higher temporal resolution, however signal intensity becomes unreliable due to undersampling. Based on this fundamental dilemma, 13 spokes/frame was the optimal. Significant BAT delay between sides reflecting severe stenosis/occlusion in MMD were revealed. The unique order of BATs on the same side was consistent with previously reported findings of earlier blood arrival in the anterior circulation compared to the posterior circulation8.Conclusion
Thirteen spokes/frame was the optimal for measuring BATs in MMD on DCE-MRI using GRASP technique. We elucidated initial profile of BAT in preoperative MMD, which provides a basis for further investigation of BAT in MMD.Acknowledgements
No acknowledgement found.References
- Lee M, Zaharchuk G, Guzman R, Achrol A, Bell-Stephens T, Steinberg GK: Quantitative hemodynamic studies in moyamoya disease: a review. Neurosurg Focus 2009, 26(4):E5.
- Feng L, Grimm R, Block KT, Chandarana H, Kim S, Xu J, Axel L, Sodickson DK, Otazo R: Golden-angle radial sparse parallel MRI: combination of compressed sensing, parallel imaging, and golden-angle radial sampling for fast and flexible dynamic volumetric MRI. Magn Reson Med 2014, 72(3):707-717.
- Kuroda S, Fujimura M, Takahashi J, Kataoka H, Ogasawara K, Iwama T, Tominaga T, Miyamoto S, Research Committee on Moyamoya Disease of the Ministry of Health L, Welfare J: Diagnostic Criteria for Moyamoya Disease - 2021 Revised Version. Neurol Med Chir (Tokyo) 2022, 62(7):307-312.
- Block KT, Yarra SD: An Open Software Framework for Clinical Evaluation of Reconstruction Prototypes. In: ISMRM Workshop on Data Sampling and Image Reconstruction, Sedona, USA.
- Feng L: Golden-Angle Radial MRI: Basics, Advances, and Applications. J Magn Reson Imaging 2022, 56(1):45-62.
- Fujimoto K, Fushimi Y, Funaki T, Nakajima S, Yokota Y, Oshima S, Otani S, Sakurama A, Pandu KW, Okada T et al: Toward the hemodynamic analysis of Moyamoya disease using ultra-fast DCE-MRI by GRASP. In: Proceedings of the ISMRM Virtual Conference: 2020; 2020. P.1661.
- Tofts PS, Brix G, Buckley DL, Evelhoch JL, E.Henderson, Knopp MV, Larsson HB, Lee TY, Mayr NA, Parker GJ et al: Estimating kinetic parameters from dynamic contrast-enhanced T(1)-weighted MRI of a diffusable tracer: standardized quantities and symbols. J Magn Reson Imaging 1999, 10(3):223-232.
- Philip M. Robson P, Weiying Dai P, Ajit Shankaranarayanan P, Neil M. Rofsky M, David C. Alsop P: Time-resolved Vessel-selective Digital Subtraction MR Angiography of the Cerebral Vasculature with Arterial Spin Labeling. Radiology 2010, 257:507-515.
Figures