1345
Aneurysm Wall Permeability in Assessing Non-Saccular Intracranial Aneurysms Rupture Risk Based on DCE-MRI1Center for Biomedical Imaging Research, Tsinghua University, Beijing, China, 2Department of Neurosurgery, Beijing Tiantan Hospital, Beijing Neurosurgical Institute, Capital Medical University, Beijing, China
Synopsis
Keywords: Blood Vessels, Permeability
Motivation: Evaluating intracranial aneurysm (IA) risk holds significant clinical importance. Recent studies have proposed wall permeability (Ktrans) as a significant risk predictor, but its validity in non-saccular aneurysms remains unclear.
Goal(s): Our study aims to predict non-saccular IA rupture by Ktrans from DCE-MRI.
Approach: Ktrans was derived from the extended Kety/Tofts model. We analyzed correlation between Ktrans and IA size, the Population, Hypertension, Age, Size, Earlier Subarachnoid Hemorrhage, and Site (PHASES) score and other clinical factors.
Results: Ktrans significantly related to IA size and PHASES score, but there was no correlation between Ktrans and intramural hematoma (IMH) and wall enhancement index (WEI).
Impact: By analyzing correlation between aneurysm wall permeability (Ktrans) and other risk factors of non-saccular aneurysms rupture, we found that Ktrans might be a risk indicator for rupture of non-saccular IAs.
Introduction
Intracranial aneurysm (IA) affects roughly 3.2% of the population1, whose rupture is the most common cause of spontaneous subarachnoid hemorrhage (SAH)2. Despite the efficacy of prophylactic surgery in preventing aneurysm rupture, patients bear the potential risks of the surgery. Consequently, it is important to assess the risk of IA rupture accurately. Currently, clinical practice often relies on aneurysm size and the PHASES score (Population, Hypertension, Age, Size, Earlier Subarachnoid Hemorrhage, and Site)3 to evaluate the risk of aneurysm rupture. Intramural hematoma (IMH) may also lead to the rupture of IAs4. Recent studies have proposed wall permeability (Ktrans) as a significant rupture risk predictor for saccular IAs5. Through the utilization of the dynamic contrast-enhanced magnetic resonance imaging (DCE-MRI), Vakil et al6 revealed that high risk aneurysms were associated with higher Ktrans. Qi, H. et al7 proposed complementary roles of DCE-MRI and postcontrast vessel wall imaging in detecting high-risk IAs. However, there exists a substantial divergence between saccular and non-saccular aneurysms8. Consequently, the conclusions may not be applicable to non-saccular IAs. On the basis of our previous research9, we expanded the sample size to further evaluate the role of wall permeability in predicting the risk of non-saccular aneurysms.Methods
Subjects: 42 patients with non-saccular IAs diagnosed by CTA, DSA or MRA were included in this study. Pregnant or breastfeeding women or patients with any contraindications to MRI were excluded. We collected the demography and clinical risk factors such as hypertension, diabetes and IMH.Imaging Protocol: 3D black blood T1-weighted volume isotropic turbo spin echo acquisition (VISTA) were used for capturing pre- and post-contrast aneurysm wall images. Pre-contrast T1 mapping was performed using a 3D variable flip angle sequence. Then DCE images were acquired using 3D T1-weighted spoiled gradient-echo sequences.
Imaging Analysis: The 3D time-of-flight (TOF) (Figure 1A), pre-contrast (Figure 1B) and post-contrast (Figure 1C) images showed the non-saccular aneurysm. Ktrans was derived from the extended Kety/Tofts model10 based on DCE-MRI. The region of interest (ROI) of the plasma contrast agent concentration (Cp) and contrast agent concentration in the tissue surrounding the aneurysm wall (Ct) were manually delineated (Figure 1D, 1E). Ct was calculated using signal intensity values in DCE images and pre-contrast T1 mapping data. Then Ktrans was obtained by fitting pixel by pixel in ROI. The wall enhancement index (WEI)11 was introduced to quantify the degree of wall enhancement, which was calculated from pre- and post-contrast VISTA.
Statistical Analysis: Categorical variables were presented as counts (percentages), while stage scores were summarized using medians (interquartile range, [IQR]). We employed the Kolmogorov-Smirnov test to assess the normal distribution of each continuous variable, after which we expressed these variables as either mean ± SD or median (interquartile range, [IQR]). Spearman correlation analysis was conducted to investigate the associations between Ktrans and IA size, PHASES score, IMH, as well as WEI. All statistical analyses were conducted using two-tailed tests with SPSS (IBM, Armonk, New York). P < 0.05 was considered statistically significant.
Results
Clinical factors of patients and their Spearman analysis with Ktrans were outlined in Table 1. There were no correlation between Ktrans and clinical factors, excepting IA size and PHASES score. Figure 2 demonstrated two cases with similar high WEI, but their Ktrans presented variations (case 1: Ktrans = 0.048 min-1; case 2: Ktrans = 0.096 min-1). Moreover, case 1 (IA size = 11.1 mm, PHASES score = 11) has lower PHASES score and smaller IA size than case 2 (IA size = 22 mm, PHASES score = 15), which aligned with Ktrans. Spearman correlation analysis showed that Ktrans correlated with IA size (ρ = 0.386, P = .012) and PHASES score (ρ = 0.323, P = .037) (Figure 3). However, Ktrans was not significantly associated with IMH (P = .324) and WEI (P = .091) (Figure 4).Discussion and Conclusion
With a larger sample size compared to our previous study9, we further found that wall permeability was significantly correlated with IA size and PHASES score, indicating that Ktrans might be a risk indicator for non-saccular IA rupture. Moreover, in contrast to our earlier study9, we demonstrated that Ktrans did not significantly differ between the two groups, with and without IMH. We also found that Ktrans and WEI were not correlated, which aligned with our expectations, as Ktrans was calculated outside the vessel wall. It suggested that Ktrans might provide new information other than WEI. In the future, we will utilize a larger sample size to enhance the robustness of our study. Moreover, we will conduct longitudinal study to investigate the value of Ktrans in non-saccular IA rupture prediction.Acknowledgements
None.References
1. Vlak, Monique HM, et al. "Prevalence of unruptured intracranial aneurysms, with emphasis on sex, age, comorbidity, country, and time period: a systematic review and meta-analysis." The Lancet Neurology 10.7 (2011): 626-636.
2. Van Gijn, Jan, Richard S. Kerr, and Gabriel JE Rinkel. "Subarachnoid haemorrhage." The Lancet 369.9558 (2007): 306-318.
3. Greving, Jacoba P., et al. "Development of the PHASES score for prediction of risk of rupture of intracranial aneurysms: a pooled analysis of six prospective cohort studies." The Lancet Neurology 13.1 (2014): 59-66.
4. Sandhu, Harleen K., et al. "Outcomes and management of type A intramural hematoma." Annals of Cardiothoracic Surgery 5.4 (2016): 317.
5. Haikun, Qi, Peng Liu, and Huijun Chen. "Intracranial aneurysm wall permeability: a potential risk predictor for rupture." Proc. Intl. Soc. Mag. Reson. Med. Vol. 24. 2016.
6. Vakil, P., et al. "Quantifying intracranial aneurysm wall permeability for risk assessment using dynamic contrast-enhanced MRI: a pilot study." American Journal of Neuroradiology 36.5 (2015): 953-959.
7. Qi, H., et al. "Complementary roles of dynamic contrast-enhanced MR imaging and postcontrast vessel wall imaging in detecting high-risk intracranial aneurysms." American Journal of Neuroradiology 40.3 (2019): 490-496.
8. Kurtelius, Arttu, et al. "Association of intracranial aneurysms with aortic aneurysms in 125 patients with fusiform and 4253 patients with saccular intracranial aneurysms and their family members and population controls." Journal of the American Heart Association 8.18 (2019): e013277.
9. Yan, L., et al. "Predicting the Risk of Non-Saccular Aneurysms Based on the Dynamic Contrast-Enhanced Magnetic Resonance Imaging." ISMRM Annual Meeting, June 3-8, 2023, Toronto, 2023. Abstract No. 2958.
10. Tofts, Paul S., et al. "Estimating kinetic parameters from dynamic contrast‐enhanced T1‐weighted MRI of a diffusable tracer: standardized quantities and symbols." Journal of Magnetic Resonance Imaging: An Official Journal of the International Society for Magnetic Resonance in Medicine 10.3 (1999): 223-232.
11. Omodaka, S., et al. "Quantitative assessment of circumferential enhancement along the wall of cerebral aneurysms using MR imaging." American Journal of Neuroradiology 37.7 (2016): 1262-1266.
Figures
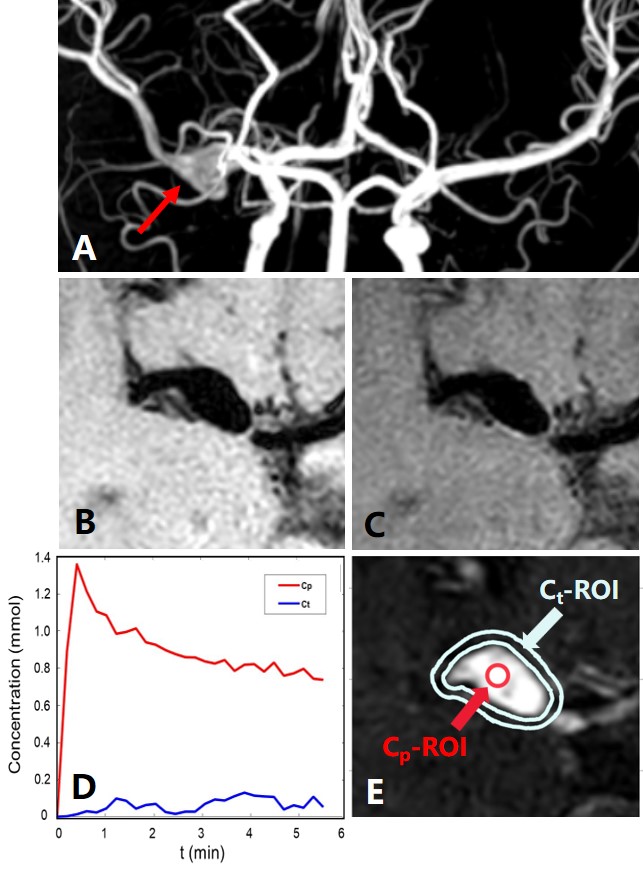
Figure 1. The permeability of the non-saccular aneurysm wall is measured by DCE-MRI. The intracranial aneurysm is verified non-saccular by analysis of 3D TOF images (A), pre (B) and post-contrast (C) images. Plasma contrast agent concentration (Cp) and contrast agent concentration in the tissue surrounding the aneurysm wall (Ct) (D) are obtained by manually delineating regions of interest of Cp and Ct (E).
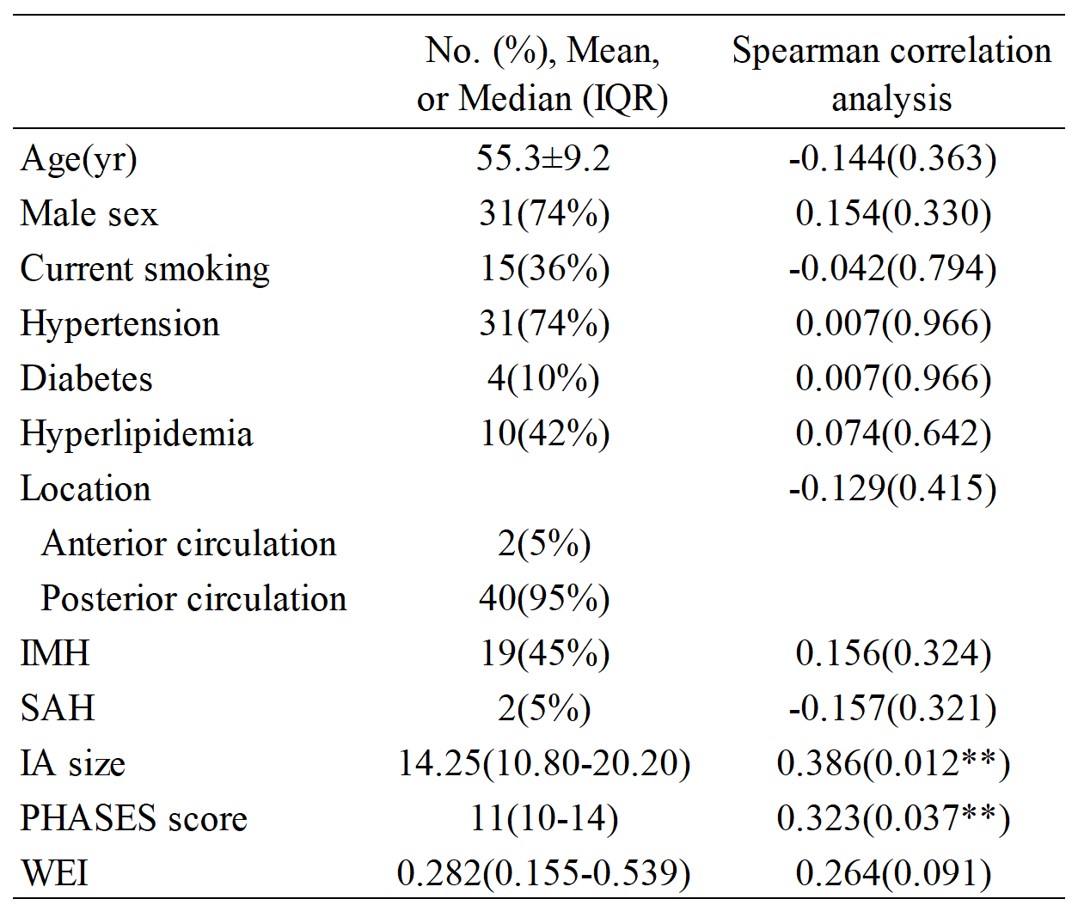
Table 1. Demographic information of the sample (N=42) and correlation with Ktrans. Categoric variables are summarized as count (percentage). The Kolmogorov-Smirnov test was used to test the existence of normal distribution for each continuous variable, and then the quantitative variables were expressed as mean ± SD or median (IQR). Spearman analysis show that there is no correlation between Ktrans and clinical factors, excepting IA size and PHASES score.
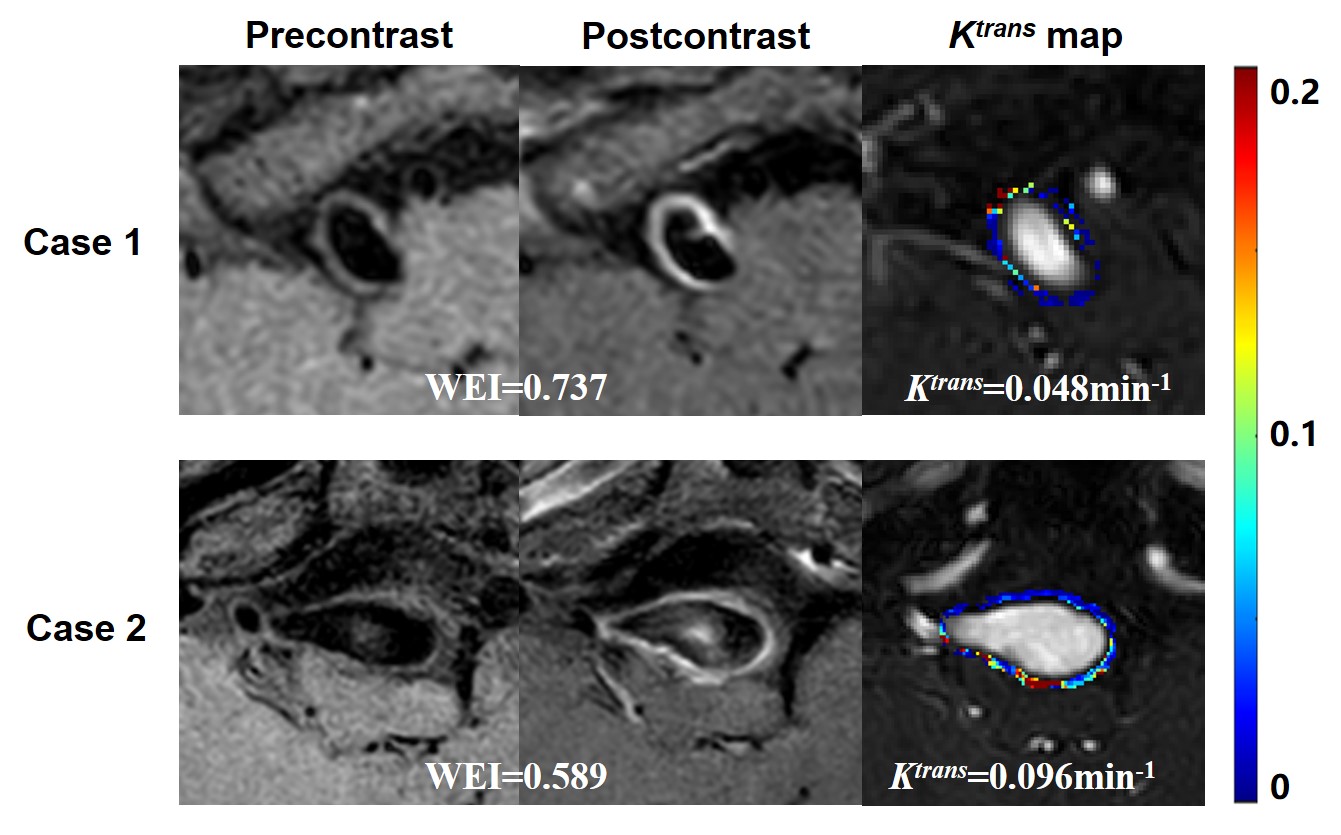
Figure 2. High enhancement of the non-saccular intracranial aneurysm wall with high or low Ktrans. Case 1: A 56-year-old female with 11.1 mm aneurysm. There is high aneurysm wall enhancement after injection of contrast, and DCE-MRI shows low aneurysm wall permeability. Case 2: A 56-year-old male with 22.0 mm aneurysm. Significant wall enhancement is observed, but DCE-MRI shows high aneurysm wall permeability. Case 1 also has smaller IA size and lower PHASES score than case 2.
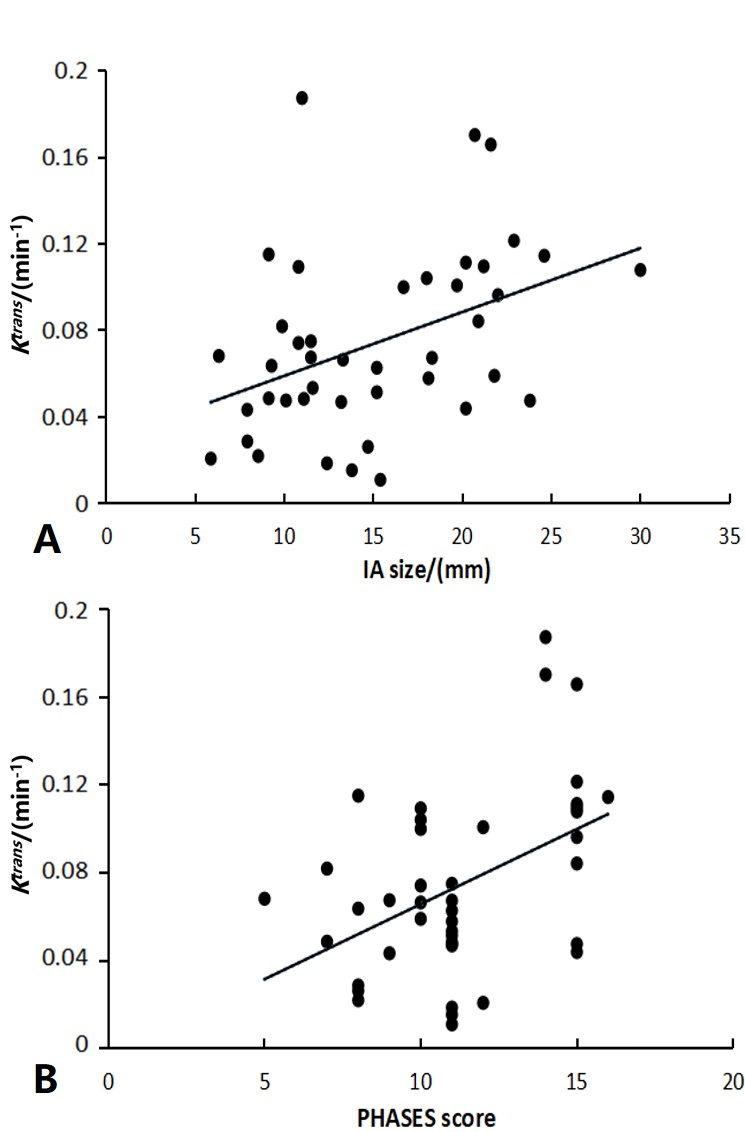
Figure 3. Correlation between non-saccular aneurysm wall permeability and IA size (A) and PHASES score (B). Spearman correlation analysis show that Ktrans correlates with IA size (ρ = 0.386, P = .012) and PHASES score (ρ = 0.323, P = .037).
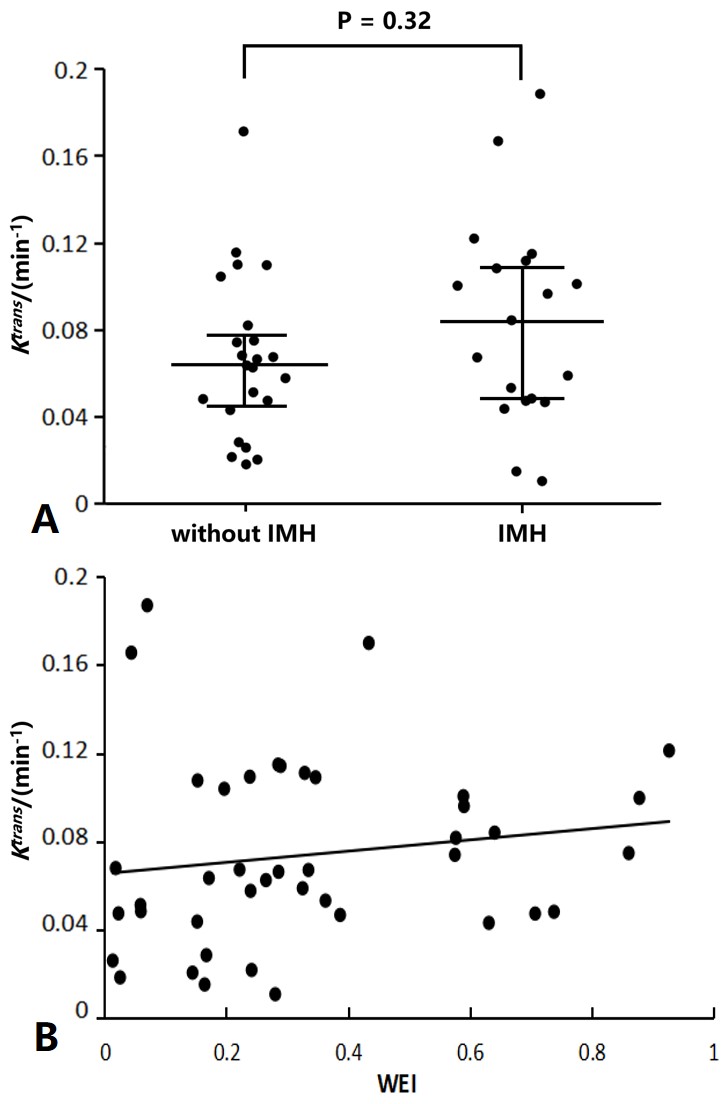
Figure 4. Associations between non-saccular aneurysm wall permeability and IMH (A) and WEI (B). Spearman analysis show that Ktrans has no significant correlation with IMH (P = .324) and WEI (P = .091).