1339
Feasibility of Detecting White Matter Perfusion using Arterial Spin Labeling in Patients with Sickle Cell Disease1Neurology, Vanderbilt University Medical Center, Nashville, TN, United States, 2Pediatrics, Vanderbilt University Medical Center, Nashville, TN, United States, 3Radiology, Vanderbilt University Medical Center, Nashville, TN, United States, 4Psychiatry, Vanderbilt University Medical Center, Nashville, TN, United States, 5Electrical and Computer Engineering, Vanderbilt University, Nashville, TN, United States
Synopsis
Keywords: Blood Vessels, Arterial spin labelling, Sickle Cell Disease, White Matter Perfusion
Motivation: Accurate white matter (WM) perfusion quantification is difficult but likely critical for assessing infarct risk in Sickle Cell Disease (SCD).
Goal(s): To evaluate the feasibility of detecting regional WM perfusion using arterial spin labeling (ASL) under conditions of high perfusion and reduced bolus arrival time (BAT) in SCD patients.
Approach: A multi-inversion time (TI; range=200-3200 ms), pulsed ASL sequence was applied to quantify perfusion detectability in SCD (n=35) and healthy (n=15) participants.
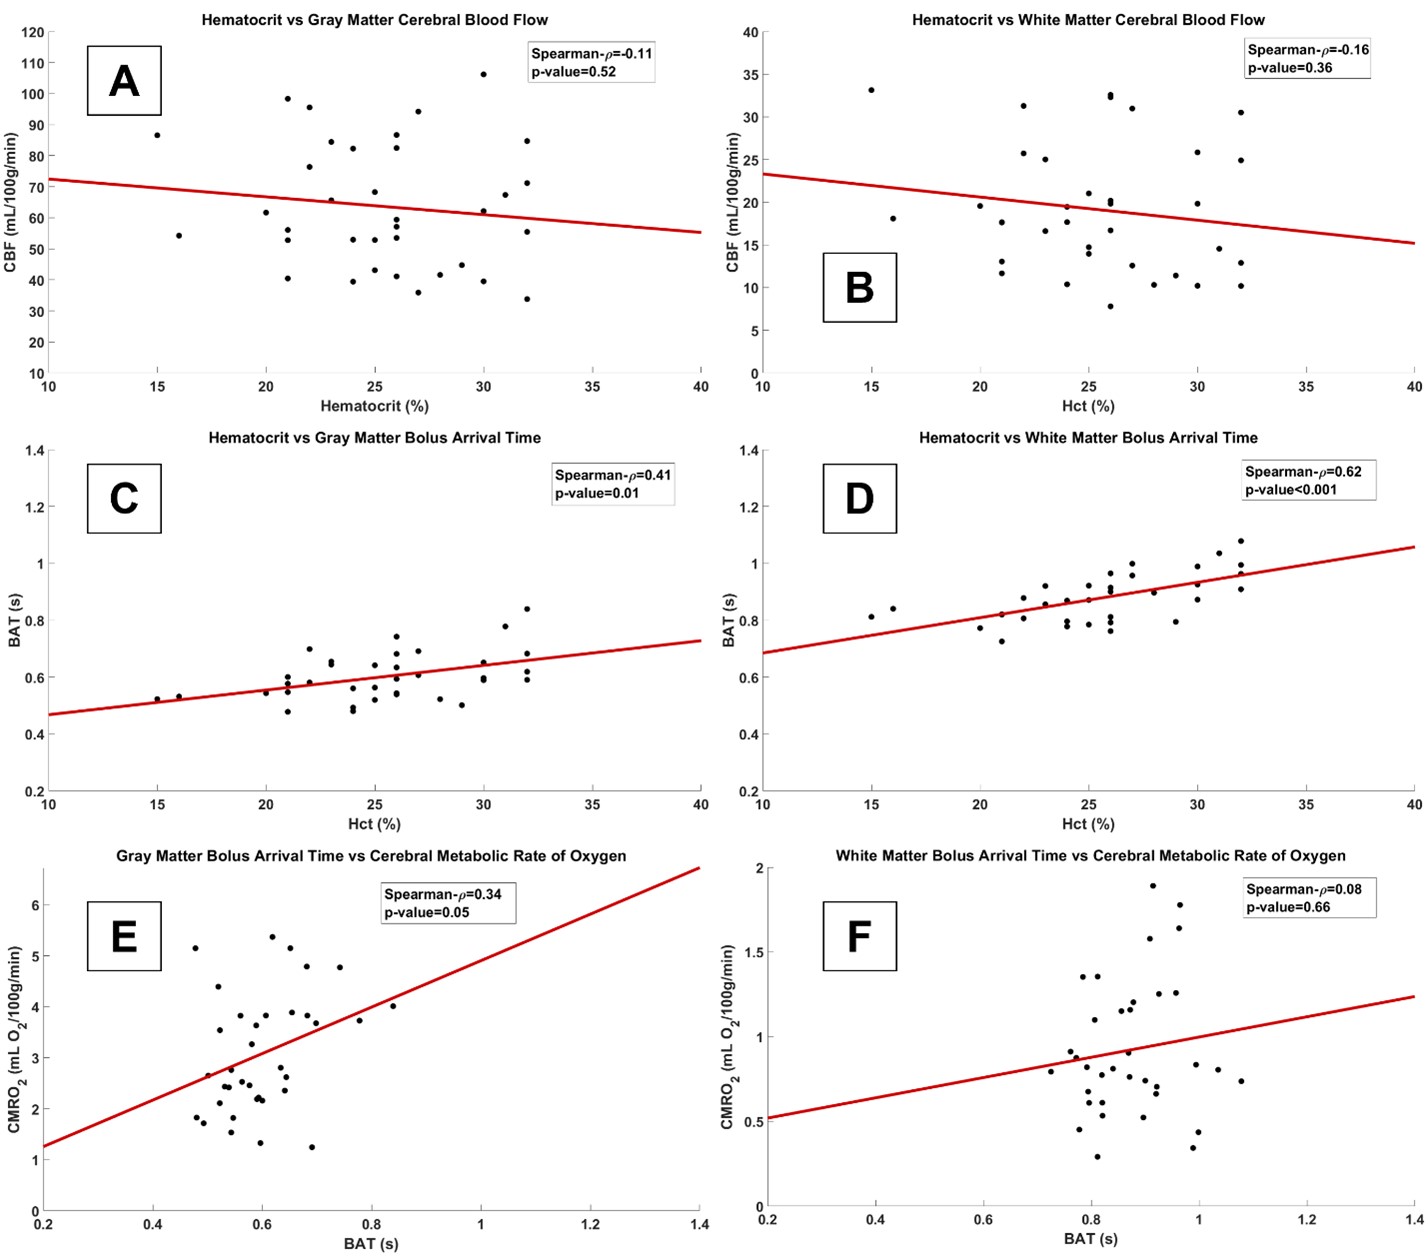
Results: WM perfusion was significantly detected for TI=800-1800 ms in SCD patients. BAT in SCD was more closely related to hematocrit (rho=0.43; p=0.01) than was WM perfusion (rho=-0.13; p=0.47).
Impact: We provide evidence in support of perfusion detection with ASL in SCD patients, which is attributable to higher perfusion and reduced BAT.
Introduction
The goals of this work are to: (1) revisit the possibility of quantifying white matter (WM) cerebral blood flow (CBF) with 3-Tesla arterial spin labeling (ASL) MRI, using recent sequence and hardware advances, over a range of inversion times (TIs) and (2) quantify CBF in healthy adults and adults with elevated CBF and reduced bolus arrival time (BAT) secondary to sickle cell disease (SCD). Despite the majority of silent and overt infarcts being localized to WM, ASL has been demonstrated to lack WM CBF sensitivity owing to lower WM CBF and longer WM BAT compared to blood-water T11,2. However, increased CBF and decreased BAT in SCD patients, and recent ASL advances, may enable WM CBF quantification3,4. We performed multi-delay Look-Locker ASL in healthy and SCD participants, quantified signal reliability over a range of CBF and BAT, and collected T2-Relaxation-Under-Spin-Tagging (TRUST) to estimate global oxygen extraction fraction (OEF) and further cerebral metabolic rate of oxygen (CMRO2). In an exploratory analysis, we tested the relationships between (i) CBF and hematocrit, (ii) BAT and hematocrit, and (iii) BAT and CMRO2.Methods
35 SCD (hemoglobin-SS) and 15 healthy age-matched (hemoglobin-AA) adults provided informed consent. Total hemoglobin and hemoglobin-S fraction were evaluated on the day of the scan in SCD patients. Participants were scanned at 3-Tesla using a novel pulsed ASL (PASL) sequence (repetitions=25; TIs=16; TI-range=200-3200ms; resolution=3x3x7mm; slices=9; acquisition time=6min56s) with Look-Locker readout and labeling 100 mm proximal to the imaging volume. We additionally collected a TRUST sequence for OEF quantification using a human hemoglobin calibration model.Using the CBF-weighted signal (ΔM/M0), we performed one-sample t-tests at each TI comparing the signal measured to null signal5 and used mean ΔM/M0 over time and FSL-BASIL to fit the three-stage kinetic model for CBF and BAT, accounting for hematocrit effect on arterial blood T16,7,8. CBF was quantified in total gray matter (GM) and WM; as well as anterior, middle, and anterior-middle cerebral artery border-zone WM territories9. CBF, OEF, arterial oxygen saturation and hemoglobin levels were then used in Fick’s Principle to estimate CMRO210.
Results
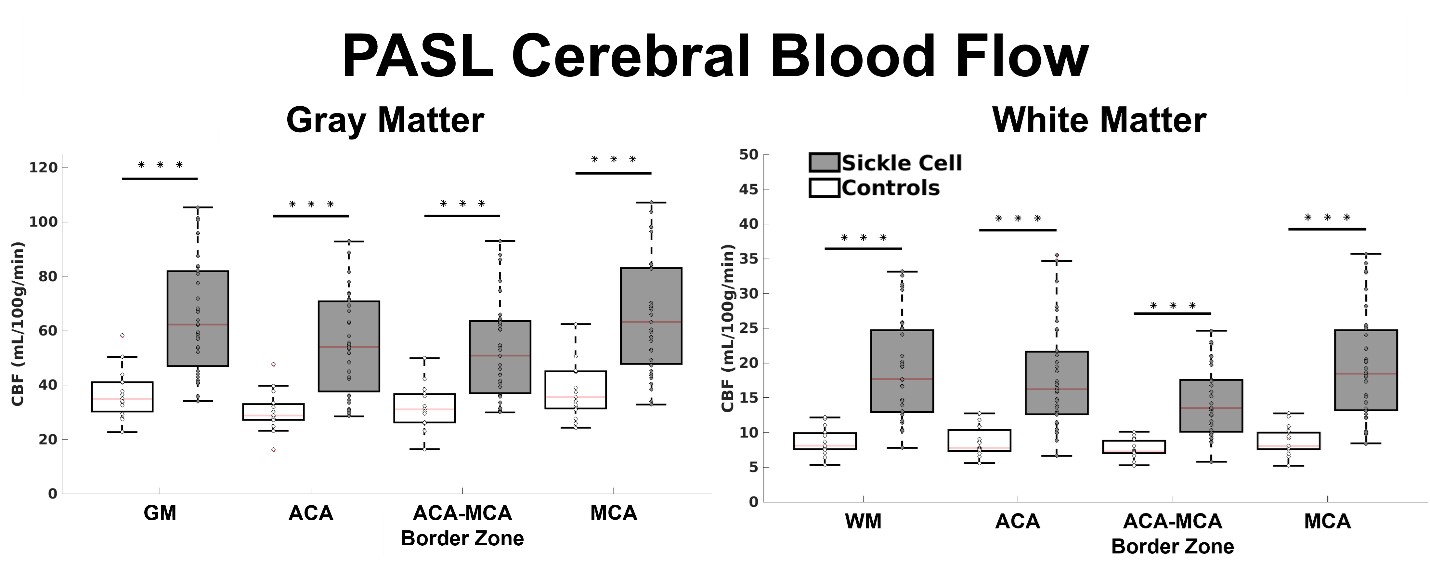
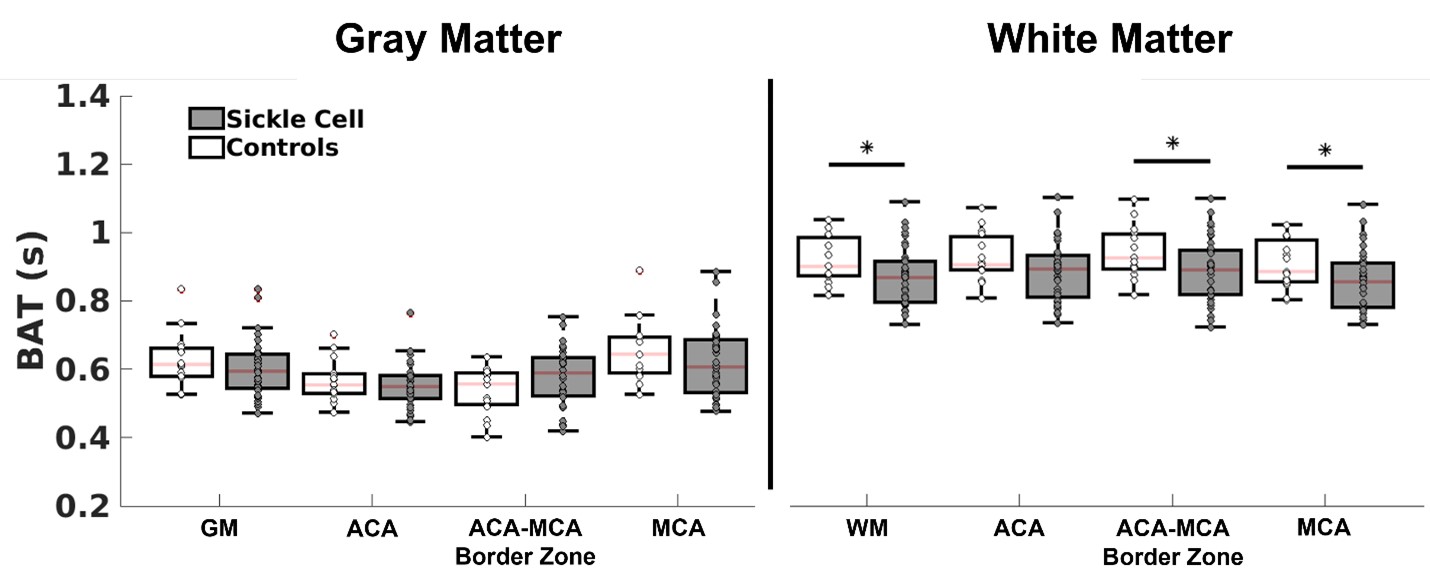
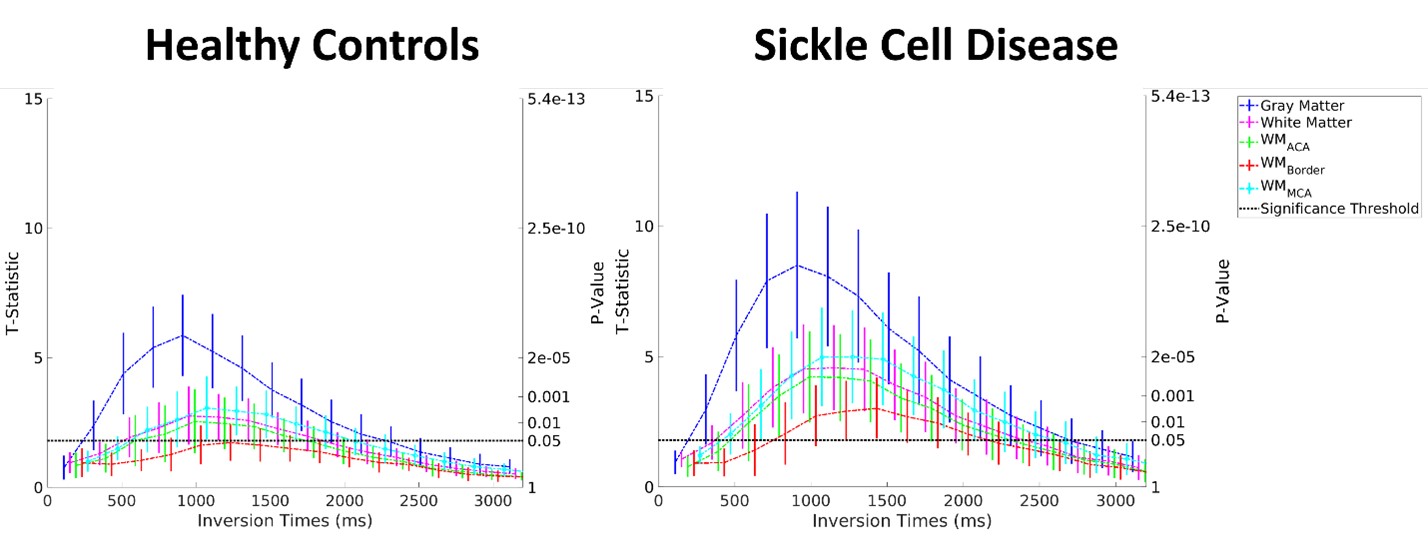
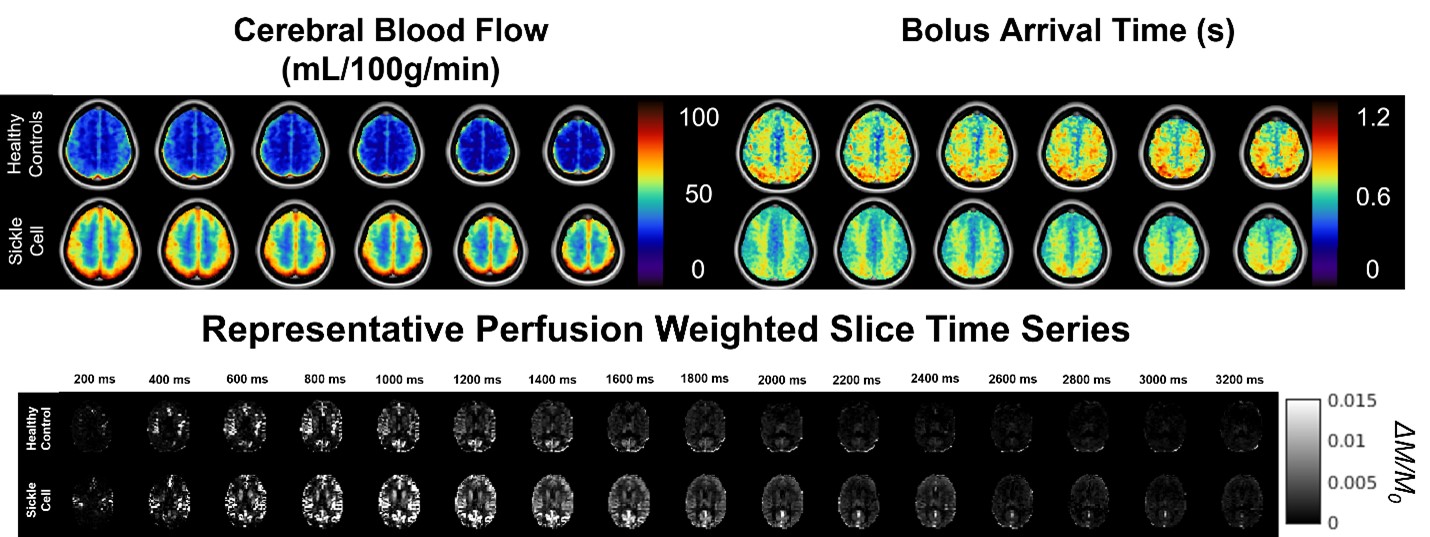
Signal was one standard deviation above significance criteria in the WM for each group (controls: TI=1400ms, SCD: TI=800-1800ms), peaking at TI=1200ms in SCD and TI=1400ms in controls (Figure 1). Border-zone ASL signal was detected at TI=1400ms in SCD, but was not detected in controls. SCD CBF was observed to be significantly higher across all regions relative to controls (SCD CBF: GM=63.7±20.1mL/100g/min and WM=19.2±7.5mL/100g/min; Control CBF: GM=36.3±9.3mL/100g/min and WM=8.7±2.0mL/100g/min), but only total WM BAT was reduced in SCD relative to healthy participants (Control BAT: GM=629±76ms and WM=923±65ms; SCD BAT: GM=601±84ms and WM=876±86ms) (Figures 2-3), indicating that low CBF, rather than prolonged BAT, may be most relevant to WM CBF detectability issues. WM CBF was not associated with hematocrit (Spearman-ρ=-0.20; p=0.26), but BAT was significantly associated with hematocrit (Spearman-ρ=0.55; p<0.001). Additionally, GM BAT was significantly associated with GM CMRO2 (Spearman-ρ=-0.34; p=0.049).Conclusions
We used a novel PASL sequence to demonstrate the feasibility of quantifying WM CBF in healthy and SCD participants and report that WM CBF quantification in major flow territories is more viable than previously appreciated even for healthy hemoglobin levels. Additionally, in exploratory analyses we found BAT to be related to hematocrit and CMRO2, confirming prior studies that blood flow kinetics are dependent on hematocrit; how such accelerated flow velocities influence oxygen extraction and consumption in the setting of SCD is a topic of ongoing investigation.Acknowledgements
No acknowledgement found.References
1. Ford AL, Ragan DK, Fellah S, et al. Silent infarcts in sickle cell disease occur in the border zone region and are associated with low cerebral blood flow. Blood 2018; 132: 1714–1723.
2. van Gelderen P, de Zwart J a., Duyn J h. Pittfalls of MRI measurement of white matter perfusion based on arterial spin labeling. Magnetic Resonance in Medicine 2008; 59: 788–795.
3. Bush A, Chai Y, Choi SY, et al. Pseudo Continuous Arterial Spin Labeling Quantification in Anemic Subjects with Hyperemic Cerebral Blood Flow. Magn Reson Imaging 2018; 47: 137–146.
4. Juttukonda MR, Jordan LC, Gindville MC, et al. Cerebral hemodynamics and pseudo-continuous arterial spin labeling considerations in adults with sickle cell anemia. NMR in Biomedicine 2017; 30: 1–9.
5. van Osch MJP, Teeuwisse WM, van Walderveen MAA, et al. Can arterial spin labeling detect white matter perfusion signal? Magnetic Resonance in Medicine 2009; 62: 165–173.
6. Buxton RB, Frank LR, Wong EC, et al. A general kinetic model for quantitative perfusion imaging with arterial spin labeling. Magnetic Resonance in Medicine 1998; 40: 383–396.
7. Chappell MA, MacIntosh BJ, Donahue MJ, et al. Separation of macrovascular signal in multi-inversion time arterial spin labelling MRI. Magnetic Resonance in Medicine 2010; 63: 1357–1365.
8. Lu H, Clingman C, Golay X, et al. Determining the longitudinal relaxation time (T1) of blood at 3.0 Tesla. Magnetic Resonance in Medicine 2004; 52: 679–682.
9. Liu C-F, Hsu J, Xu X, et al. Digital 3D Brain MRI Arterial Territories Atlas. Sci Data 2023; 10: 74.
10. Kety SS, Schmidt CF. The Effects of Altered Arterial Tensions of Carbon Dioxide and Oxygen on Cerebral Blood Flow and Cerebral Oxygen Consumption of Normal Young Men. J Clin Invest 1948; 27: 484–492.
Figures