1338
Automatic Segmentation of Large Blood Vasculature in DCE-MRI Data of Brain Tumor Using Different Clustering Algorithms1Centre for Biomedical Engineering, Indian Institute of Technology Delhi, New Delhi, India, 2Department of Radiology, Fortis Memorial Research Institute, Gurugram, India, 3Department of Biomedical Engineering, All India Institute of Medical Sciences, New Delhi, India, 4Yardi School of Artificial Intelligence, , Indian Institute of Technology Delhi, New Delhi, India
Synopsis
Keywords: Blood Vessels, Blood vessels, Clustering algorithms, Brain tumor
Motivation: The presence of normal large-blood-vessels(LBV) in tumor region can impact the evaluation of quantitative DCE-MRI parameters and tumor classification.
Goal(s): To develop an automated framework for segmenting LBVs present within or around the tumor region using different clustering algorithms and compare their accuracy in tumor grading.
Approach: LBV masks were generated using three different clustering algorithms on the DCE-MRI derived maps CBV and Slope-2. Generated tumor mask using AI tool on FLAIR images. Statistical analysis was performed.
Results: Overall, k-means clustering based algorithm provided superior performance in segmentation of LBV and tumor grading in less computational time.
Impact: The proposed automatic LBV segmentation algorithm can assist radiologists in objective and accurate assessment of tumor including tumor grading. This will reduce errors in tumor assessment.
Introduction
Quantitative DCE-MRI plays a crucial role in tumor detection and grading. Analysis of DCE-MRI provides various quantitative parameters, including piecewise-linear(PL) model parameters(alpha, beta, Slope-1 and Slope-2), first-pass analysis parameters(CBV, CBF), and generalized-tracer-kinetic model parameters(Ktrans, Vp, Ve). Generally, tumor tissue assesment is done by using quantitative parameters such as CBV, CBF and Vp but due to the present of large-blood-vessels(LBVs) inside or around the tumor lesion, they can potentially lead to incorrect tumor characterization or grading. Thus, in literature, various techniques have been used to exclude LBVs1–4 during tumor lesion analysis in CBV5,6, CBF1 and Slope-22 quantitative maps. Earlier, to overcome the limitations of single quantitative maps during LBV detection, we generated a combined map of CBV and Slope-2 maps to enhance the contrast between LBV and the other tissues7. However, still there is a need of automatic segmentation of LBVs without any human interventions. Thus, multiple clustering algorithms such as k-means7-9, Gaussian-mixture-model(GMM)10 and Fuzzy-C-means(FCM)11,12 clustering can be used for segmentation of LBV. Hence, the objective of current study was to compare three widely used clustering algorithms for automatic segmentation of LBVs and evaluate the influence of eliminating LBV on tumor grading.Materials and Methods
In this retrospective analysis, a total of 60 patients MRI data diagnosed with brain tumors were examined, consisting of 30 low-grade-gliomas(LGG) and 30 high-grade-gliomas(HGG)(subdivided as 20 Grade4 and 10 Grade3), classified according to WHO 202113 criteria. All MRI scans were performed using a 3T whole-body MRI system(Ingenia, Philips Healthcare, The Netherlands). The MRI protocol for this study included structural images(T1, T2, PD weighted), DCE-MRI(T1-Perfusion), and FLAIR images. An in-house developed DCE-MRI analysis tool and MATLAB 2021a were used in the processing of DCE-MRI data(TR/TE=6.3/3.1ms, FOV=230×230mm2, matrix=256×256, 20 slices with a thickness of 6mm, 32 dynamics at a 3.8s temporal resolution, contrast agent dose of 0.1mmol/kg body weight). DCE-MRI analysis encompassed data preprocessing, involving skull-stripping, registration, and noise-filtering along with generation of various parameters using multiple mathematical models.A proprietary developed AI tool14 was used for segmenting tumor lesions on FLAIR images. Later manual adjustments were made to the mask if needed. For automatic LBV segmentation, CBV and Slope-2 maps(CBV/Slope-2) were combined aiding the segmentation. Three clustering algorithms(k-means, GMM, FCM) with k=4 were tested to this combined map for the final LBV segmentation. Masks(tumor and vasculature) were verified by experienced Radiologist. Then, tumor mask and multiple LBV masks generated by different techniques were multiplied for analyzing tumor mask without LBV. For the entire dataset, statistical features, including mean and 95th percentile values were calculated for various quantitative parameters(CBV, CBF, Slope-2, Ktrans, Vp, Ve) both before and after the removal of blood-vessels. Lastly, statistical analysis such as t-test and ROC curve analysis was performed on these features to visualize the significant different between the two grades with and without LBV(Figure1).
Results
A comparative study was performed on various quantitative parameters differentiating brain tumor grades before and after LBV removal using multiple techniques. The mean Dice-Coefficients(DC) between k-means and GMM, GMM and FCM, and FCM and k-means were 0.77, 0.86, and 0.91, respectively. The average time required after implementing each technique on Windows10 system with 16GB RAM and Intel Xeon E3-1240 processor was approximately 1.2,1.9 and 2.6 seconds respectively. Figure2 illustrates a patient single slice LBV segmentation differently using three different techniques along with their computation time. Bar plot in Figure3 shows the reduction in quantitative parameter's 95th percentile and standard deviation values before and after removal of the LBVs both in HGG and LGG. Moreover, the t-test shows increment in significant difference and decline in p-values. However, as expected no such improvement in accuracy was seen on the Slope-2 parameter 95th percentile values after the LBV removal. Table1 highlights the growth in AUC values visualized after the ROC curve analysis (Figure4) of multiple quantitative parameters after the vasculature segmentation using different algorithms.Discussion
The study highlights that among the three clustering algorithms, k-means clustering performed most promising technique in segmenting the vasculature. Statistically significant difference(p-value<0.05) was seen for all the parameters except Slope-2 between with and without LBV. Contrasting other parameters, Slope-2 map displays tumor with high intensity while LBVs exhibits lower intensities. Thus, no significant difference was observed in the 95th percentile values of Slope-2 parameters after the LBV removal. K-means clustering did better segmentation in less computational time and produced higher significant difference in tumor grading compared to GMM and FCM.Conclusion
In the current study, the proposed automatic framework can effectively eliminates prominent blood vessels from quantitative DCE-MRI maps and enhances the accuracy of tumor classification.Acknowledgements
Authors acknowledge the funding support of SERB, DST(project number: CRG/2019/005032). Authors acknowledge data acquisition support of Mr. Rakesh Kumar Singh and Mr. Virendra Kumar Yadav for assistance in locating and generating tumor mask.References
1. Sengupta, A., Ramaniharan, A. K., Gupta, R. K., Agarwal, S. & Singh, A. Glioma grading using a machine-learning framework based on optimized features obtained from T1 perfusion MRI and volumes of tumor components. Journal of Magnetic Resonance Imaging 50, 1295–1306 (2019).
2. Jung, B. C. et al. Comparison of Glioblastomas and Brain Metastases using Dynamic Contrast-Enhanced Perfusion MRI. Journal of Neuroimaging 26, 240–246 (2016).
3. Li, X. et al. Glioma grading by microvascular permeability parameters derived from dynamic contrast-enhanced MRI and intratumoral susceptibility signal on susceptibility weighted imaging Head & neck imaging. Cancer Imaging 15, (2015).
4. Bhattacharjee, R. et al. Quantitative vs. semiquantitative assessment of intratumoral susceptibility signals in patients with different grades of glioma. Journal of Magnetic Resonance Imaging 51, 225–233 (2020).
5. Saini, J. et al. Comparative evaluation of cerebral gliomas using rCBV measurements during sequential acquisition of T1-perfusion and T2-perfusion MRI. PLoS One 14, (2019).
6. Law, M. et al. Comparison of Cerebral Blood Volume and Vascular Permeability from Dynamic Susceptibility Contrast-Enhanced Perfusion MR Imaging with Glioma Grade. AJNR Am J Neuroradiol 25,746–755 (2004).
7. Kesari, A. et al. Automatic Segmentation of Vasculature in DCE-MRI of Brain Tumors and its Influence in Grading. ISMRM 2023, Toronto. (Proc.Intl.Soc.Mag.Reson.Med. Abstract Number: 6538.)
8. Mohod, S. W., Kalpana Devidas, M. & Author-Dr Sudhir Mohod, C. W. K-Means Clustering And Two-Level Classification For Vessel Segmentation In Detection Of Diabetic Retinopathy. vol. 19 http://www.webology.orghttp://www.webology.org (2022).
9. Dhanachandra, N., Manglem, K. & Chanu, Y. J. Image Segmentation Using K -means Clustering Algorithm and Subtractive Clustering Algorithm. Procedia Comput Sci 54, 764–771 (2015).
10. Qiao, J. et al. Data on MRI brain lesion segmentation using K-means and Gaussian Mixture Model-Expectation Maximization. Data Brief 27, (2019).
11. Baid, U. & Talbar, S. Comparative Study of K-means, Gaussian Mixture Model, Fuzzy C-means algorithms for Brain Tumor Segmentation. vol. 137 (2017).
11. Ghosh, S. & Dubey, S. K. Comparative Analysis of K-Means and Fuzzy C-Means Algorithms. IJACSA) International Journal of Advanced Computer Science and Applications vol. 4 www.ijacsa.thesai.org (2013).
13. Louis, D. N. et al. The 2021 WHO classification of tumors of the central nervous system: A summary. Neuro Oncol 23, 1231–1251 (2021).
14. Maurya, S., Kumar Yadav, V., Agarwal, S. & Singh, A. Brain Tumor Segmentation in mpMRI Scans (BraTS-2021) Using Models Based on U-Net Architecture. Lecture Notes in Computer Science (including subseries Lecture Notes in Artificial Intelligence and Lecture Notes in Bioinformatics) 12963 LNCS, 312–323 (2022).
Figures
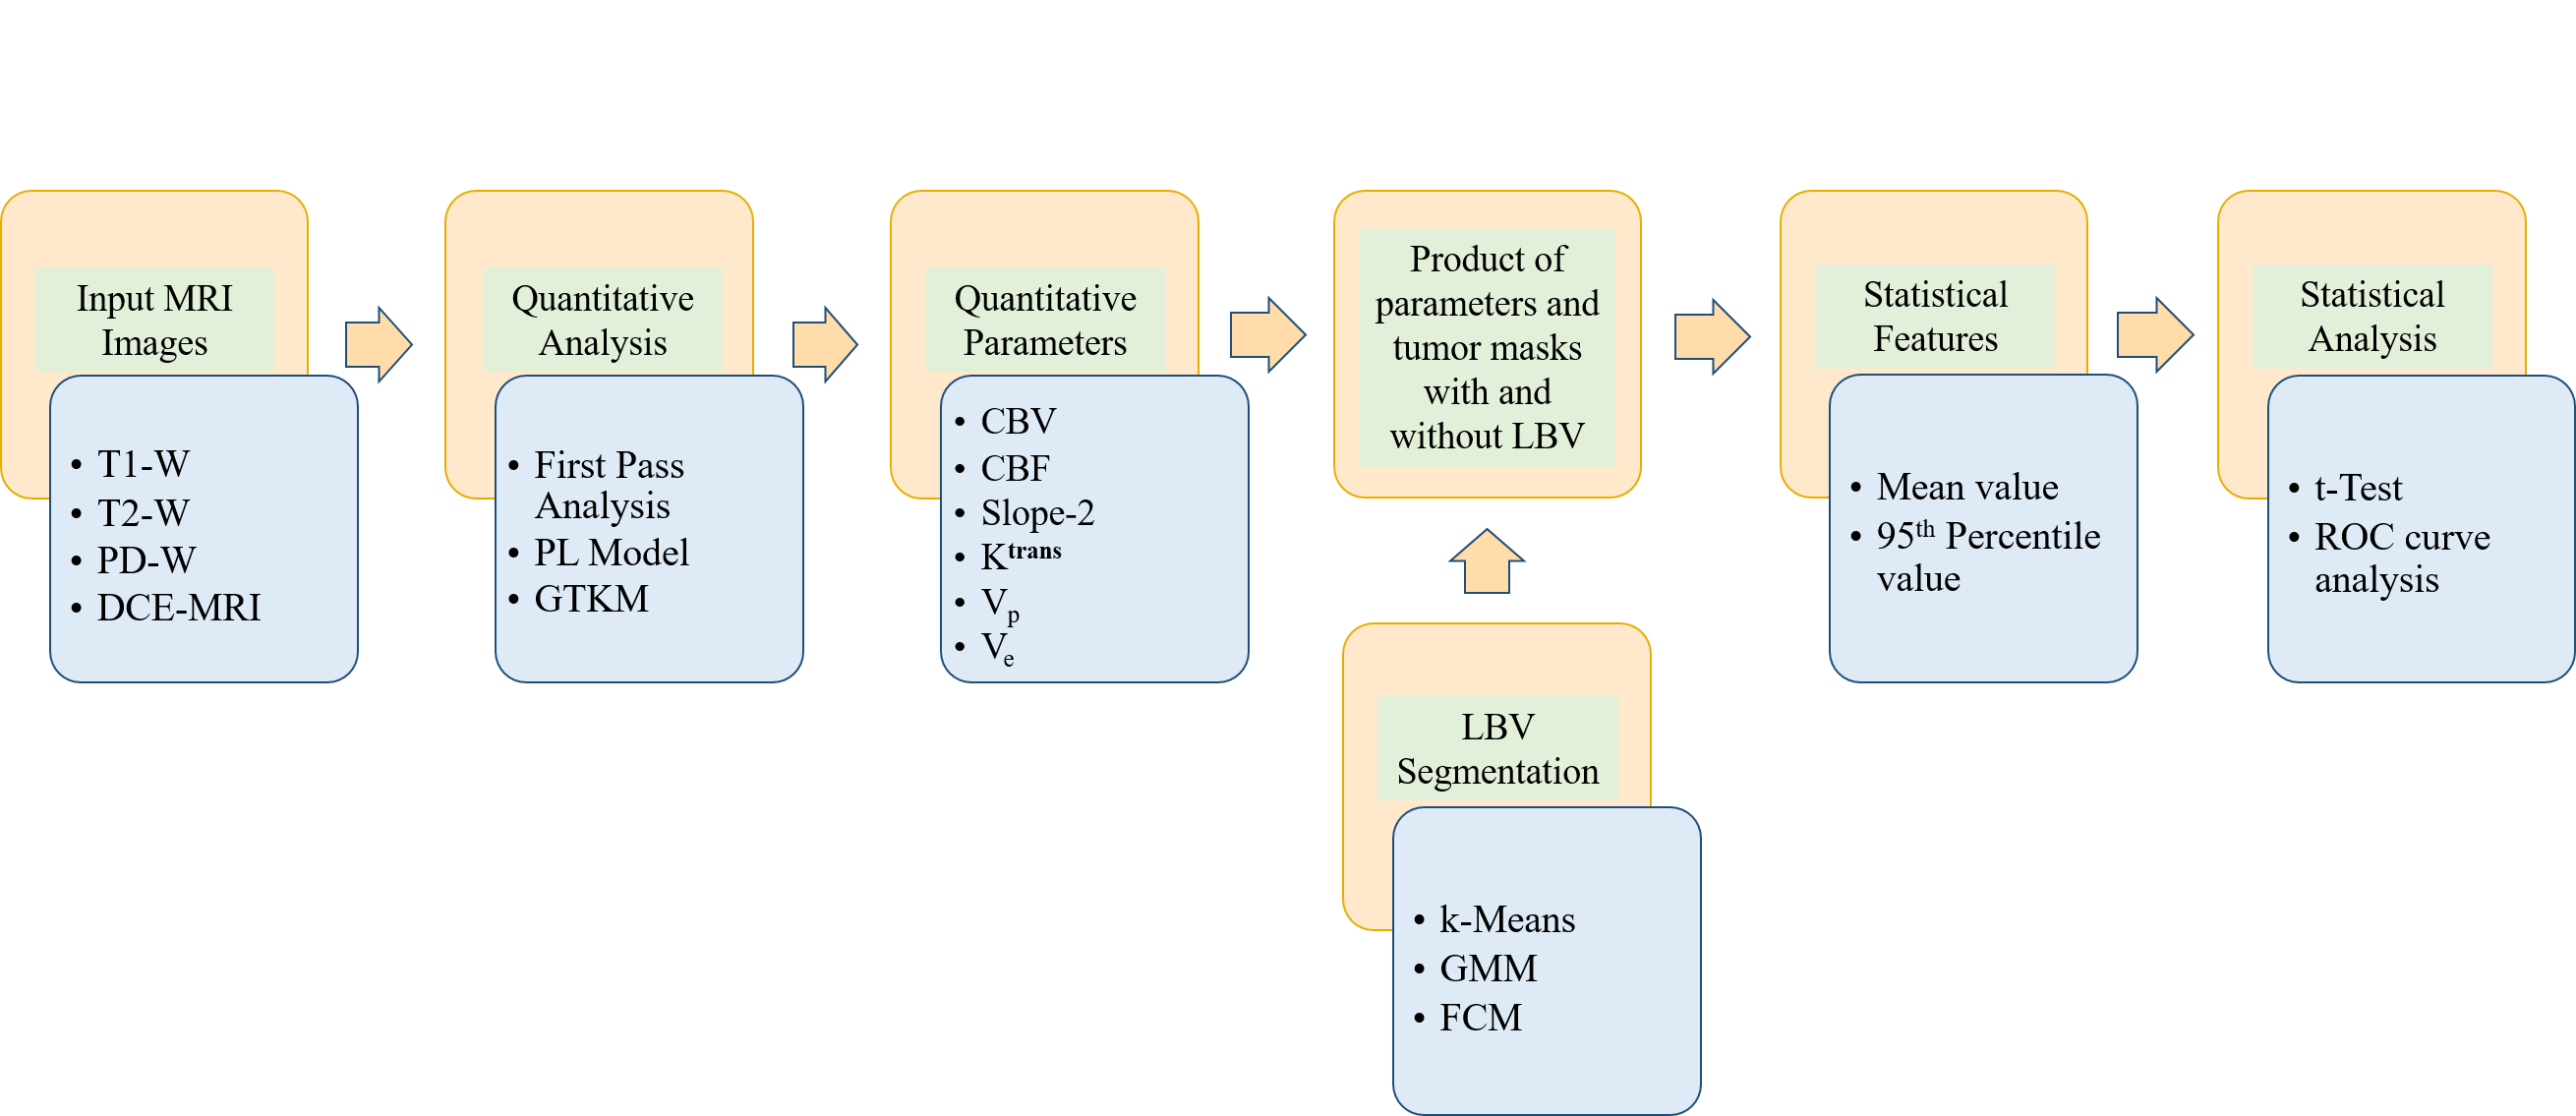
Figure1: Flow diagram of the methodology.
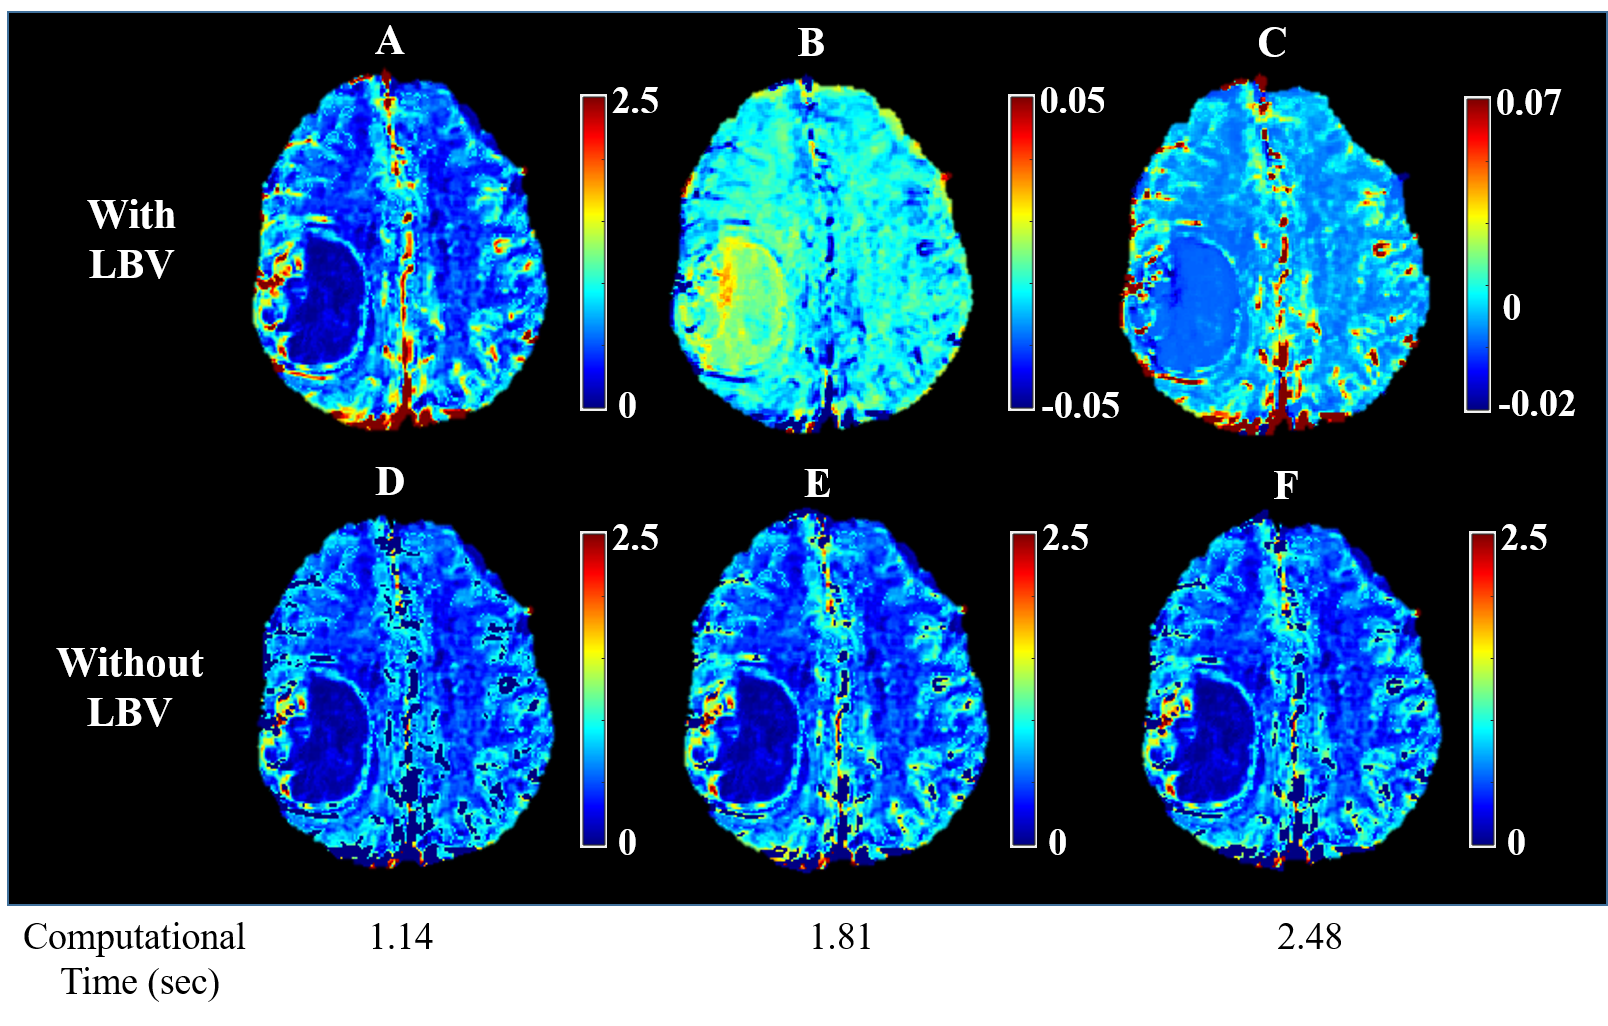
Figure2: (A) CBV map, (B) Slope-2 map, (C) Combined map, and (D,E,F) CBV maps after the removal of LBVs using k-means clustering, GMM and FCM along with their computational time respectively.
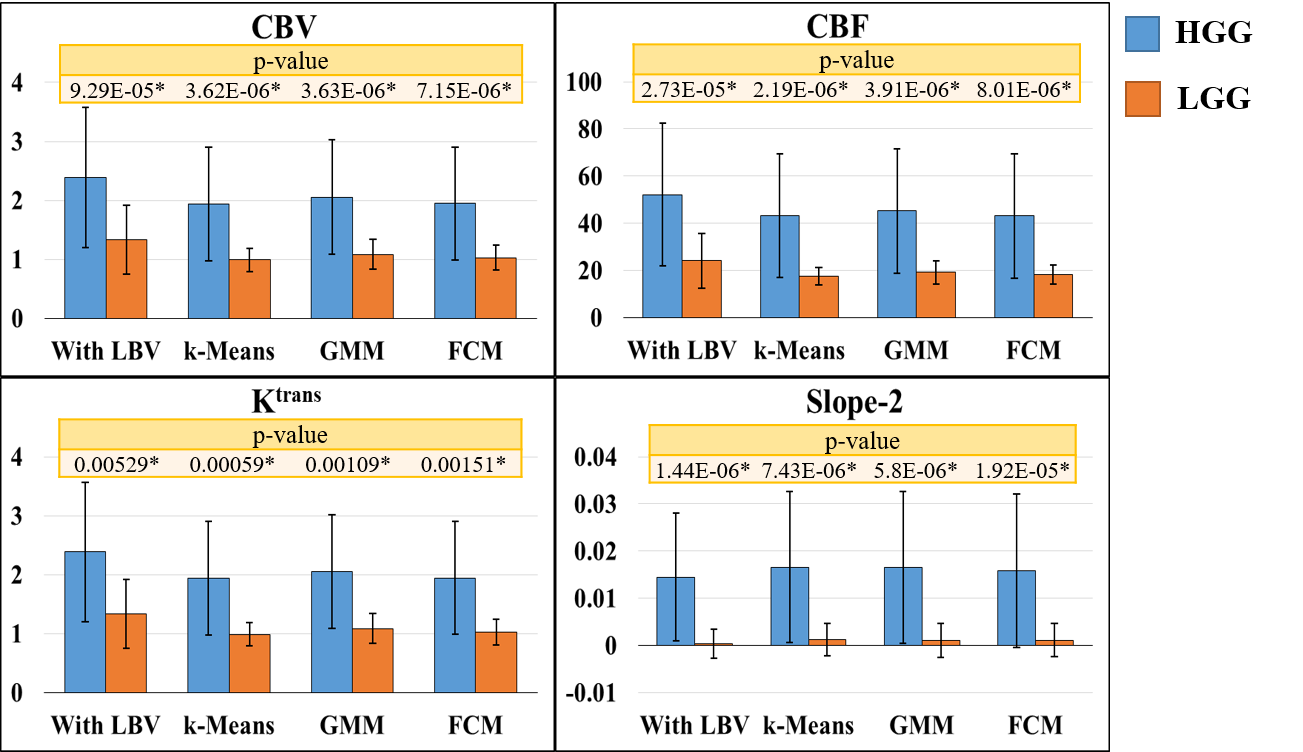
Figure3: Box plots depicting the variability in several quantitative parameters (95th percentile value) and their associated p-values of high-grade-glioma (HGG) and low-grade-glioma (LGG) with and without blood vessels (BV).
[ * represents statistically significant difference]
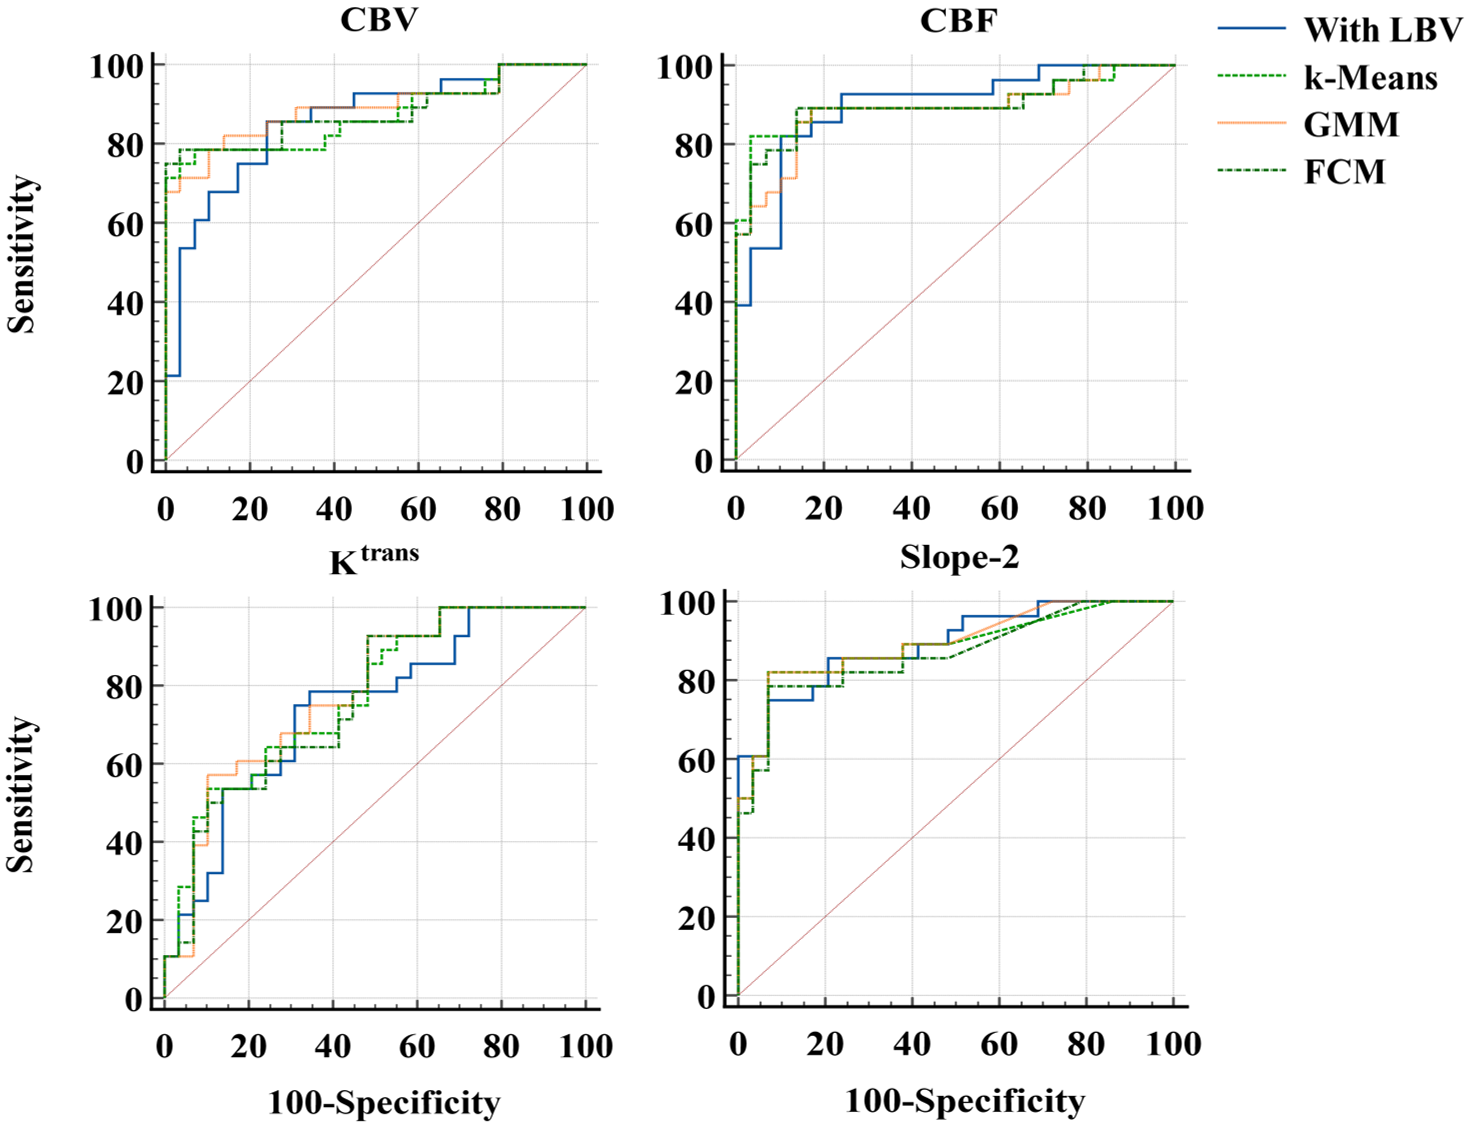
Figure4: ROC curve comparison of various quantitative parameters with and without LBV for differentiation between HGG vs LGG.

Table 1: Area Under the Curve(AUC) values from ROC analysis of various quantitative parameters differentiating between LGG vs HGG.