1335
Deep Learning-based Voxel-wise Estimation of Vessel Size Distribution from MR Gradient Echo Sampling of the Free Induction Decay and Spin Echo1Cancer Systems Imaging, The University of Texas MD Anderson Cancer Center, Houston, TX, United States, 2Alpert Medical School - Brown University, Providence, RI, United States, 3Department of Diagnostic Imaging, Rhode Island Hospital, Providence, RI, United States
Synopsis
Keywords: Blood Vessels, Blood vessels
Motivation: DSC-MRI is vital for diagnosing brain pathologies. Our goal is to harness GESFIDE MR signal evolution through deep learning (DL) to estimate vessel size distribution (VSD), which would allow us to explore deeper into the complexities of tumor vascular microstructure and other pathologies.
Goal(s): Our objective is to assess the capabilities of GESFIDE in providing voxel-wise VSD estimate.
Approach: We simulated GESFIDE signals with the FPFDM method. A DL network, VSD estimator (VSDE), was trained to estimate VSDs.
Results: Our validation demonstrates GESFIDE's promise in assessing VSD as a distinct contrast mechanism, offering insights into tumor microstructure and pathologies.
Impact: Our study reveals GESFIDE's potential for VSD estimation. Leveraging this unique contrast mechanism allows in-depth exploration of tumor microstructure and other pathologies through histogram analysis. Ongoing research aims to broaden VSD applicability and optimize GESFIDE parameters.
Introduction
Vessel size imaging relies on the biophysical relationship between contrast agent induced susceptibility variations and the architectural sensitivity of the induced changes in gradient-echo (GE) and spin echo (SE) transverse relaxation rates [1, 2]. More recently, a dictionary-based approach termed MR vascular fingerprinting was developed to provide estimates of cerebral blood volume, mean vessel radius and blood oxygen saturation [3]. The fingerprint is characterized by the ratio of MR signals, acquired using a gradient echo sampling of the free induction decay and spin echo (GESFIDE) sequence [4], collected pre- and post-injection of an iron-based contrast agent. Each voxel’s fingerprint is then fit to a dictionary of MR signal ratios derived from a computational model that simulates the magnetic fields associated with a physiologic range of vascular networks. In this computational investigation, we introduce a new approach termed deep MR Vascular Fingerprinting (deepMRvF) that integrates pre- and post-contrast GESFIDE signal ratios, computational modeling, 3D vascular networks derived from whole-brain light sheet microscopy, and deep learning-based analysis.Methods
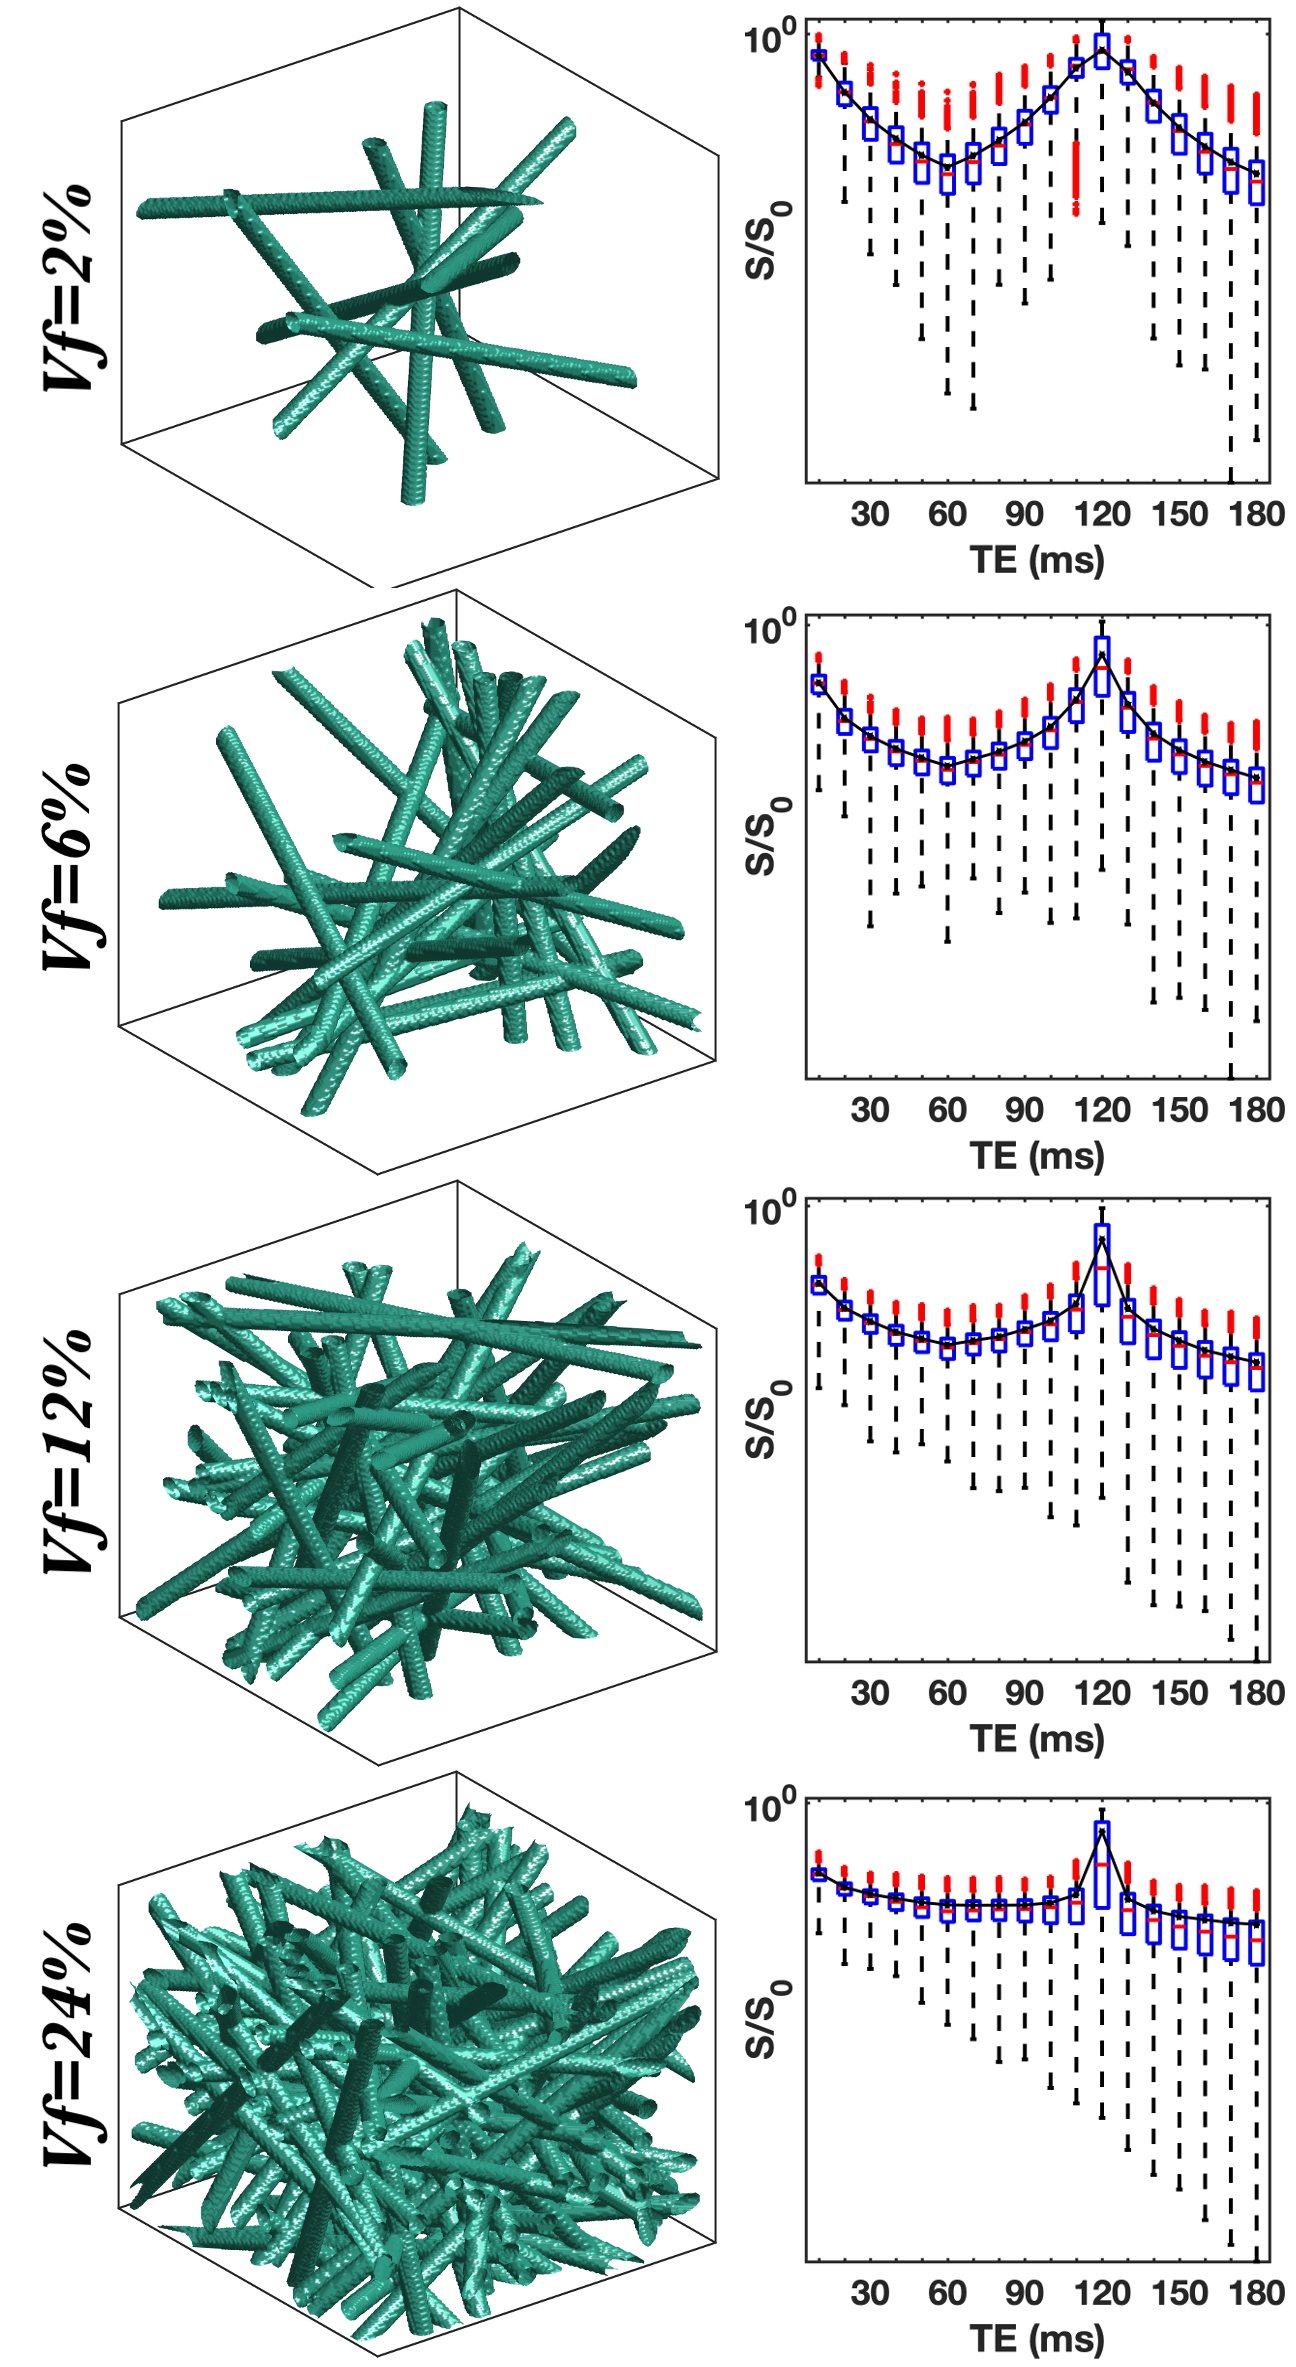
GESFIDE Signal SimulationIn this study, we utilized the Finite Perturber Finite Difference Method (FPFDM) to simulate the evolution of the MR signal obtained via the GESFIDE sequence in 3D tissue structures [5, 6]. The simulated GESFIDE training dataset consisted of 18 echo times ranging from 10 to 180ms and encompassed a wide spectrum of vascular properties, including variations in volume fraction (vf=[2 24]%), vascular radius (r=[1 40]µm), and orientational variability. Figure 1 displays an example of the training dataset, featuring a spectrum of GESFIDE signals for representative structures.
Vessel Size Distribution Estimator (VSDE)
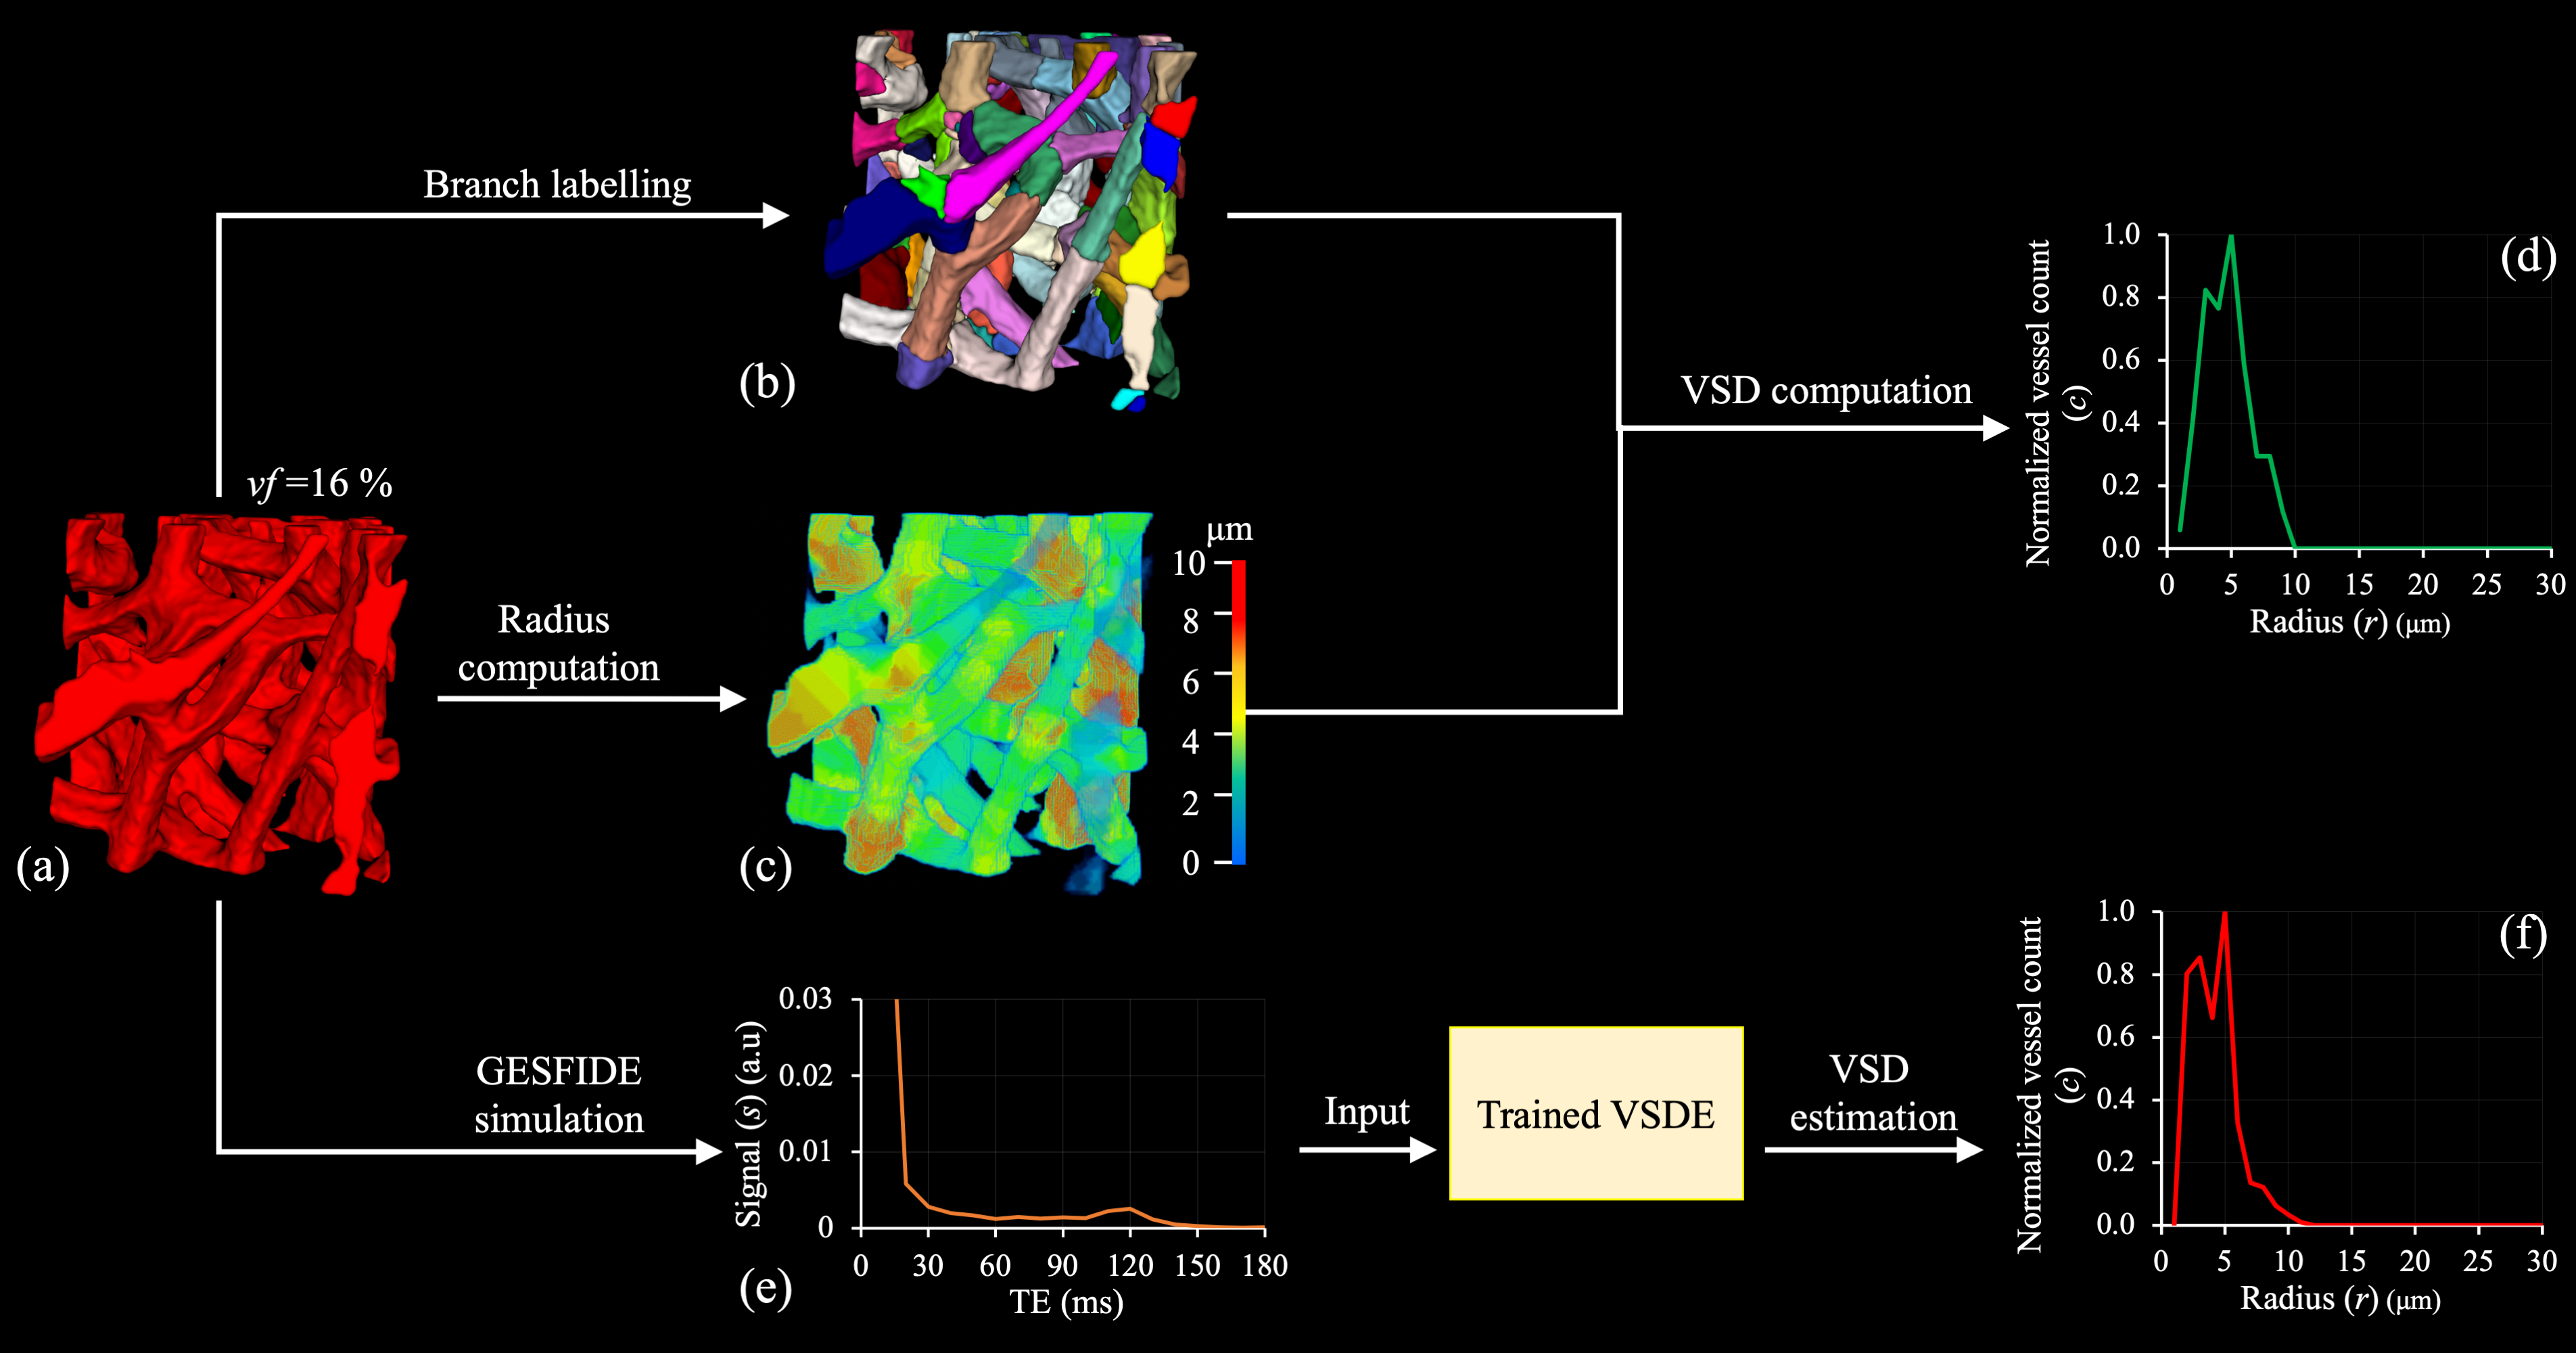
A fully connected DL network, VSDE, was trained using pairs of computer-generated VSD and simulated GESFIDE signal (Figure 2). The VSDE consists of an input layer with 19 nodes corresponding to the GESFIDE signal values (si| i=[1 18]) at 18 echo times and the vascular vf, 5 hidden layers (h) with 1024 (h1), 512 (h2), 128 (h3), 64 (h4), and 32 (h5) nodes, respectively, and an output layer with 40 nodes where node ‘i’ estimates the normalized count (ci’) of vessels with r=iµm. For a given tissue structure, vessel counts were normalized by dividing with the maximum vessel count and VSD was defined as the histogram of the normalized vessel counts (ci). Softplus activation was applied to all hidden layers except the first where ReLU was used, and sigmoid activation was applied in the output layer. In total, 20,000 pairs of VSD and GESFIDE signals were simulated and divided into training and validation dataset in 4:1 ratio. VSDE was trained to minimize the mean squared error loss between the reference (c) and estimated (c’) vessel counts using Adam optimizer [7] with learning rate of 10-4.
Ex vivo Validation
For ex vivo validation, 50 volumes of interest (VOI) were extracted from light-sheet microscopy image (1×1×3μm) of a mouse brain after tissue clearing and vascular staining [8]. Vessels were segmented from each VOI using Li’s thresholding algorithm [9] after contrast enhancement [10]. The reference VSD for a segmented structure was derived from its voxel-wise radius map and the GESFIDE signal was simulated, using FPFDM, for validation (Figure 3). Mean relative error (MRE) (%) was computed as the ratio of mean absolute error (MAE) between the reference and estimated VSDs and the maximum possible MAE w.r.t the reference VSD. Also, paired t-test (p-value) was conducted to assess the significance of difference between the reference and estimated mean radius.
Results
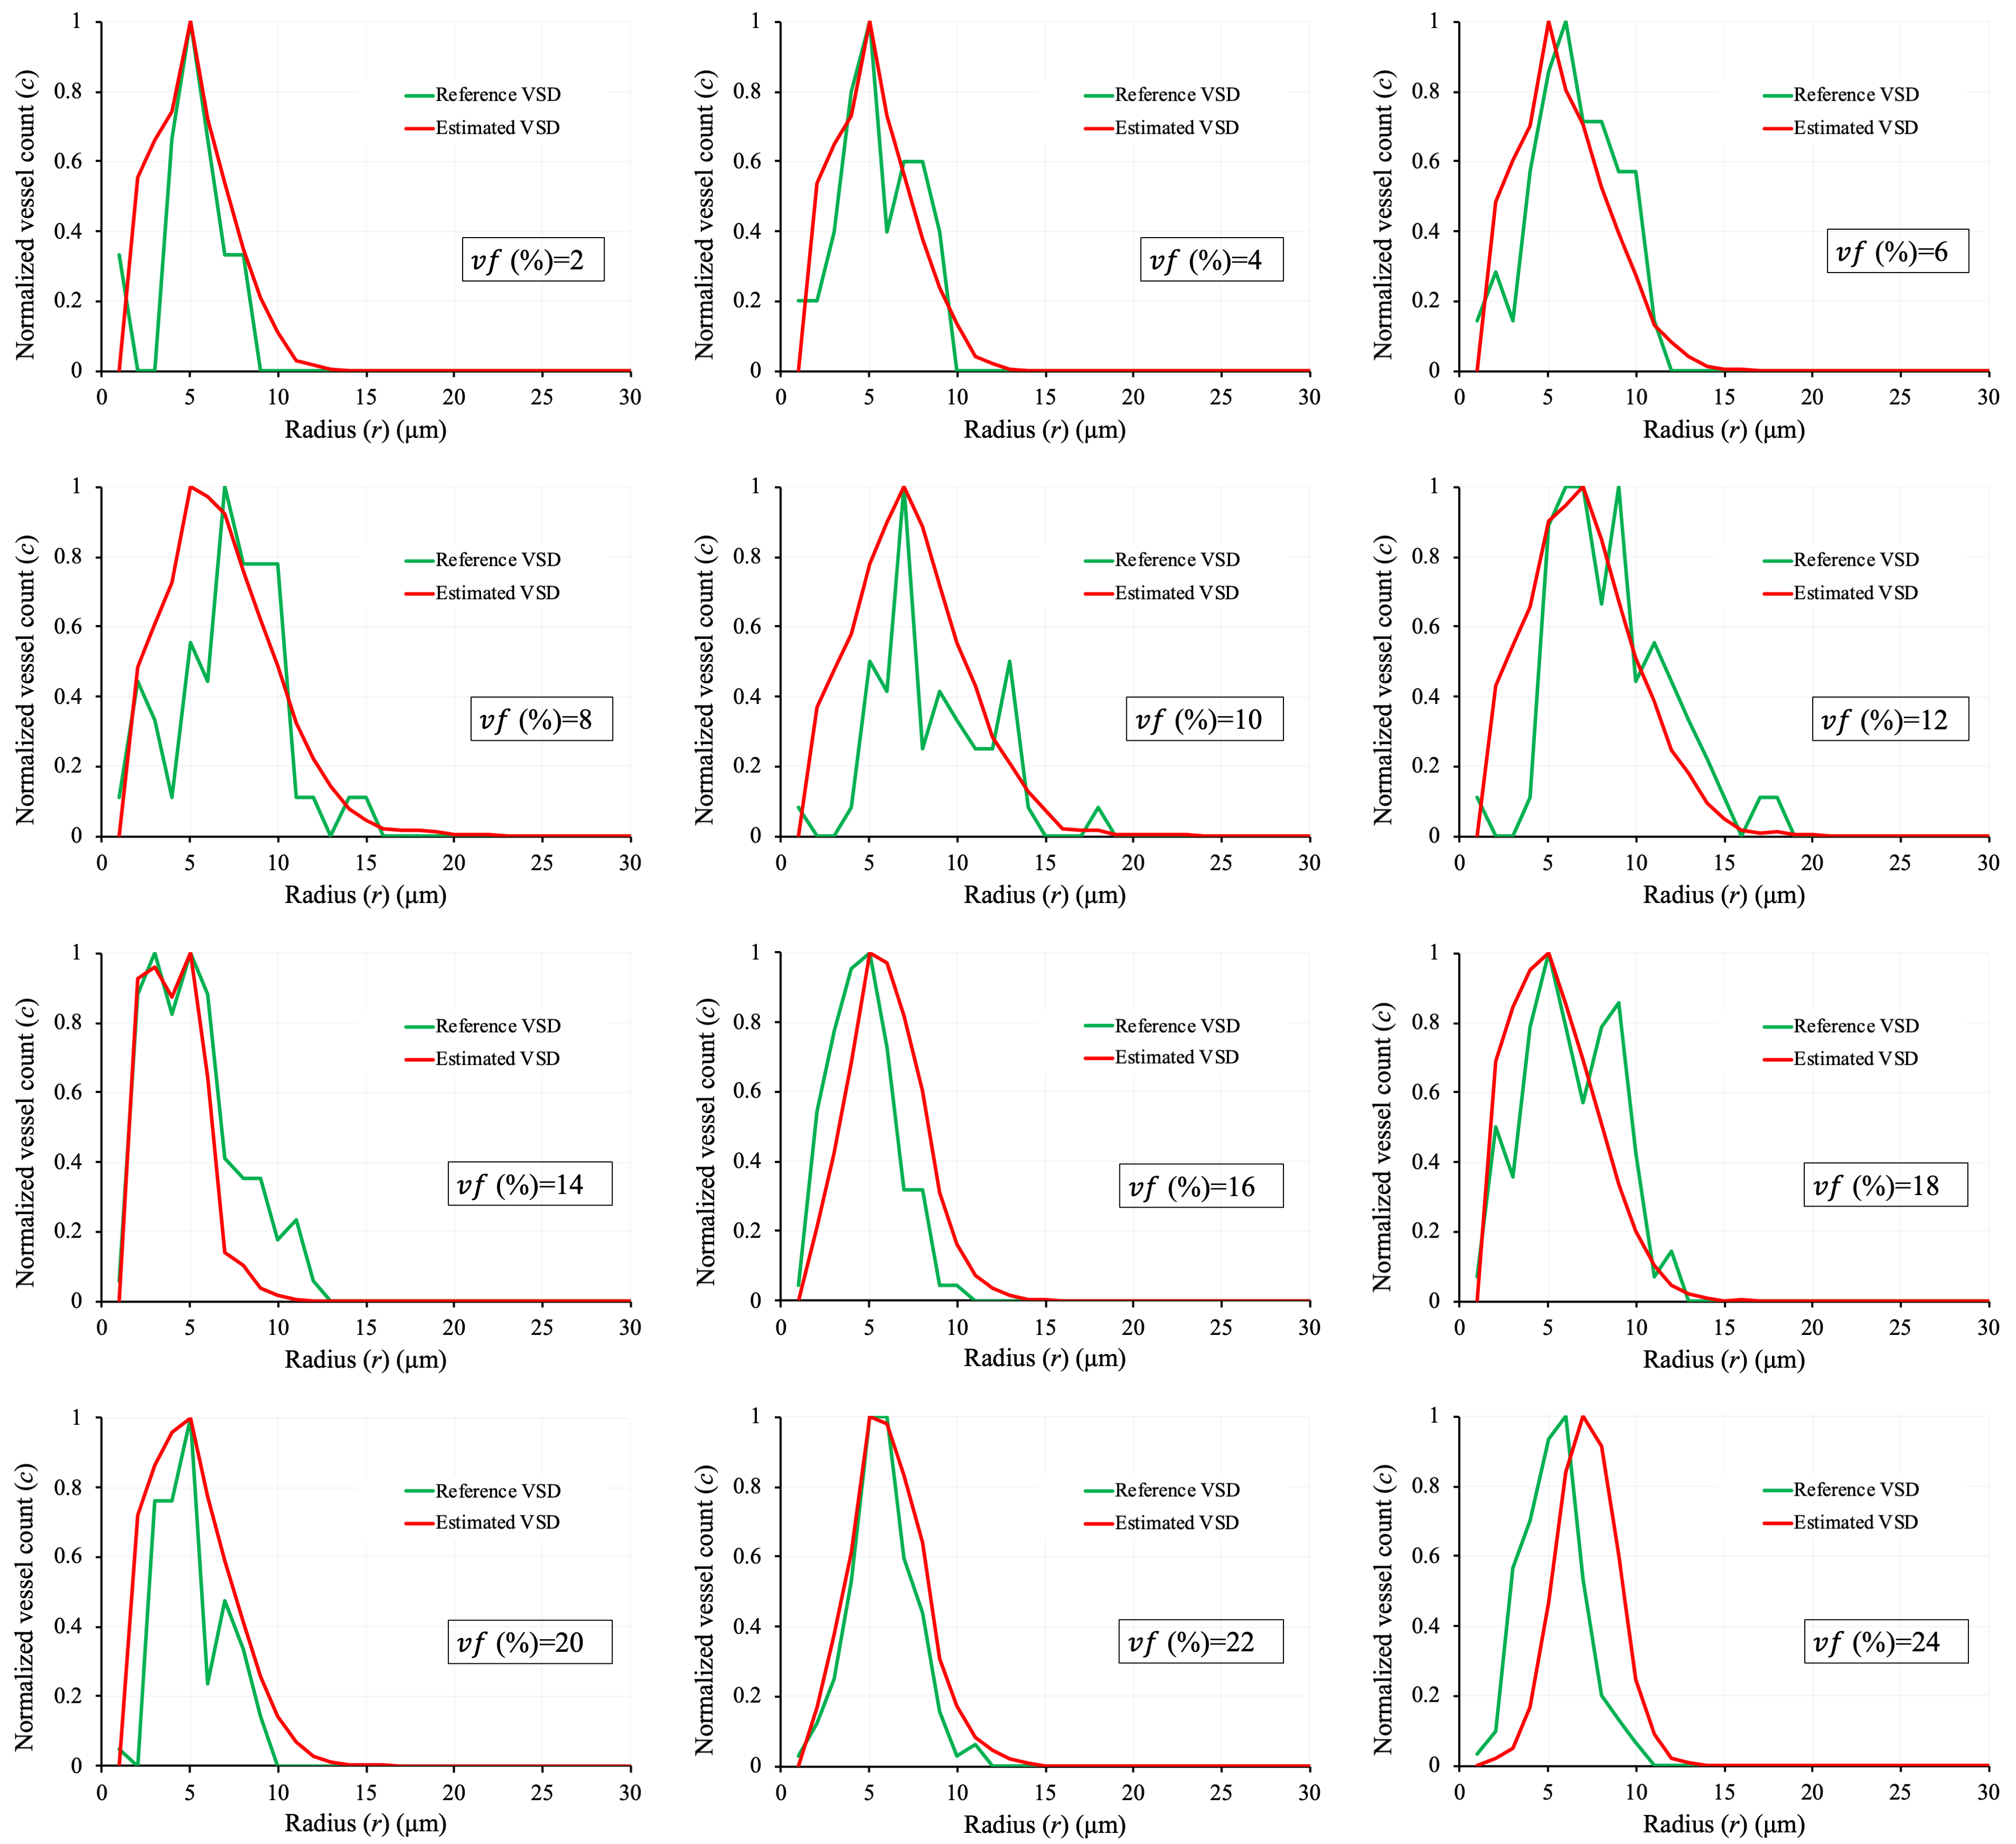
The mean±standard deviation (std) of vascular vf for the 50 ex vivo VOIs was 9.1±4.7%. The vf ranged from 2 to 24%. Figure 4 displays reference (green) and estimated (red) VSDs for 12 VOIs with vf varying from 2 to 24%. While the reference VSDs are noisy, there is noticeable overlap between the reference and estimated VSDs for all 12 VOIs. Mean±std of MRE between the reference and estimated VSDs (n=50) was 8.9±3.3%. Additionally, there was no significant difference (p-value>0.1) between the mean radius calculated from the reference (r=6.8μm) and estimated (r=6.4μm) VSDs for all 50 VOIs.Discussion and Conclusions
The result of this study unveils the exciting potential of GESFIDE in tandem with advanced DL techniques for the estimation of voxel-wise VSDs. By harnessing VSD as a distinctive vascular biomarker, our approach enables deeper exploration into healthy and pathologic vascular microstructures and their changes following therapeutic intervention. Expanding upon these encouraging discoveries, ongoing studies are being conducted to integrate a broader spectrum of VSDs, optimize GESFIDE parameters, and validate VSD with light-sheet microscopy in animals with a range of neurologic pathologies.Acknowledgements
This work was supported by funding from The Cancer Prevention and Research Institute of Texas (CPRIT) RR220038References
[1] I. Tropres, S. Grimault, A. Vaeth, E. Grillon, C. Julien, J. F. Payen, L. Lamalle, and M. Décorps, "Vessel size imaging," Magnetic Resonance in Medicine, vol. 45, pp. 397-408, 2001.
[2] C. Xu, W. U. Schmidt, K. Villringer, P. Brunecker, V. Kiselev, P. Gall, and J. B. Fiebach, "Vessel size imaging reveals pathological changes of microvessel density and size in acute ischemia," Journal of Cerebral Blood Flow & Metabolism, vol. 31, pp. 1687-1695, 2011.
[3] T. Christen, N.A. Pannetier, W.W. Ni, D. Qiu, M.E. Moseley, N. Schuff, G. Zaharchuk, "MR vascular fingerprinting: A new approach to compute cerebral blood volume, mean vessel radius, and oxygenation maps in the human brain", NeuroImage,Volume 89, pp. 262-270, 2014.
[4] J. Ma and F. W. Wehrli, "Method for image-based measurement of the reversible and irreversible contribution to the transverse-relaxation rate," Journal of Magnetic Resonance, vol. 111, pp. 61-69, 1996.
[5] N. B. Semmineh, L. C. Bell, A. M. Stokes, L. S. Hu, J. L. Boxerman, and C. C. Quarles, "Optimization of acquisition and analysis methods for clinical dynamic susceptibility contrast MRI using a population-based digital reference object," American Journal of Neuroradiology, vol. 39, pp. 1981-1988, 2018.
[6] N. B. Semmineh, J. Xu, J. L. Boxerman, G. W. Delaney, P. W. Cleary, J. C. Gore, and C. C. Quarles, "An efficient computational approach to characterize DSC-MRI signals arising from three-dimensional heterogeneous tissue structures," PloS One, vol. 9, p. e84764, 2014.
[7] D. P. Kingma and J. Ba, "Adam: A method for stochastic optimization," arXiv preprint arXiv:1412.6980, 2014.
[8] M. L. Scarpelli, D. R. Healey, S. Mehta, V. D. Kodibagkar, and C. C. Quarles, "A practical method for multimodal registration and assessment of whole-brain disease burden using PET, MRI, and optical imaging," Scientific Reports, vol. 10, p. 17324, 2020.
[9] C. H. Li and C. Lee, "Minimum cross entropy thresholding," Pattern Recognition, vol. 26, pp. 617-625, 1993.
[10] K. Zuiderveld, "Contrast limited adaptive histogram equalization," in Graphics gems IV, pp. 474-485, 1994.
[11] Y. Liu and P. K. Saha, "A new algorithm for trabecular bone thickness computation at low resolution achieved under in vivo condition," Proc of the IEEE International Symposium on Biomedical Imaging (ISBI): From Nano to Macro, San Francisco, CA, pp. 390-393, 2013.
Figures