1330
Concurrent ultra-high field fMRI and optical imaging of hemodynamic parameters and intracellular calcium1Magnetic Resonance Center, Max Planck Institute for Biological Cybernetics, Tübingen, Germany, 2Department for Neuroimaging, University of Tübingen, Tübingen, Germany
Synopsis
Keywords: Hybrid & Novel Systems Technology, Multimodal, Optical Imaging, Calcium
Motivation: BOLD fMRI is widely used as an indirect measure of neuronal activity. However, the spatial and temporal specificity of the BOLD signal is still under debate.
Goal(s): Being able to measure both hemodynamics and neuronal activity simultaneously with fMRI can help to improve interpretation of the BOLD signal.
Approach: A combined in-bore setup for concurrent intrinsic optical imaging, calcium imaging and ultra-high field fMRI in rats was designed.
Results: Measurements of BOLD, intrinsic hemodynamic and calcium signals with high temporal and spatial resolution reveal high correlation between these signals with specific characteristics regarding localization, vascularization and fMRI sequence.
Impact: A combined in-bore setup for concurrently recording calcium, intrinsic optical signals and fMRI was developed, which can be used to investigate spatial and temporal characteristics and correlations between brain activation, hemodynamic changes and BOLD signals.
Introduction
FMRI is based on local changes in blood oxygenation and blood volume, caused, through neurovascular coupling mechanisms, by neuronal activity 1,2. Nevertheless, the formation of BOLD signal and its specific information content and explanatory power is still not completely understood. Being able to observe the BOLD signal, blood oxygenation and volume and neuronal activation simultaneously and with independent methods can help investigating the formation of BOLD signal and refining its interpretation in neuroscience contexts.A widely used method to visualize neuronal activity is calcium imaging with genetically encoded calcium sensors 3, which can be combined with intrinsic optical imaging (IOI) 4, a well-established method for observing blood oxy- and deoxygenation with high temporal and spatial resolution 5,6.
We have expanded our setup for concurrent IOI and fMRI 7 to include Calcium imaging based on a genetically encoded GCaMP vector and used the additional information on the spatial distribution of the activation to investigate the spatial specificity of the different hemodynamic parameters and of different fMRI techniques at ultra-high field.
Methods
Three weeks old rats were injected with AAV5-GCaMP6f at five to seven injection points to cover the forepaw region of the somatosensory cortex. After an expression time of four to seven weeks, the rats’ skull was thinned to translucency to allow observation of brain surface vessels and upper cortical layer while maintaining the physiological milieu. Rats were kept under urethane anesthesia and placed into the fully integrated in-bore system based on a magnetic field proof CMOS-camera and a tandem lens system. Light from LEDs of four different wavelengths (530 nm, 550 nm, 630 nm for IOI, 492 nm for Ca2+/GCaMP) was transmitted into the magnet by optical fibers to alternately illuminate the brain surface. A bandpass filter in the illumination path and a longpass filter in front of the camera allowed to observe the Ca2+-fluorescence signals without blocking the three IOI-wavelengths. The optical imaging setup (Fig. 1) was placed inside a 14.1 T small animal MR scanner. A small NMR surface coil just above the somatosensory cortex was used for anatomical and functional imaging. Neuronal activity of the somatosensory cortex was evoked by electrical forepaw stimulation with varying parameters. Optical imaging data was recorded with 16 fps resulting in an effective TR of 250 ms. Oxy- and deoxyhemoglobin concentration changes were calculated using the differential pathlength approach 8. Background illumination and crosstalk from intrinsic hemodynamic changes were considered when analyzing calcium concentration changes. FMRI data was acquired simultaneously with four different techniques (FOV 20×20 mm2, 80×80 or 64×64 voxels, 1-4 slices à 500 µm parallel to brain surface, TR 250 ms (GE-EPI and SSFP) or 500 ms (SE-EPI and DWI)) and analyzed with SPM12. OI and MRI images were superimposed based on anatomical structures.Results
GCaMP is expressed almost uniformly and covers the entire forepaw region (Fig. 1). Venous and arterial structures can be identified in optical and anatomical MR images and used to superimpose both images (Fig. 2). Neuronal activity as indicated by calcium signal and hemodynamic activity seen as changes in oxy- and deoxyhemoglobin concentrations measured with intrinsic optical imaging colocalize very well (Fig. 3, 4). Strong overlap between BOLD signals and activated regions determined by SPM and neuronal calcium activity can be observed as well with differences in spatial distributions depending on MR sequence and cortical depth, demonstrating the differences in the spatial specificity of the techniques (Fig. 4). Time courses of all five modalities (calcium, oxyhemoglobin, deoxyhemoglobin, blood volume and BOLD) from different anatomical compartments (veins, arteries, tissue containing capillaries) are shown in Fig. 5.Discussion
Extending and adapting our technique for concurrently measuring fMRI and IOI by adding the recording of calcium signals introduces a new dimension to our studies with the possibility to observe a ground truth for neuronal activation and brain activity.Imaging with high and comparable temporal and spatial resolution in all modalities allows us to investigate small variations in signals acquired with different methods and of different origin. Analyzing signals from different vessels and anatomical compartments can contribute to the investigation of the formation of the BOLD effect. Acquiring with different MR sequences under comparable conditions and correlating them to concurrently recorded calcium and IOI data can show differences in information content regarding neuronal activation and specificity to certain hemodynamic components and processes.
Conclusion
Multimodal imaging techniques are a key point in investigating neural and hemodynamic processes during neuroactivation. The presented tri-modal approach can contribute to improving our understanding of the formation of BOLD signal, its information content and explanatory power regarding brain activity.Acknowledgements
No acknowledgement found.References
1. Attwell D. and Iadecola C. The neural basis of functional brain imaging signals. Trends Neurosci. 2002; 25(12):621-5.
2. Berwick J, Johnston D, Jones M, Martindale J, Martin C, Kennerley AJ, Redgrave P, Mayhew JE. Fine detail of neurovascular coupling revealed by spatiotemporal analysis of the hemodynamic response to single whisker stimulation in rat barrel cortex. J Neurophysiol. 2008; 99(2):787-798.
3. Liang Z, Ma Y, Watson GDR, Zhang N. Simultaneous GCaMP6-based fiber photometry and fMRI in rats. J Neurosci Methods. 2017; 289:31-38.
4. Gu X, Chen W, You J, Koretsky AP, Volkow ND, Pan Y, Du C. Long-term optical imaging of neurovascular coupling in mouse cortex using GCaMP6f and intrinsic hemodynamic signals. Neuroimage. 2018;165:251-264.
5. Vanzetta I. Hemodynamic responses in cortex investigated with optical imaging methods. Implications for functional brain mapping. Journal of Physiology-Paris. 2006; 100(4):201-211.
6. Kennerley AJ, Berwick J, Martindale J, Johnston D, Papadakis N, Mayhew JE. Concurrent fMRI and optical measures for the investigation of the hemodynamic response function. Magn Reson Med. 2005; 54(2):354-365.
7. Bernard R, Valverde Salzmann M, Scheffler K, Pohmann R. Concurrent intrinsic optical imaging and fMRI at ultra-high field using magnetic field proof optical components. NMR Biomed. 2023;36(7):e4909.
8. Ma Y, Shaik MA, Kim SH, Kozberg MG, Thibodeaux DN, Zhao HT, Yu H, Hillman EM. Wide-field optical mapping of neural activity and brain haemodynamics: considerations and novel approaches. Philos Trans R Soc Lond B Biol Sci. 2016;371(1705):20150360. Erratum in: Philos Trans R Soc Lond B Biol Sci. 2017;372(1714).
Figures
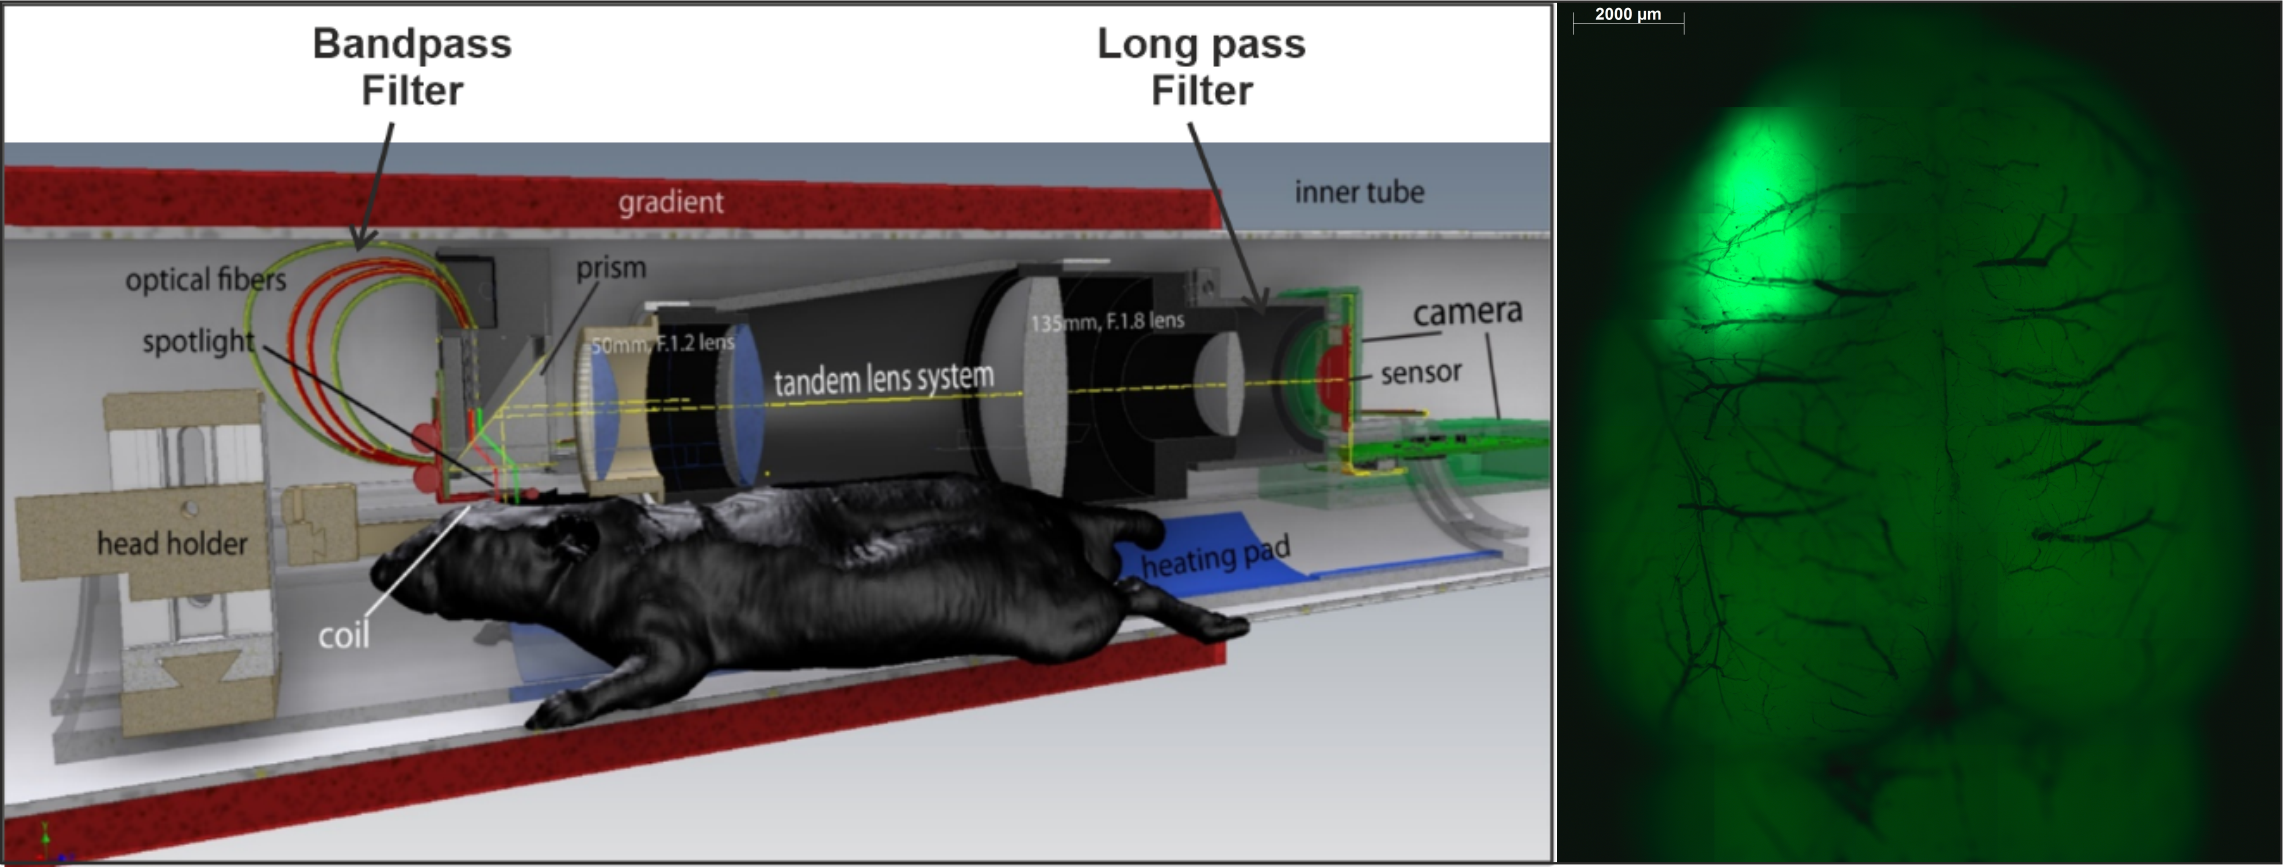
Figure 1: Left: Combined imaging setup: magnetic field proof camera with tandem lens system and optical fibers transmitting light of four alternating wavelengths. A combination of a bandpass filter in the illumination light path and a longpass filter in front of the camera allows fluorescence imaging of intracellular calcium. The whole camera setup is placed inside a 14.1 T MR scanner with 12 cm bore size.
Right: Ex-vivo fluorescence microscopy of the brain shows a relatively homogeneous GCaMP-expression throughout the somatosensory cortex.
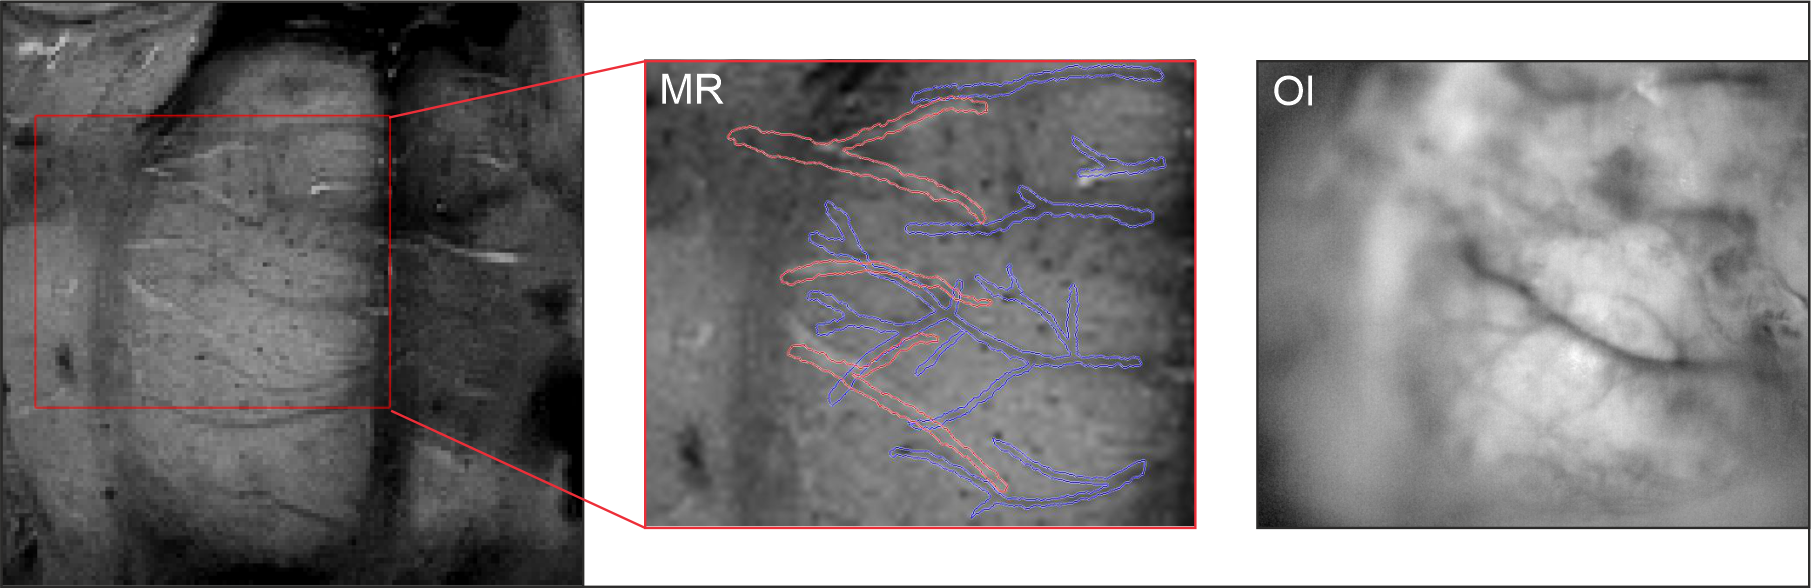
Figure 2: MR image (left) with merged vein and artery contrast; corresponding OI FOV is indicated by red rectangle and shown in the middle with overlaid vessels determined from the OI image shown on the right.
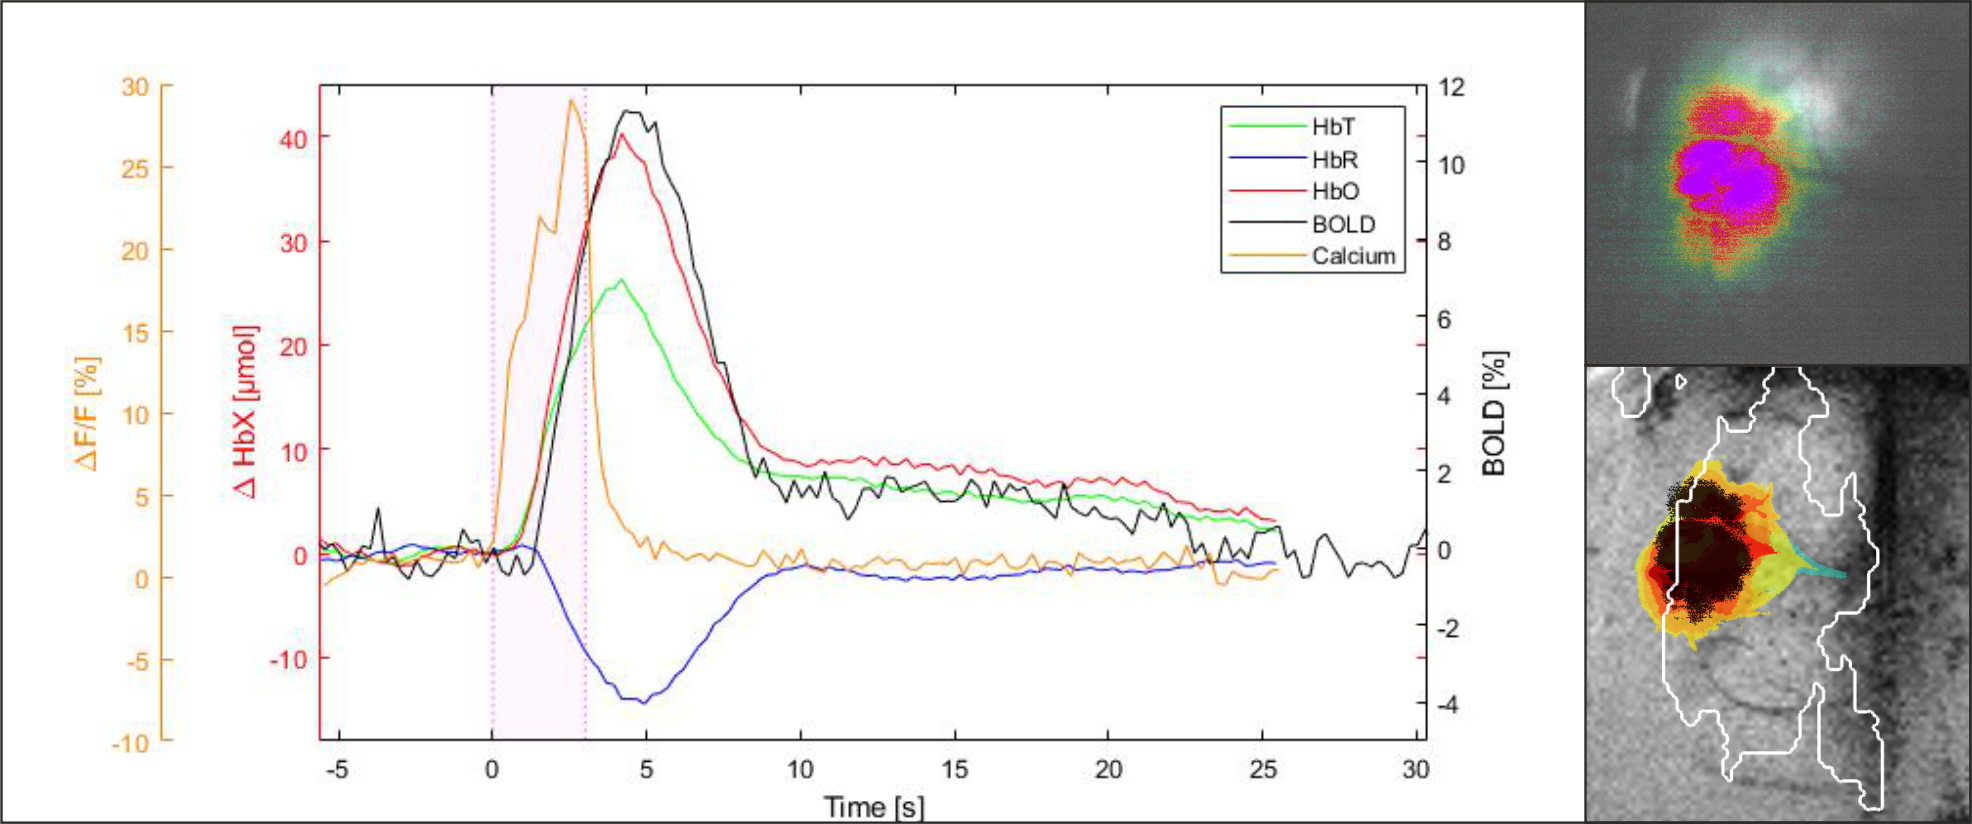
Figure 3: Left: Signal time courses of HbO, HbR, HbT, BOLD and calcium signal averaged over the neuronal activated region as shown at the right (black 'calcium mask'; data averaged over 24 trials). Reddish shaded interval indicates stimulation period (3 s, 2 mA, 9 Hz). Top right: ΔF/F (calcium signal) during forepaw stimulation. Bright background shows area with CGaMP expression but no significant calcium signal change. Bottom right: In color: region with significant hemodynamic changes (IOI mask); white outline: overlaid BOLD mask; black: calcium signal (mask)
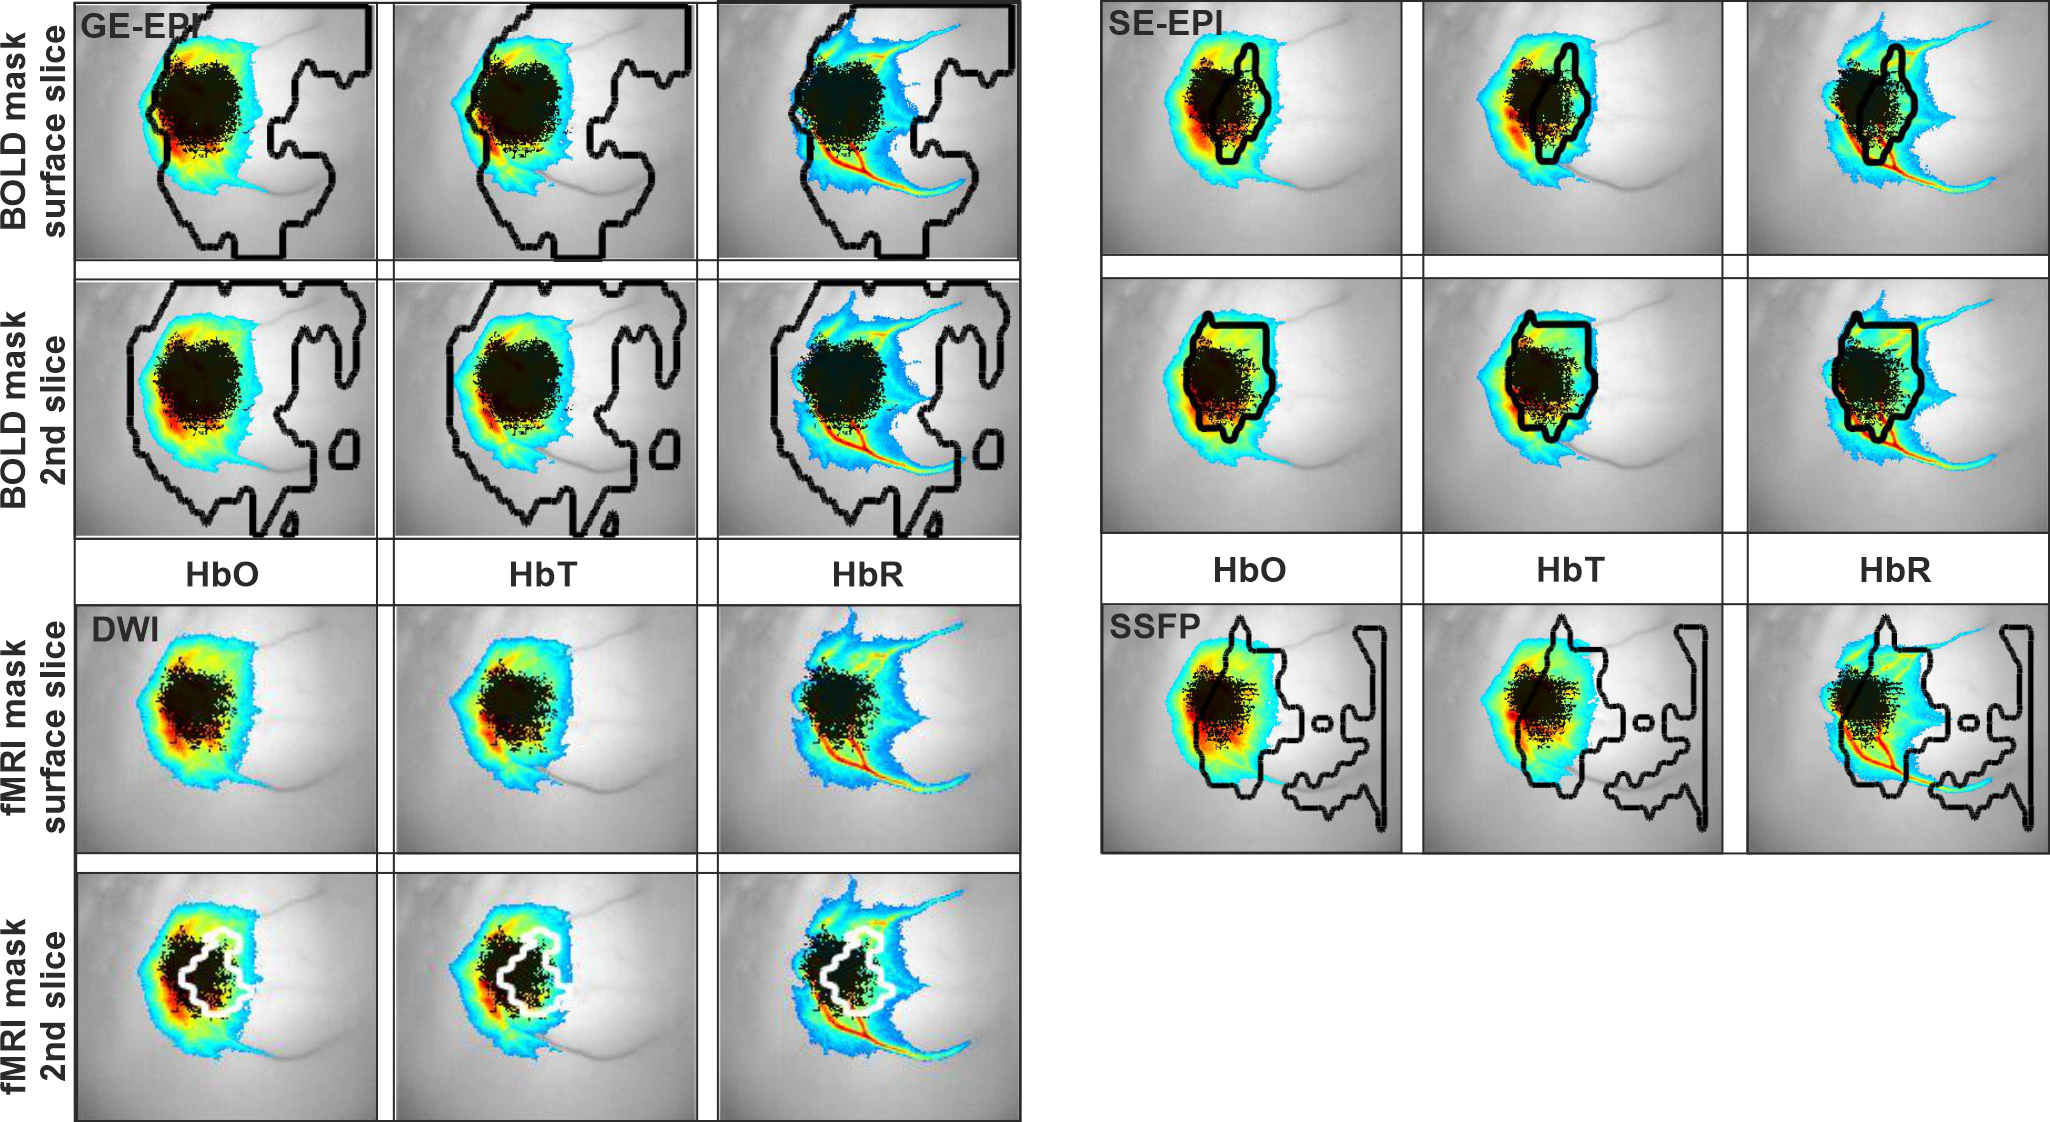
Figure 4: Spatial distribution of BOLD, hemodynamic changes (HbO, HbR, HbT) and intracellular calcium increase. The fMRI signal/BOLD activated region is shown as mask determined with SPM, outlined in black or white, respectively. Areas of hemodynamic response are determined with clustering, thresholding and PCA and shown in color, indicating the intensity of the change. Significant calcium activity is shown in black. Results are shown for four different MR sequences and two slices (each slice 0.5 mm thickness; for SSFP only one slice was acquired).
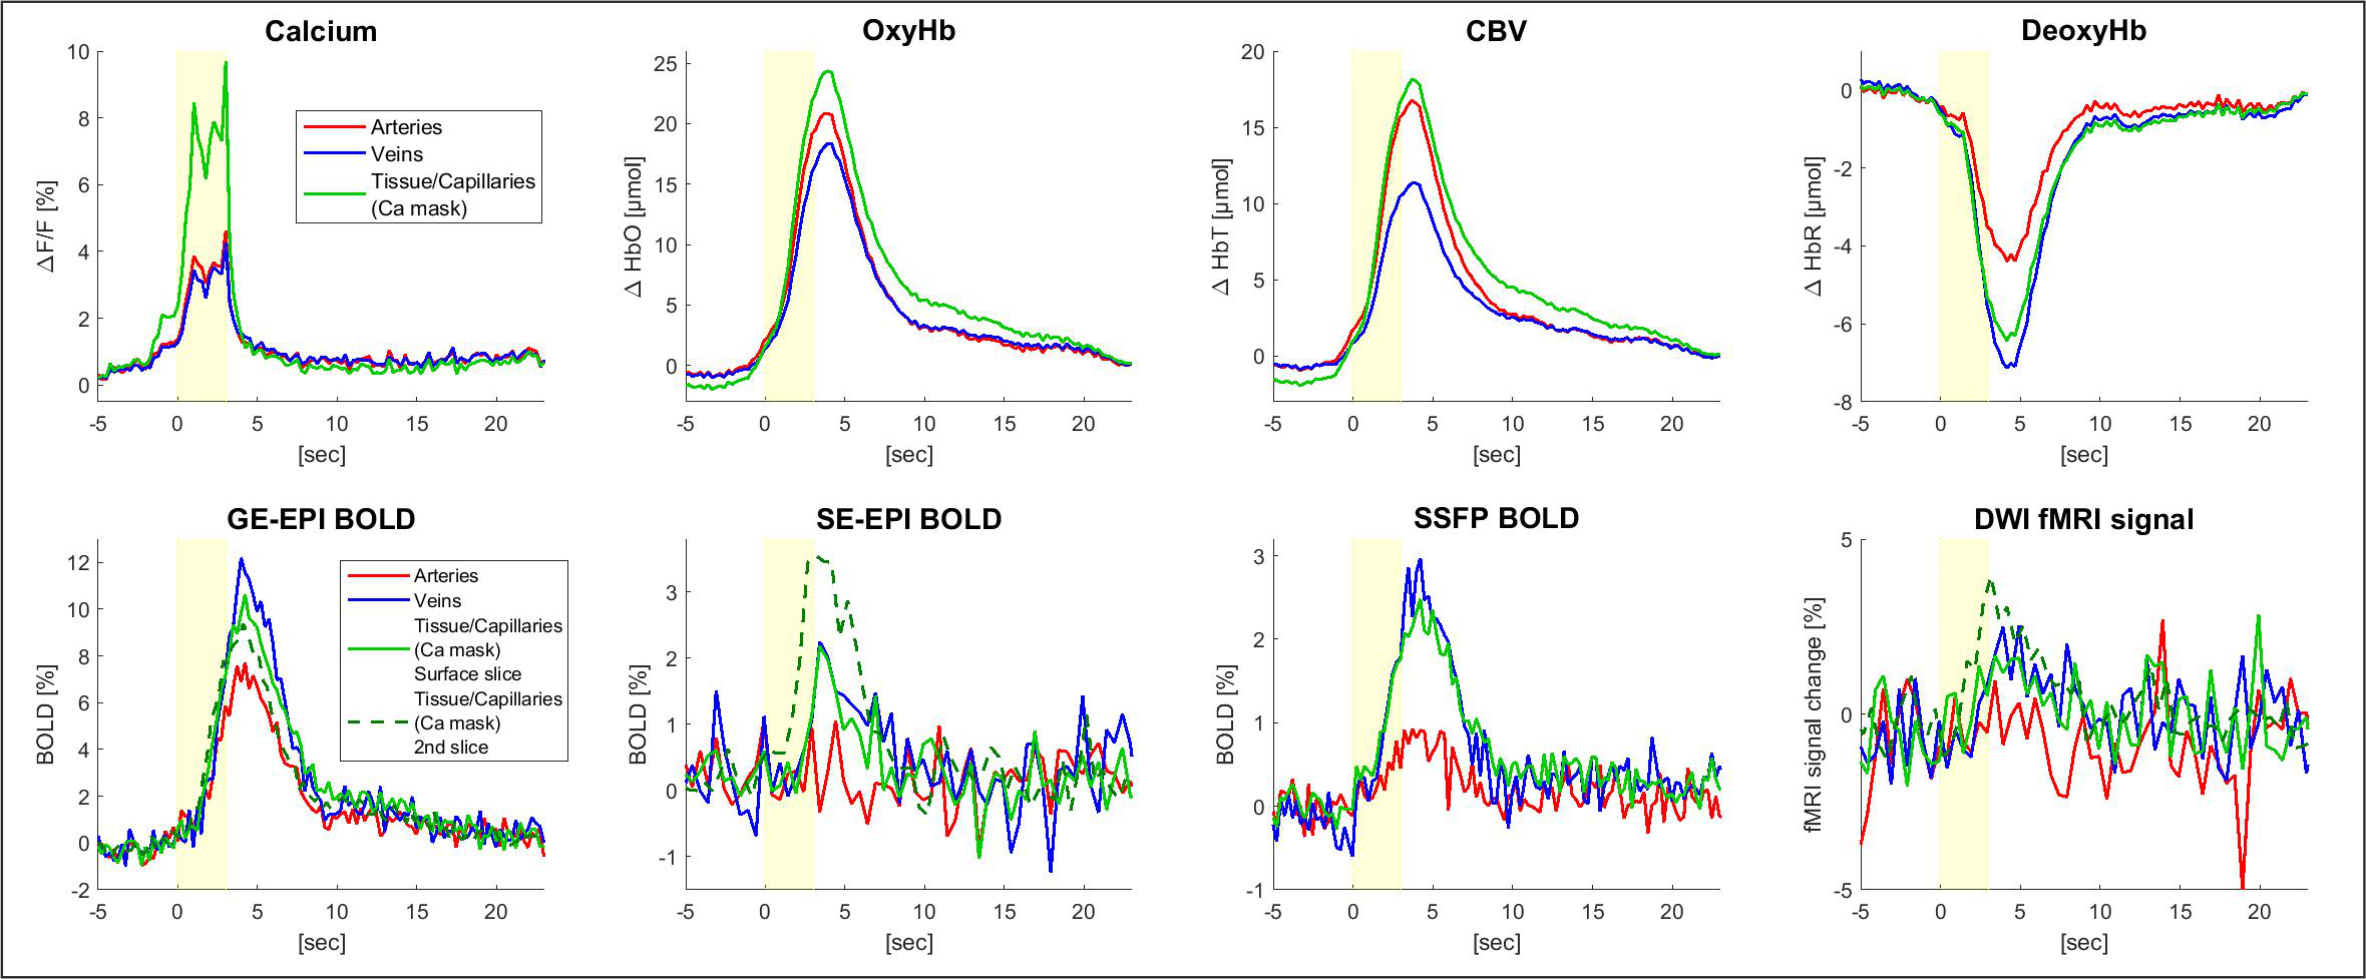
Figure 5: Time courses for calcium signal, HbO, HbT, HbR and BOLD signals acquired with four different techniques (compare figure 4) taken from different ROIs (arteries (red), veins (blue), tissue area defined by significant change in the calcium signal (‘calcium mask’) with capillaries but without visible vessels (green)). FMRI tissue data is taken from the surface slice (solid green line) and second slice (~0.5 mm depth; dashed green line).