1328
Cross-validating magnetic resonance elastography and ultrasound time-harmonic elastography of the brain by using a 3D optical tracker1Department of Radiology, Charité - Universitätsmedizin Berlin, Corporate Member of Freie Universität Berlin, Humboldt-Universität zu Berlin, and Berlin Institute of Health, Berlin, Germany, 2Department of Anesthesiology, Yale School of Medicine, New Haven, CT, United States
Synopsis
Keywords: Multimodal, Elastography, Cross-validation
Motivation: Magnetic resonance elastography (MRE) and ultrasound time-harmonic elastography (USE-THE) have not been cross-validated yet. Since their results are in 3D and 2D, respectively, aligning them is difficult.
Goal(s): To cross-validate MRE and USE-THE in the brain based on a common atlas space.
Approach: An optical system tracked the position of fiducial markers derived from MRE during USE-THE measurements. Consequently, the resulting spatial alignment of both measurements allowed direct comparison.
Results: Stiffness was averaged over the whole field-of-view and over five anatomical regions. Globally, agreement was good (ICC=0.6982) and regionally, it was acceptable based on a Wilcoxon signed test (p>0.05).
Impact: Agreement between cerebral MRE and USE will facilitate multi-modal neural tissue characterization. Combined MRE-USE could benefit from high spatial resolution of MRE and high temporal resolution of USE-THE.
Introduction
Magnetic resonance elastography (MRE) is a widely validated imaging technique that allows non-invasive, quantitative assessment of soft tissue mechanics1. Cerebral MRE has shown to be highly reproducible2 and sensitive to physiological effects3,4. However, its low temporal resolution limits its sensitivity to temporal changes in stiffness5. On the contrary, ultrasound time-harmonic elastography3 (USE-THE) is an emerging elasticity imaging technique with high temporal resolution down to tens of milliseconds6, but with limited spatial resolution. USE-THE is based on the same mechanical stimulation principle of externally induced harmonic vibrations. Therefore, provided that the obtained stiffness values are comparable, it could compensate for MRE's blindness to rapid stiffness changes. However, reconciling the two techniques is not easy, as USE-THE can only image 2D planes accessible through the temporal bone window. In this study, for the first time, stiffness values obtained from both techniques were aligned using a 3D optical tracking system7. In this way, the USE-THE measurements were mapped into the 3D space of MRE, allowing direct comparison and cross-validation of both techniques.Methods
Subjects: 10 healthy volunteers (1 woman, age 25-40 years) were recruited for participation in this study.MRE: Stiffness maps were acquired over 8 wave-phase offsets using a 3D single-shot spin-echo MRE sequence (figure 1) with an echo-planar-imaging readout and following parameters: TR 4700ms, TE 70ms, 126x126x40 voxels of size 1.6x1.6x2mm3. Motion sensitivity was achieved by using flow-compensated motion encoding gradients in three orthogonal directions. Multifrequency vibration (20;25;20;35Hz) was induced using compressed air drivers placed underneath the subject’s head.
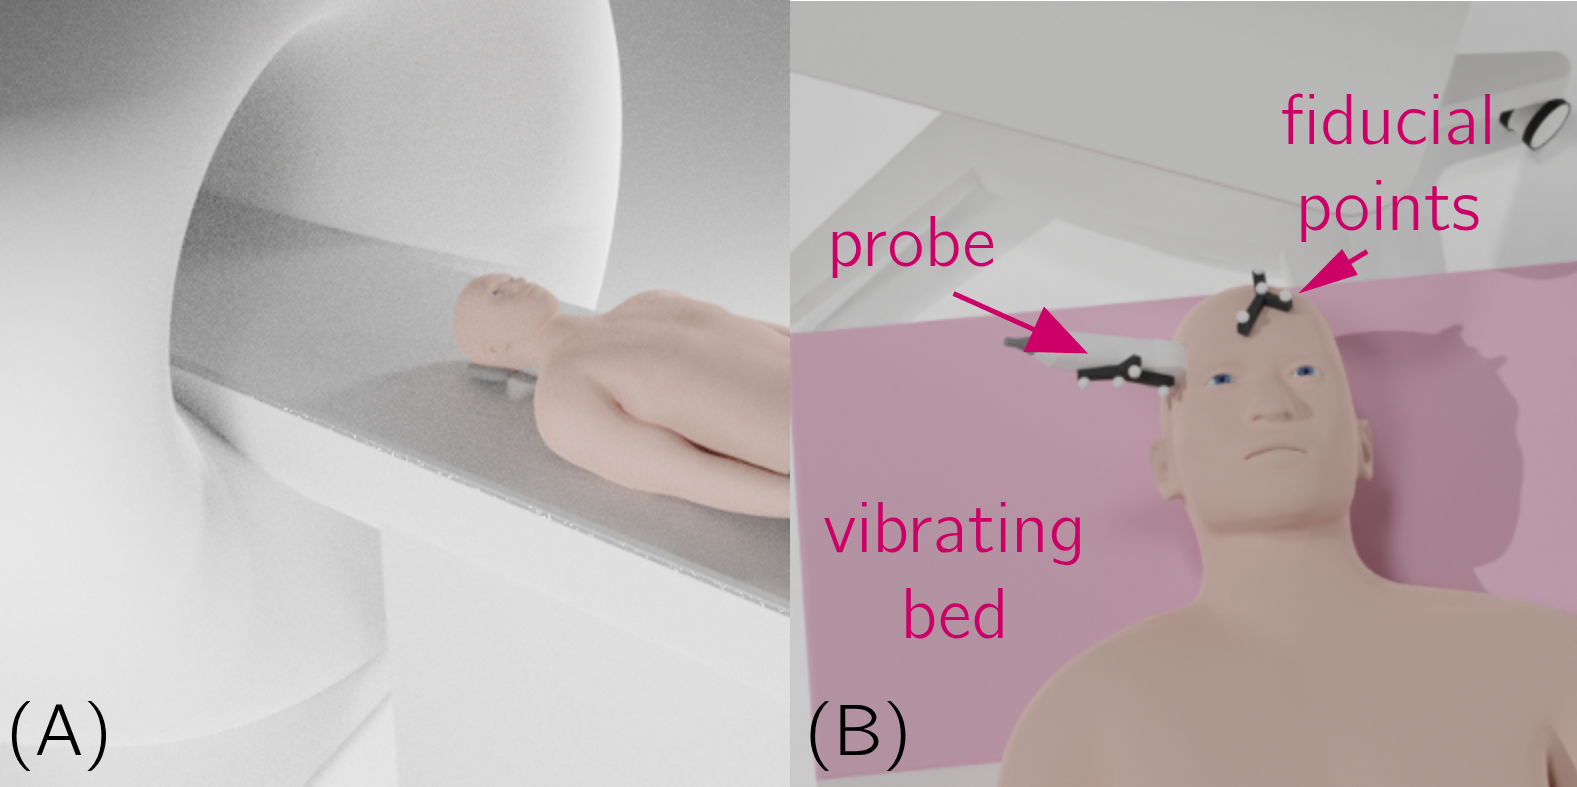
USE-THE: USE-THE was performed directly after MRE. Each subject was positioned on a custom-designed vibration bed (GAMPTmbH, Merseburg, Germany) with the head above the vibration unit (figure 1). Multifrequency vibration (27;33;39;44;50;56Hz) was induced and the brain was imaged 15 times, 80 frames over 1s each, through the temporal bone window using a phased array transducer (P4-2v, 3MHz).
Optical tracking: An NDI Polaris Vicra optical tracking camera (NDI Medical, Cleveland, Ohio, USA) captured the position of 9 fiducial markers on the ultrasound probe and the subject’s face (figure 1, right). Then, using 3D Slicer8 and Plus Toolkit9, these markers were registered onto the MRI7.
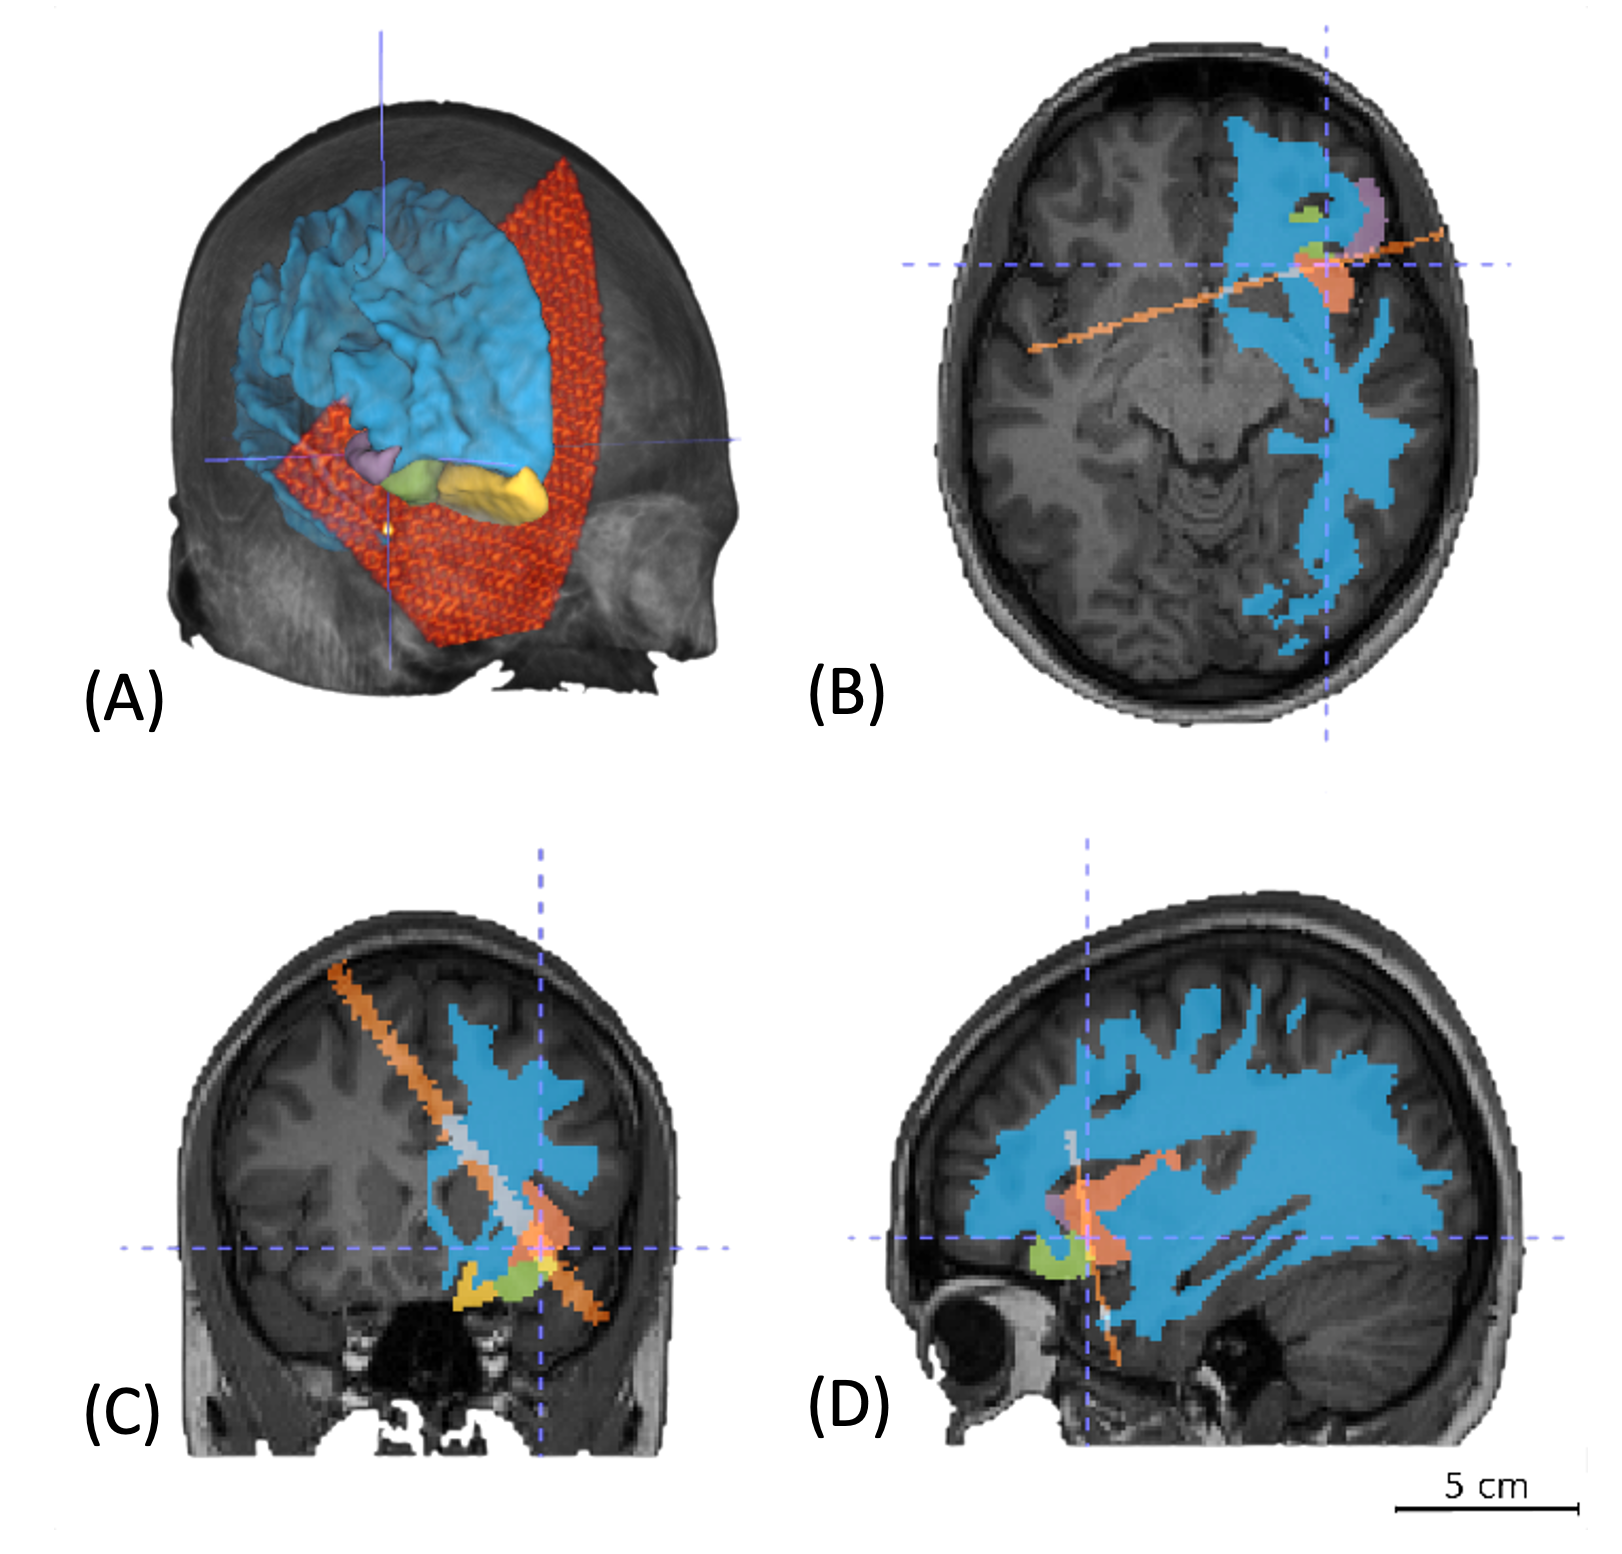
Processing: Shear wave speed (SWS) maps were obtained using the same pipeline with k-MDEV inversion10. USE-THE slices were aligned to MRE volumes using the optical tracking information (figure 2). The median of 15 measurements was assigned to each matching voxel. All measurements were registered onto the MNI atlas using SPM1211. Voxels with SWS above a threshold1 were segmented into different regions12. Globally and regionally averaged stiffness values of each subject are reported.
Statistics: Agreement between MRE and USE-THE was investigated using the one-way random interclass correlation coefficient for single measures (ICC) and Bland-Altman plots. Paired Wilcoxon test was used to test differences between methods within each region.
Results
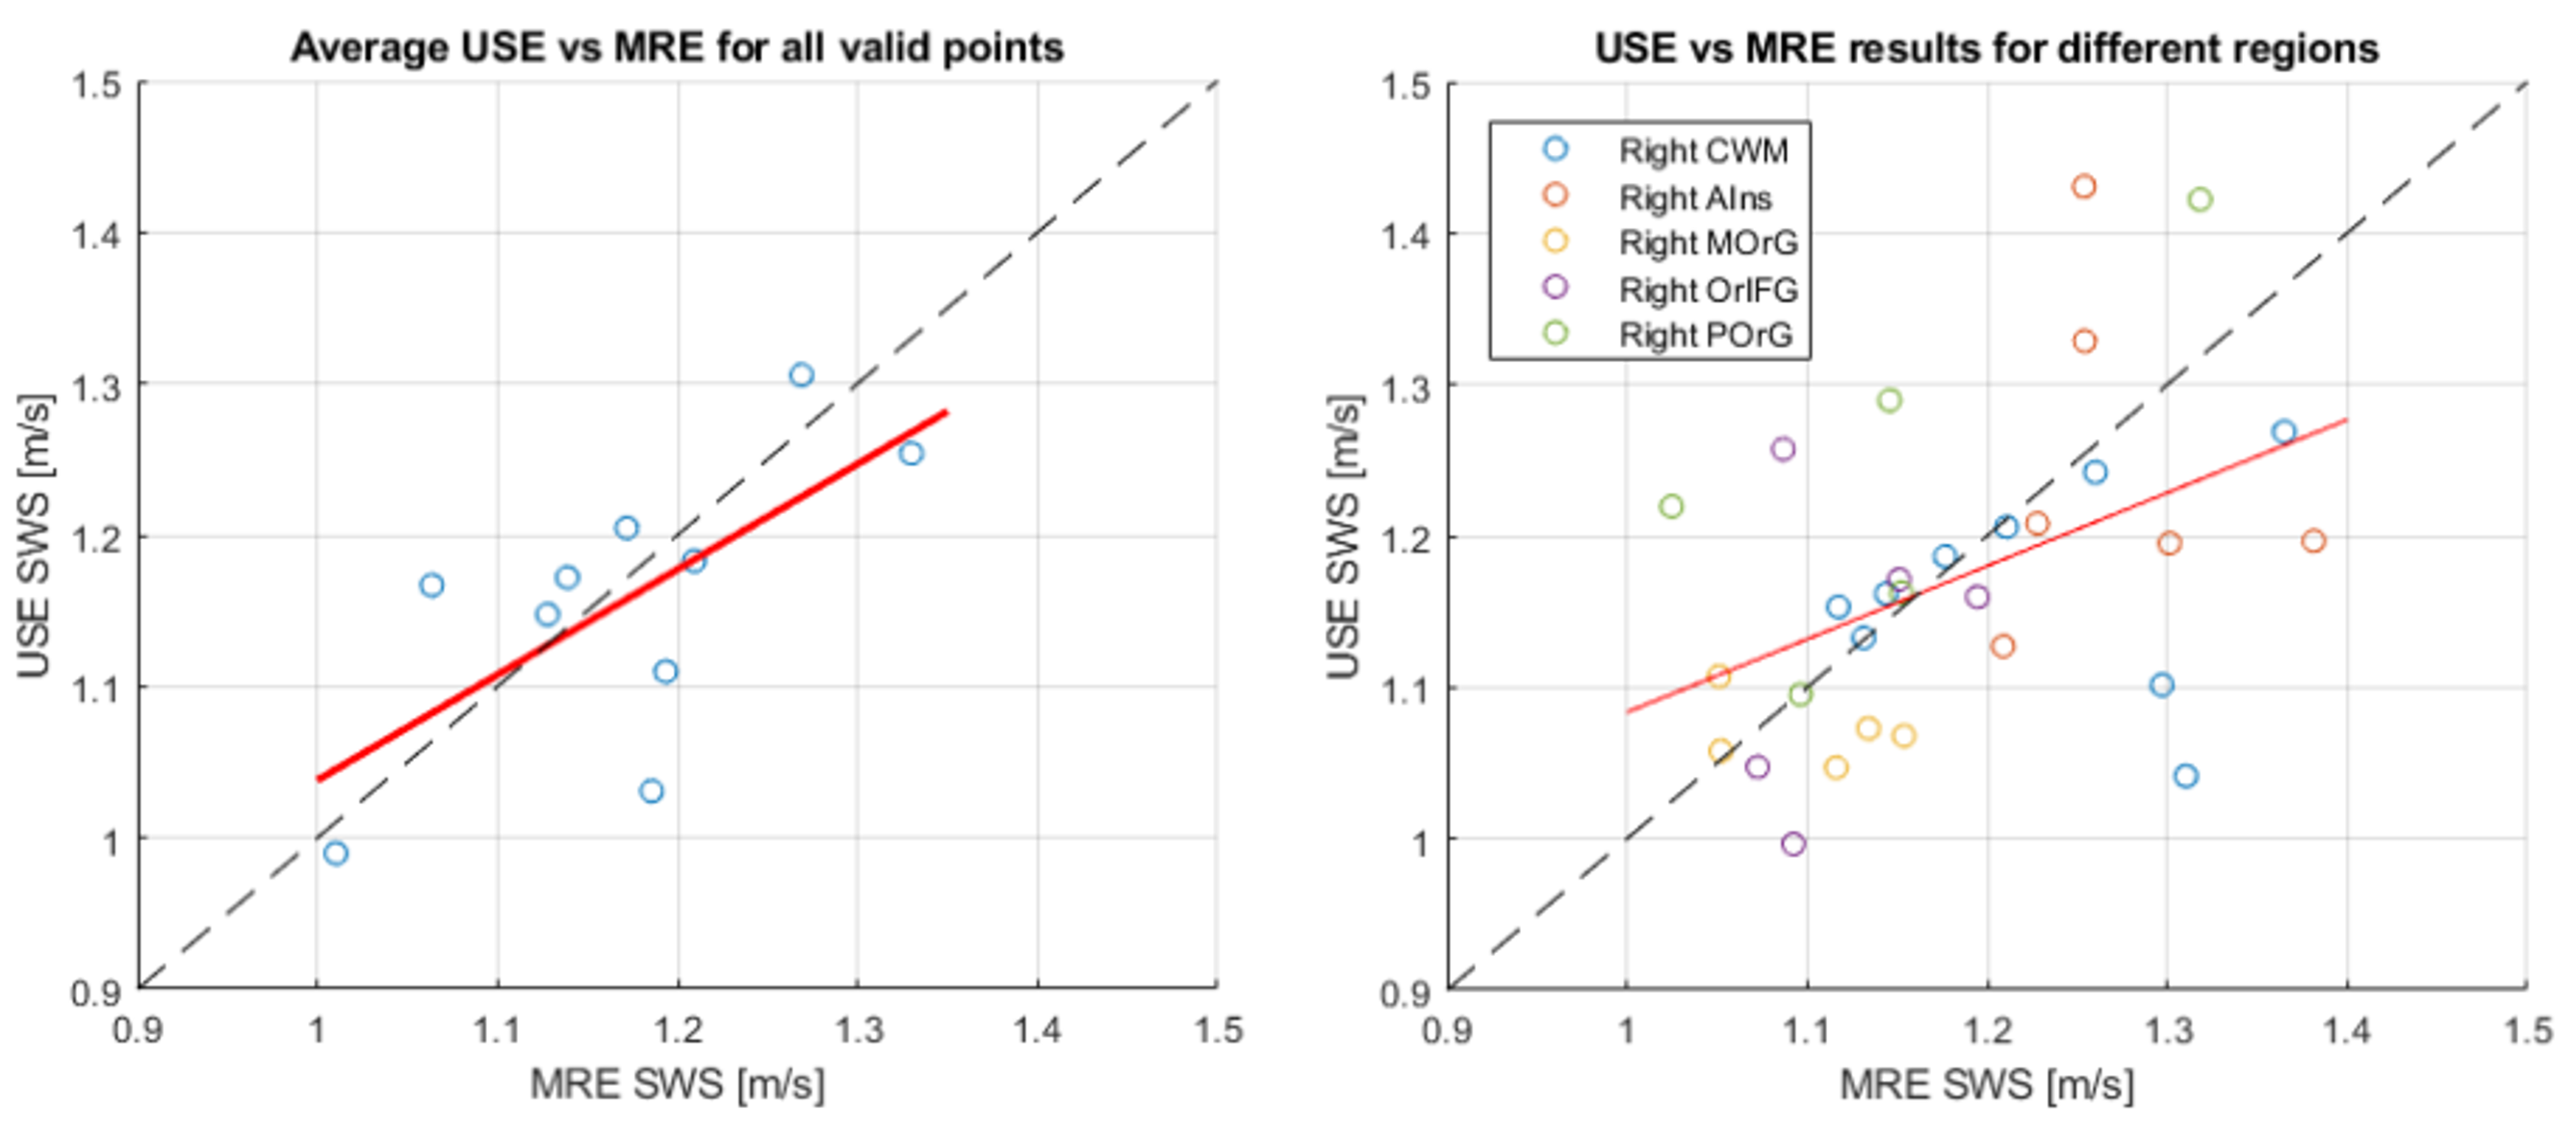
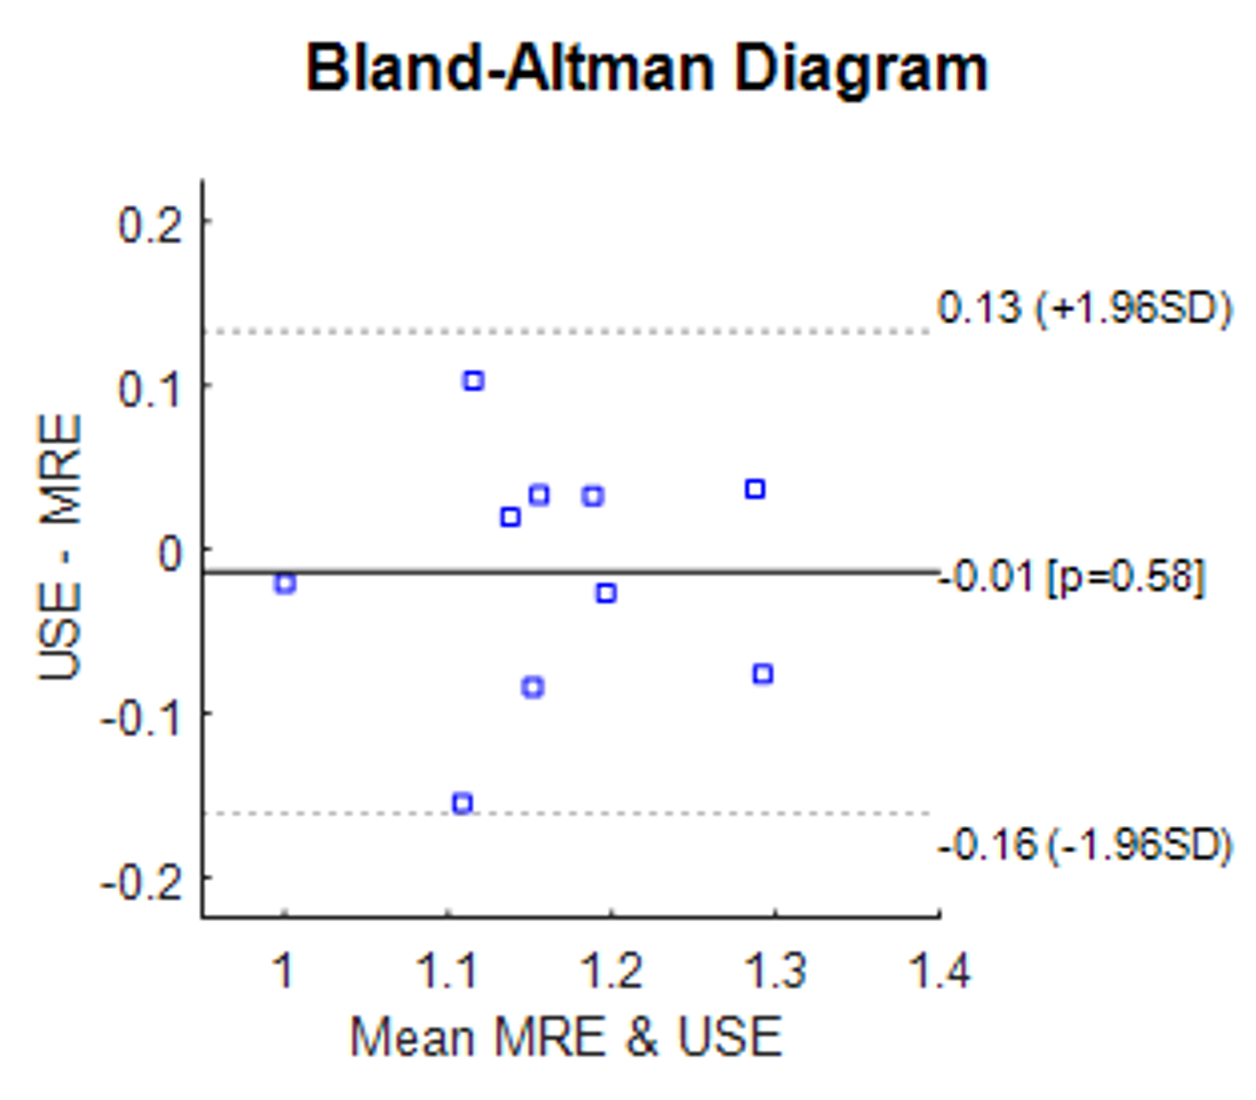
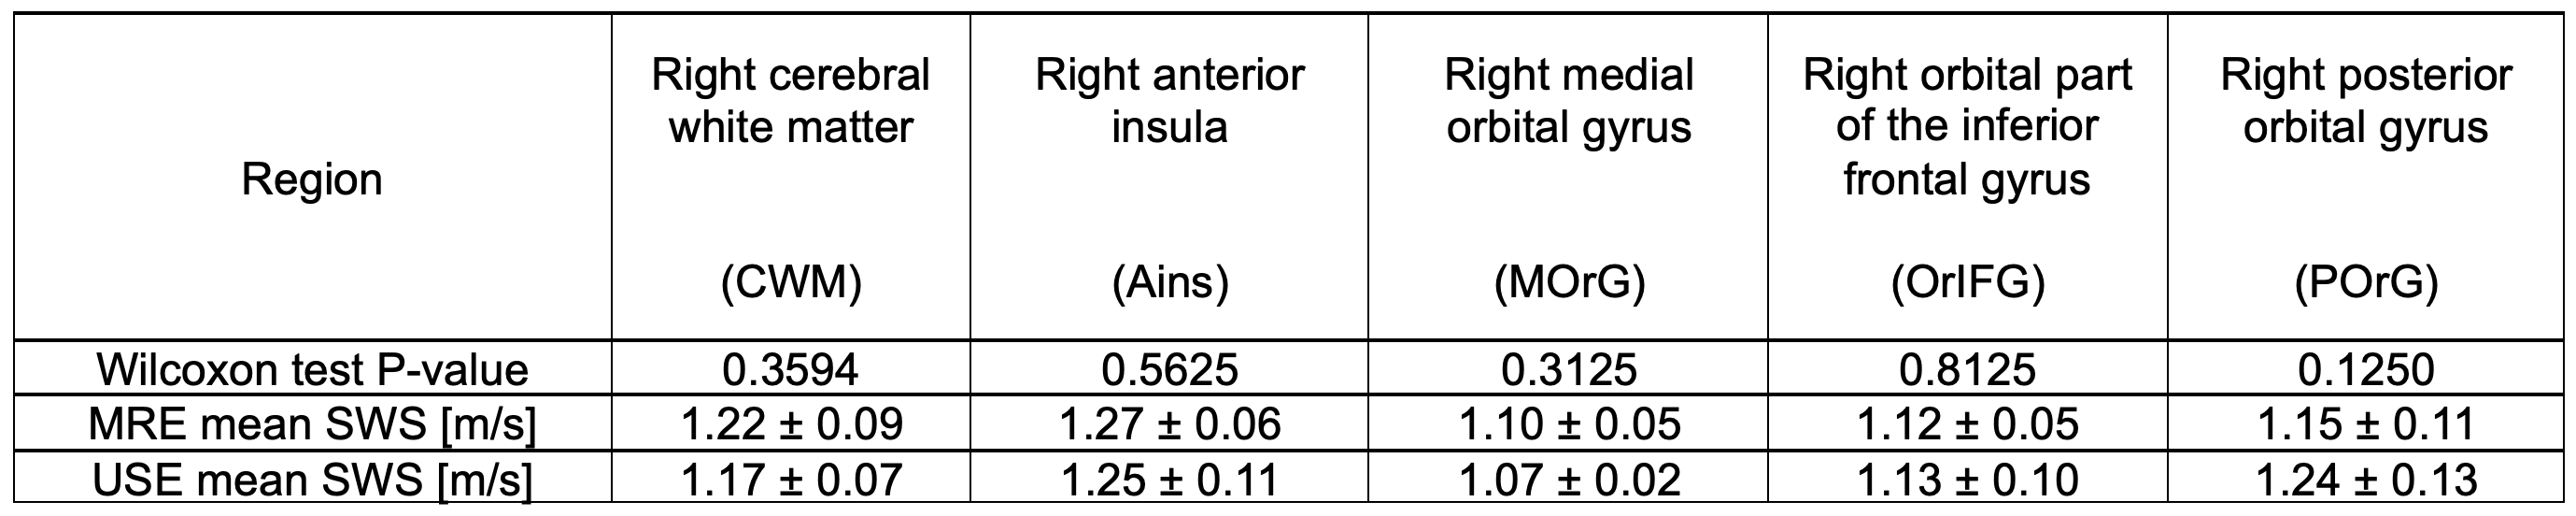
Measurements averaged over all regions showed good agreement between MRE and USE-THE (ICC = 0.6982, figure 3). The Bland-Altman diagram (figure 4) indicates a mean difference of -0.01m/s and 95% limits of agreement at -0.16 m/s and 0.13 m/s. Regionally resolved SWS values were also similar (figure 3). The mean SWS for MRE and USE-THE was 1.22±0.09m/s and 1.17±0.07m/s for cerebral white matter, 1.27±0.06m/s and 1.25±0.11m/s for anterior insula, 1.10±0.05m/s and 1.07±0.02m/s for medial orbital gyrus, 1.12±0.05m/s and 1.13±0.10m/s for the orbital part of the inferior frontal gyrus and 1.15±0.11m/s and 1.24±0.13m/s for posterior orbital gyrus, respectively (figure 5). As a result, the Paired Wilcoxon test did not suggest an effect for any region (p>0.05).Discussion
For the first time, MRE and USE-THE were cross-validated with precise spatial alignment. The globally averaged SWS values match well with limits of agreement that are smaller than the order of magnitude of disease related stiffness changes13. Region resolved, a higher variation was observed in USE-THE, which can be explained by the well-known challenges of transcranial ultrasound, e.g. reflections at skull-tissue or fluid-tissue interfaces that deteriorate the signal. This explanation is supported by the fact that the included voxels belong primarily to regions close to the transducer (figure 2). Also, slightly different vibration frequencies were used during both measurements, so systematic errors can also arise.Conclusion
MRE and USE-THE measure brain stiffness values with good agreement. While MRE can image the whole brain with high spatial resolution, its low temporal resolution prevents the investigation of time-dependent effects in the sub-second range. Alternatively, USE-THE can provide stiffness maps with high temporal resolution, but suffers from low detail in the brain. The results of this study encourage multimodal MRE-USE investigations of brain mechanics with high spatial and temporal resolution.Acknowledgements
No acknowledgement found.References
1. Herthum H, Hetzer S, Kreft B, Tzschätzsch H, Shahryari M, Meyer T, Görner S, Neubauer H, Guo J, Braun J, Sack I. Cerebral tomoelastography based on multifrequency MR elastography in two and three dimensions. Frontiers in Bioengineering and Biotechnology 2022;10.
2. Sack I, Beierbach B, Hamhaber U, Klatt D, Braun J. Non-invasive measurement of brain viscoelasticity using magnetic resonance elastography. NMR in Biomedicine 2008;21(3):265-271.
3. Meyer T, Kreft B, Bergs J, Antes E, Anders MS, Wellge B, Braun J, Doyley M, Tzschätzsch H, Sack I. Stiffness pulsation of the human brain detected by non-invasive time-harmonic elastography. Frontiers in Bioengineering and Biotechnology 2023;11.
4. Sack I, Beierbach B, Wuerfel J, Klatt D, Hamhaber U, Papazoglou S, Martus P, Braun J. The impact of aging and gender on brain viscoelasticity. NeuroImage 2009;46(3):652-657.
5. Anders M, Meyer T, Warmuth C, Pfeuffer J, Tzschaetzsch H, Herthum H, Shahryari M, Degenhardt K, Wieben O, Schmitter S, Schulz-Menger J, Schaeffter T, Braun J, Sack I. Rapid MR elastography of the liver for subsecond stiffness sampling. Magnetic Resonance in Medicine;n/a(n/a).
6. Kreft B. Development and validation of in vivo ultrasound time-harmonic elastography of the human brain towards clinical application2023.
7. Frank Preiswerk STB, Nathan J. McDannold, Timothy Y. Mariano. Open-source neuronavigation for multimodal non-invasive brain stimulation using 3D Slicer. arXiv: Medical Physics 2019.
8. Fedorov A, Beichel R, Kalpathy-Cramer J, Finet J, Fillion-Robin J-C, Pujol S, Bauer C, Jennings D, Fennessy F, Sonka M, Buatti J, Aylward S, Miller JV, Pieper S, Kikinis R. 3D Slicer as an image computing platform for the Quantitative Imaging Network. Magnetic Resonance Imaging 2012;30(9):1323-1341.
9. Lasso A, Heffter T, Rankin A, Pinter C, Ungi T, Fichtinger G. PLUS: Open-Source Toolkit for Ultrasound-Guided Intervention Systems. IEEE Transactions on Biomedical Engineering 2014;61(10):2527-2537.
10. Tzschätzsch H, Guo J, Dittmann F, Hirsch S, Barnhill E, Jöhrens K, Braun J, Sack I. Tomoelastography by multifrequency wave number recovery from time-harmonic propagating shear waves. Medical Image Analysis 2016;30:1-10.
11. Friston KJ. Statistical parametric mapping. Functional neuroimaging: Technical foundations. San Diego, CA, US: Academic Press; 1994. p 79-93.
12. Landman BA, Ribbens A, Lucas B, Christos CD, Avants B, Ledig C, Ma D, Rueckert D, Warfield SK, Vandermeulen D. MICCAI 2012 Workshop on Multi-Atlas Labeling: CreateSpace Independent Publishing Platform; 2012.
13. Murphy MC, Jones DT, Jack CR Jr, Glaser KJ, Senjem ML, Manduca A, Felmlee JP, Carter RE, Ehman RL, Huston J 3rd. Regional brain stiffness changes across the Alzheimer's disease spectrum. Neuroimage Clin. 2015 Dec 19;10:283-90. doi: 10.1016/j.nicl.2015.12.007. PMID: 26900568; PMCID: PMC4724025.
Figures