1327
Simultaneous EEG-fMRI at 7T with adapted EEG leads and reference sensors for high-quality, high-resolution imaging: human evaluation1CSEM - Swiss Center for Electronics and Microtechnology, Bern, Switzerland, 2CIBM Center for Biomedical Imaging, Lausanne, Switzerland, 3EEG and Epilepsy Unit, Department of Clinical Neurosciences, University Hospitals and University of Geneva, Geneva, Switzerland, 4Department of Diagnostic, Interventional and Pediatric Radiology, Bern University Hospital, University of Bern, Bern, Switzerland, 5Translational Imaging Center (TIC), Swiss Institute for Translational and Entrepreneurial Medicine, Bern, Switzerland, 6Institute of Diagnostic and Interventional Neuroradiology, Bern University Hospital, University of Bern, Bern, Switzerland
Synopsis
Keywords: Multimodal, High-Field MRI, EEG, fMRI, EEG-fMRI, 7T, laminar
Motivation: The combination of BOLD-fMRI at 7T with EEG could bring novel insights to neuroscience. However, the combination has remained challenging due to accentuated artifacts and RF-coil constraints.
Goal(s): To implement a first-of-its-kind 7T EEG-fMRI framework combining key developments from recent studies, and assess its safety, data quality and functional sensitivity in humans.
Approach: Extensive tests in phantom and humans(N=8) including field mapping, structural MRI and fMRI (1.6 and 0.8mm-resolution) acquired with+without EEG. Comparisons of data quality and functional sensitivity.
Results: The framework proved safe and feasible with fMRI down to sub-mm resolution, with moderate quality losses and potentially negligible impact on functional sensitivity.
Impact: This study characterizes the feasibility of 7T-EEG-fMRI with high sensitivity and acceleration capabilities, which could bring valuable insights to research in e.g. laminar functional connectivity, or localization of epileptogenic sources and their propagation pathways, for clinical diagnostic and pre-surgical planning.
Introduction
The remarkable sensitivity of BOLD-fMRI at 7T is allowing unprecedented insights into human brain function1. Beyond this, BOLD-fMRI can be well complemented by scalp electroencephalography (EEG), which has a poorer spatial, but higher temporal specificity, and provides a more direct measure of neuronal activity2. Combined EEG-fMRI at 7T could bring game-changing new insights into active research lines such as laminar functional connectivity3 and epileptic activity propagation.Unfortunately, when combined, EEG and MRI suffer substantial limitations in data quality, which increase with field strength. The EEG components also impose physical constraints that have prevented the use of dense RF arrays for high-SNR, highly accelerated fMRI. Nonetheless, recent developments have shown promise to address these challenges, in separate studies4.
Here, we implemented, for the first time, a 7T EEG-fMRI framework combining several key developments: (i) compact EEG setup to minimize artifact induction5, (ii) integrated artifact sensors to denoise the EEG6, and (iii) EEG lead adaptations to allow combination with a state-of-the-art 32-channel receive RF array7. The new setup was extensively tested in a phantom and in human volunteers, including fMRI protocols with sub-mm resolution, for a comprehensive first-of-its-kind assessment of safety, data quality and functional sensitivity.
Methods
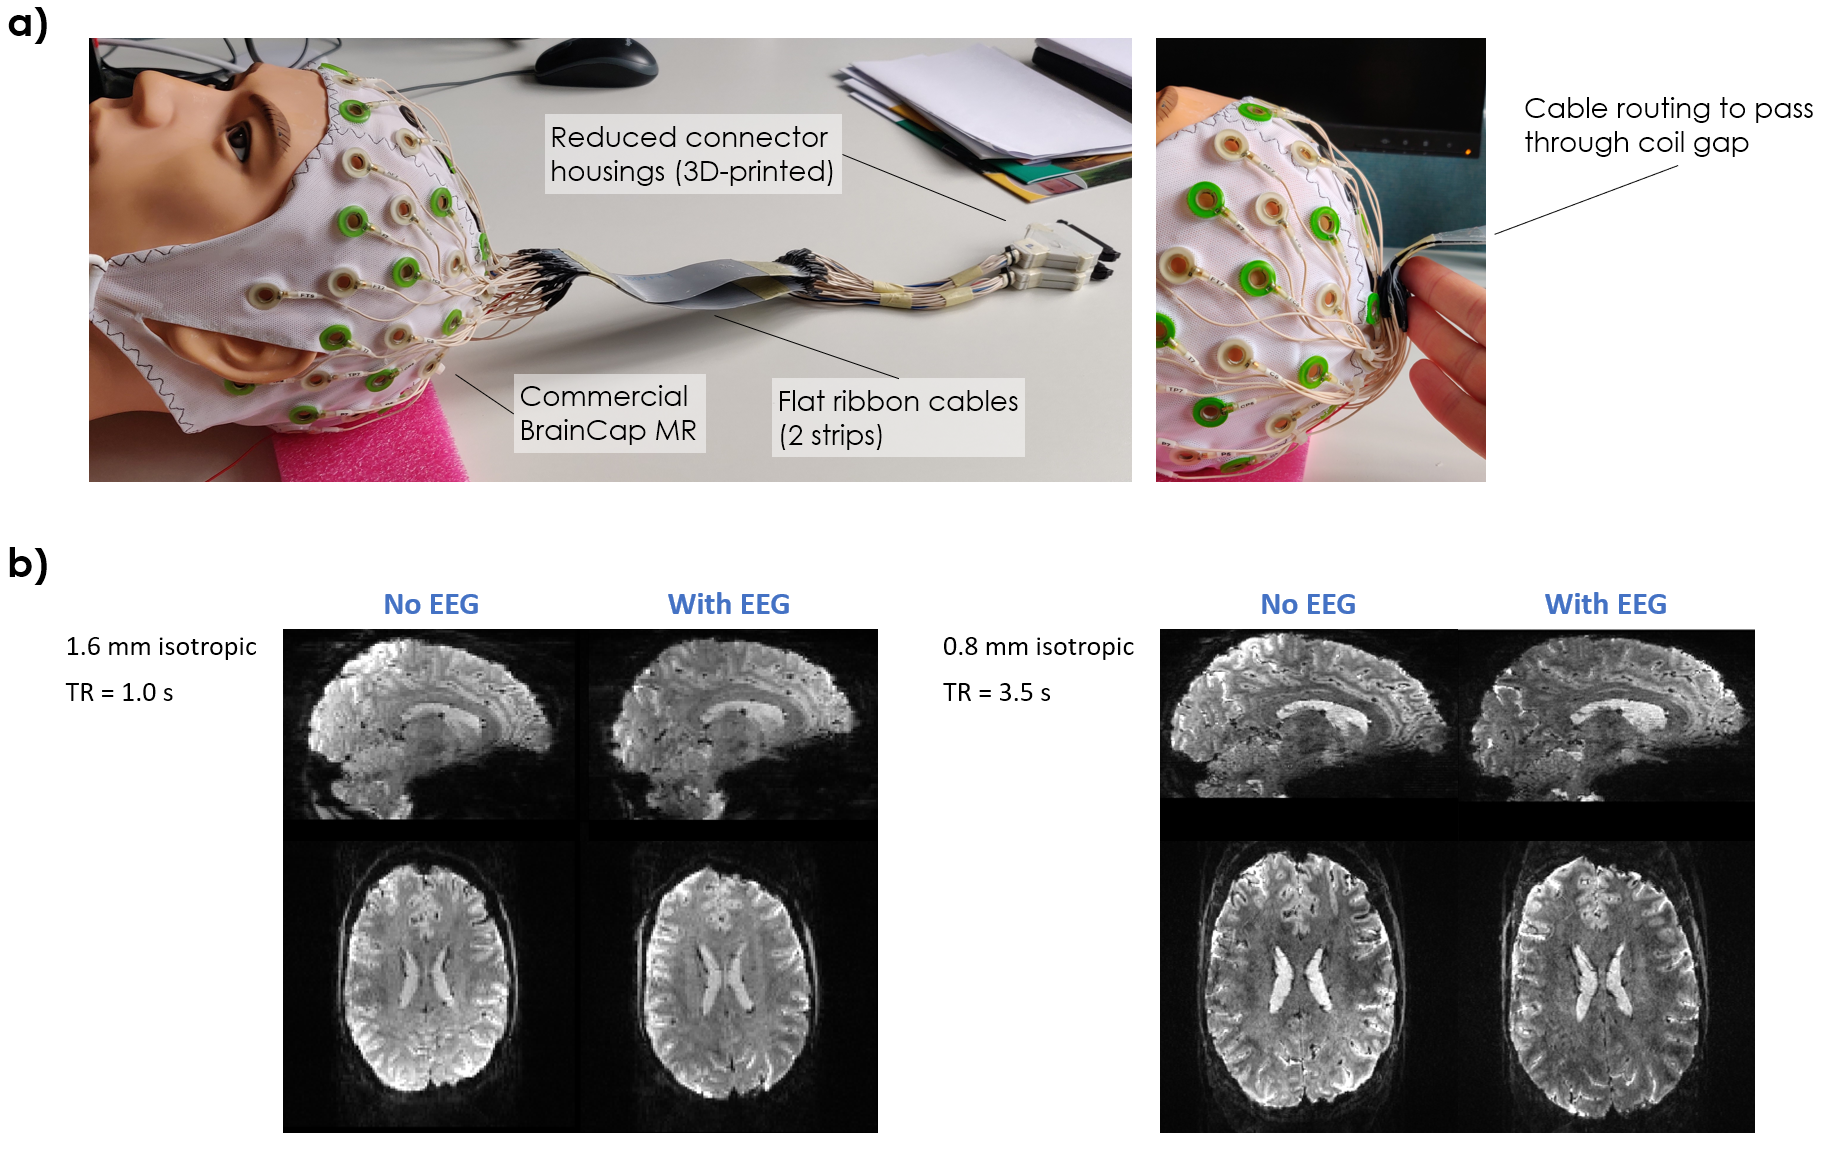
Setup: The MRI system was a 7T Terra (Siemens Healthcare) equipped with a single-channel transmit/32-channel receive head RF coil (Nova Medical). The EEG system comprised a 64-channel BrainCap-MR (Brain Products GmbH), adapted in-house to fit in the RF coil (Figure 1a), inspired by Meyer et al7. The cap was connected to two BrainAmp-MR-Plus amplifiers (Brain Products) placed just behind the head coil, to minimize cabling lengths5. Four EEG electrodes were adapted to serve as artifact sensors6. Temperature probes (Neoptix) were included to monitor heating effects.Data acquisition: The study included a phantom and 8 healthy adult volunteers (4M/4F, 27±3yo), with ethics approval and informed consent. Each participant first underwent an MRI-only session, then EEG outside the scanner room, and finally a session with simultaneous EEG-MRI. The MRI acquisitions, repeated without and with EEG, included: B0 and B1+ mapping, GRE-based structural (TR/TE=10/3.5ms, 1mm-resolution), and 8-min resting-state whole-brain fMRI with SMS-EPI at 1.6mm-resolution (TR/TE=1050/23ms, 2×4acc) and 0.8mm-resolution (TR/TE=3520/29ms, 3×3acc). A T1-weighted anatomical was acquired without EEG (MP2RAGE, 0.6mm-resolution). In the with-EEG session, the GRE and B1+ map were acquired at the reference transmit voltage calibrated for the no-EEG case (Vref) and repeated at the new voltage calibrated for with-EEG (Vadj).
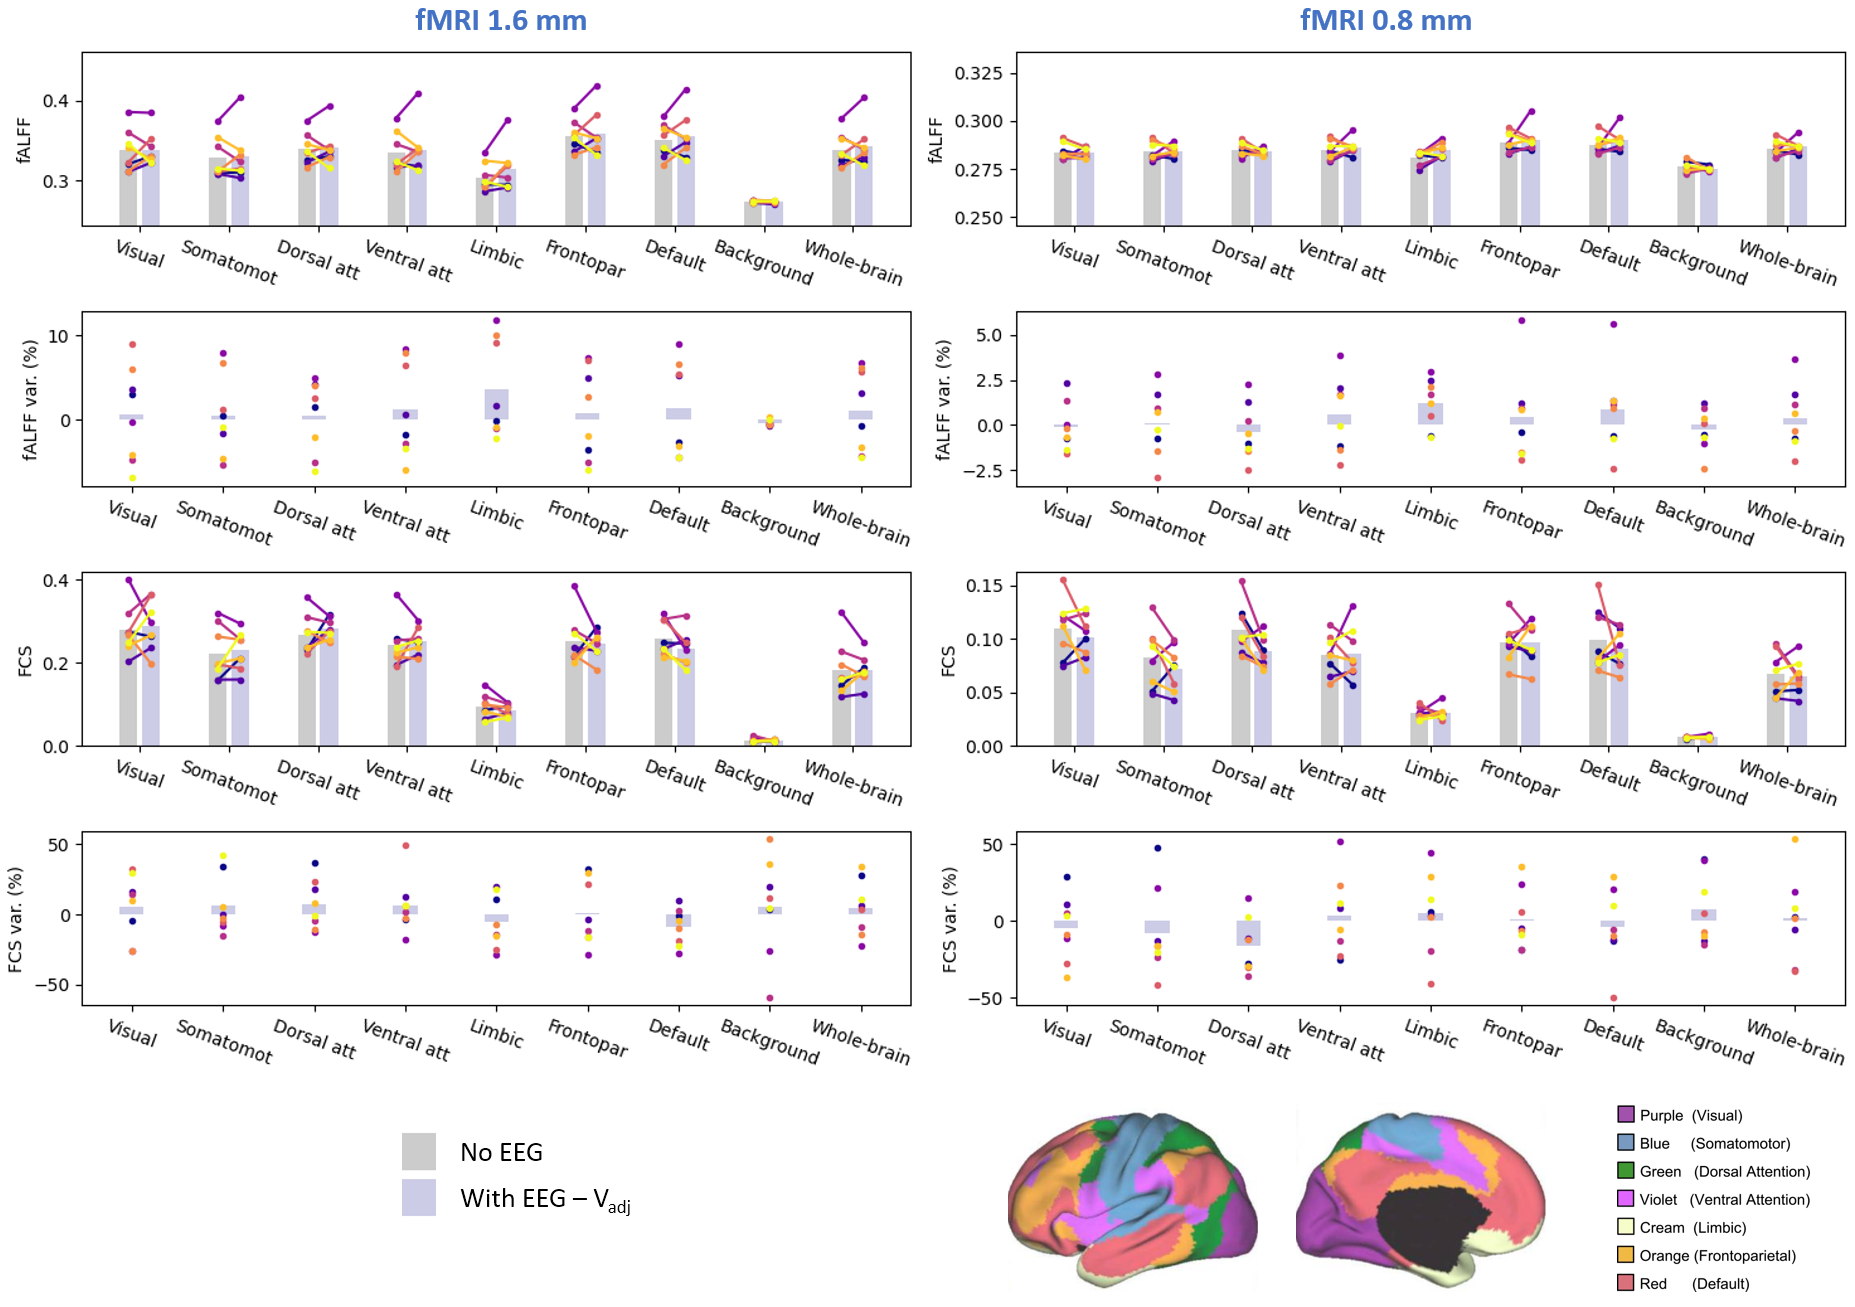
MRI analysis: Several metrics quantifying data quality and fMRI sensitivity were estimated for specific regions-of-interest (ROIs) and canonical intrinsic coupling networks8: field heterogeneity and amplitude, spatial and temporal SNR, fractional amplitude of low-frequency fluctuations (fALFF)9 and functional connectivity strength (FCS)10. All ROIs were derived from Freesurfer, via T1w segmentation, and non-linearly registered to the native space of each image.
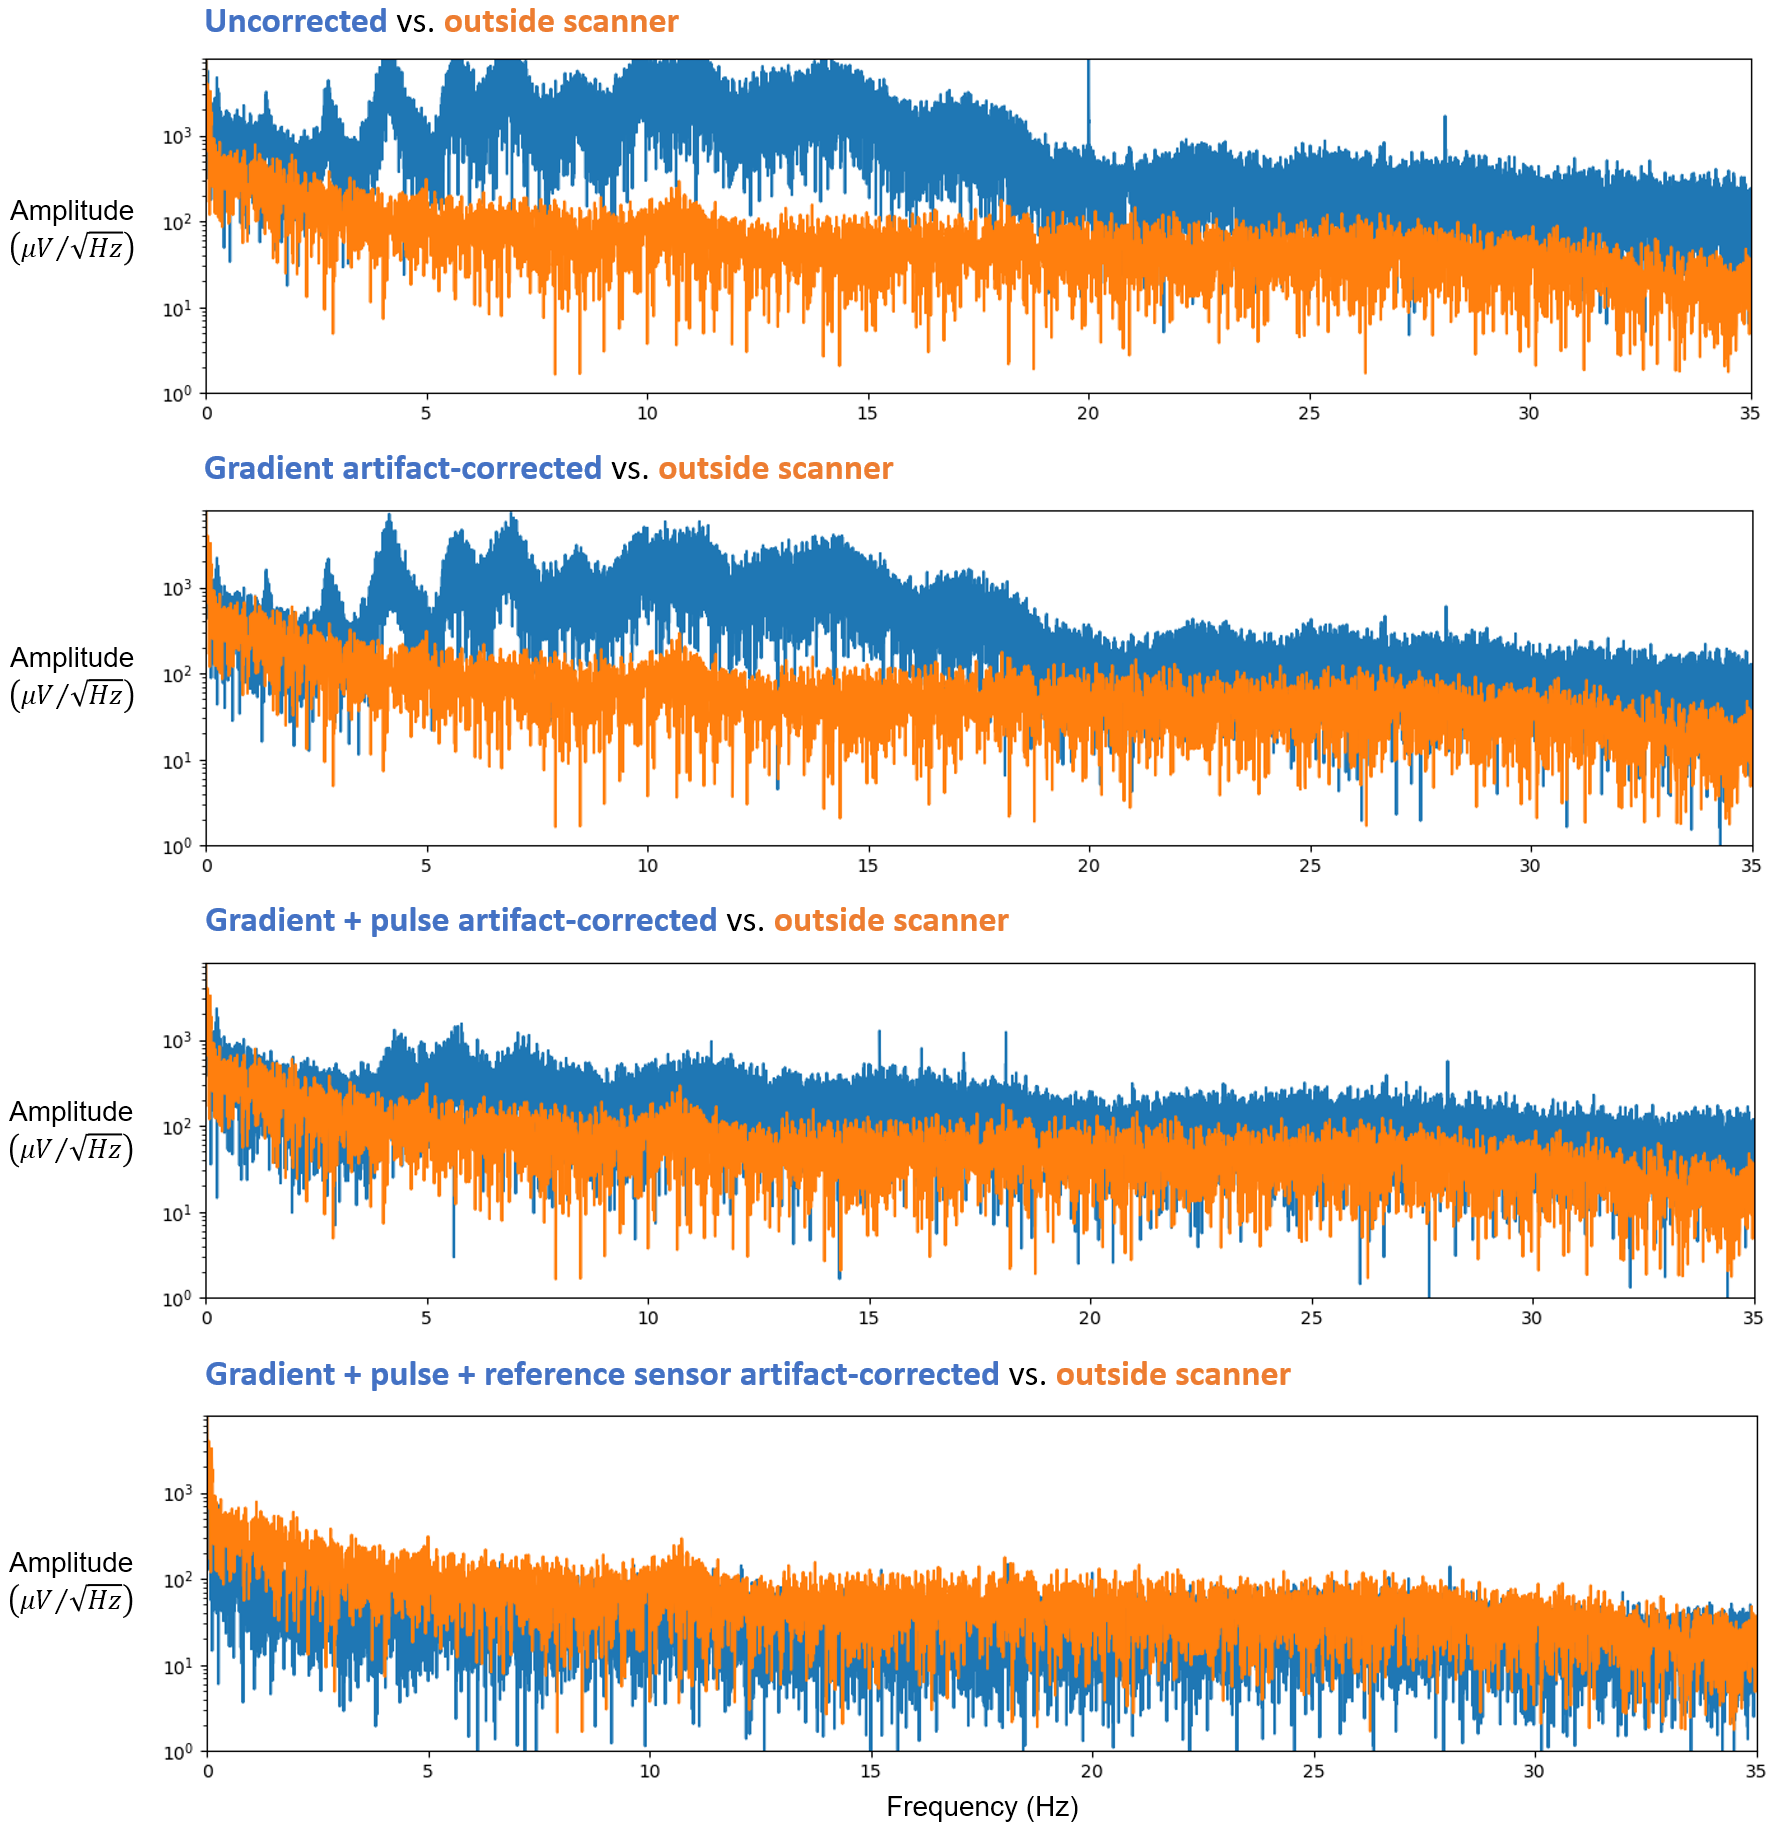
EEG analysis: The EEG data from EEG-fMRI runs underwent several correction steps, including gradient artifact (AAS + OBS11), pulse artifact (based on K-means clustering12), and reference sensor-based artifact correction6. The corrected signals were then compared to recordings made outside the scanner.
Results
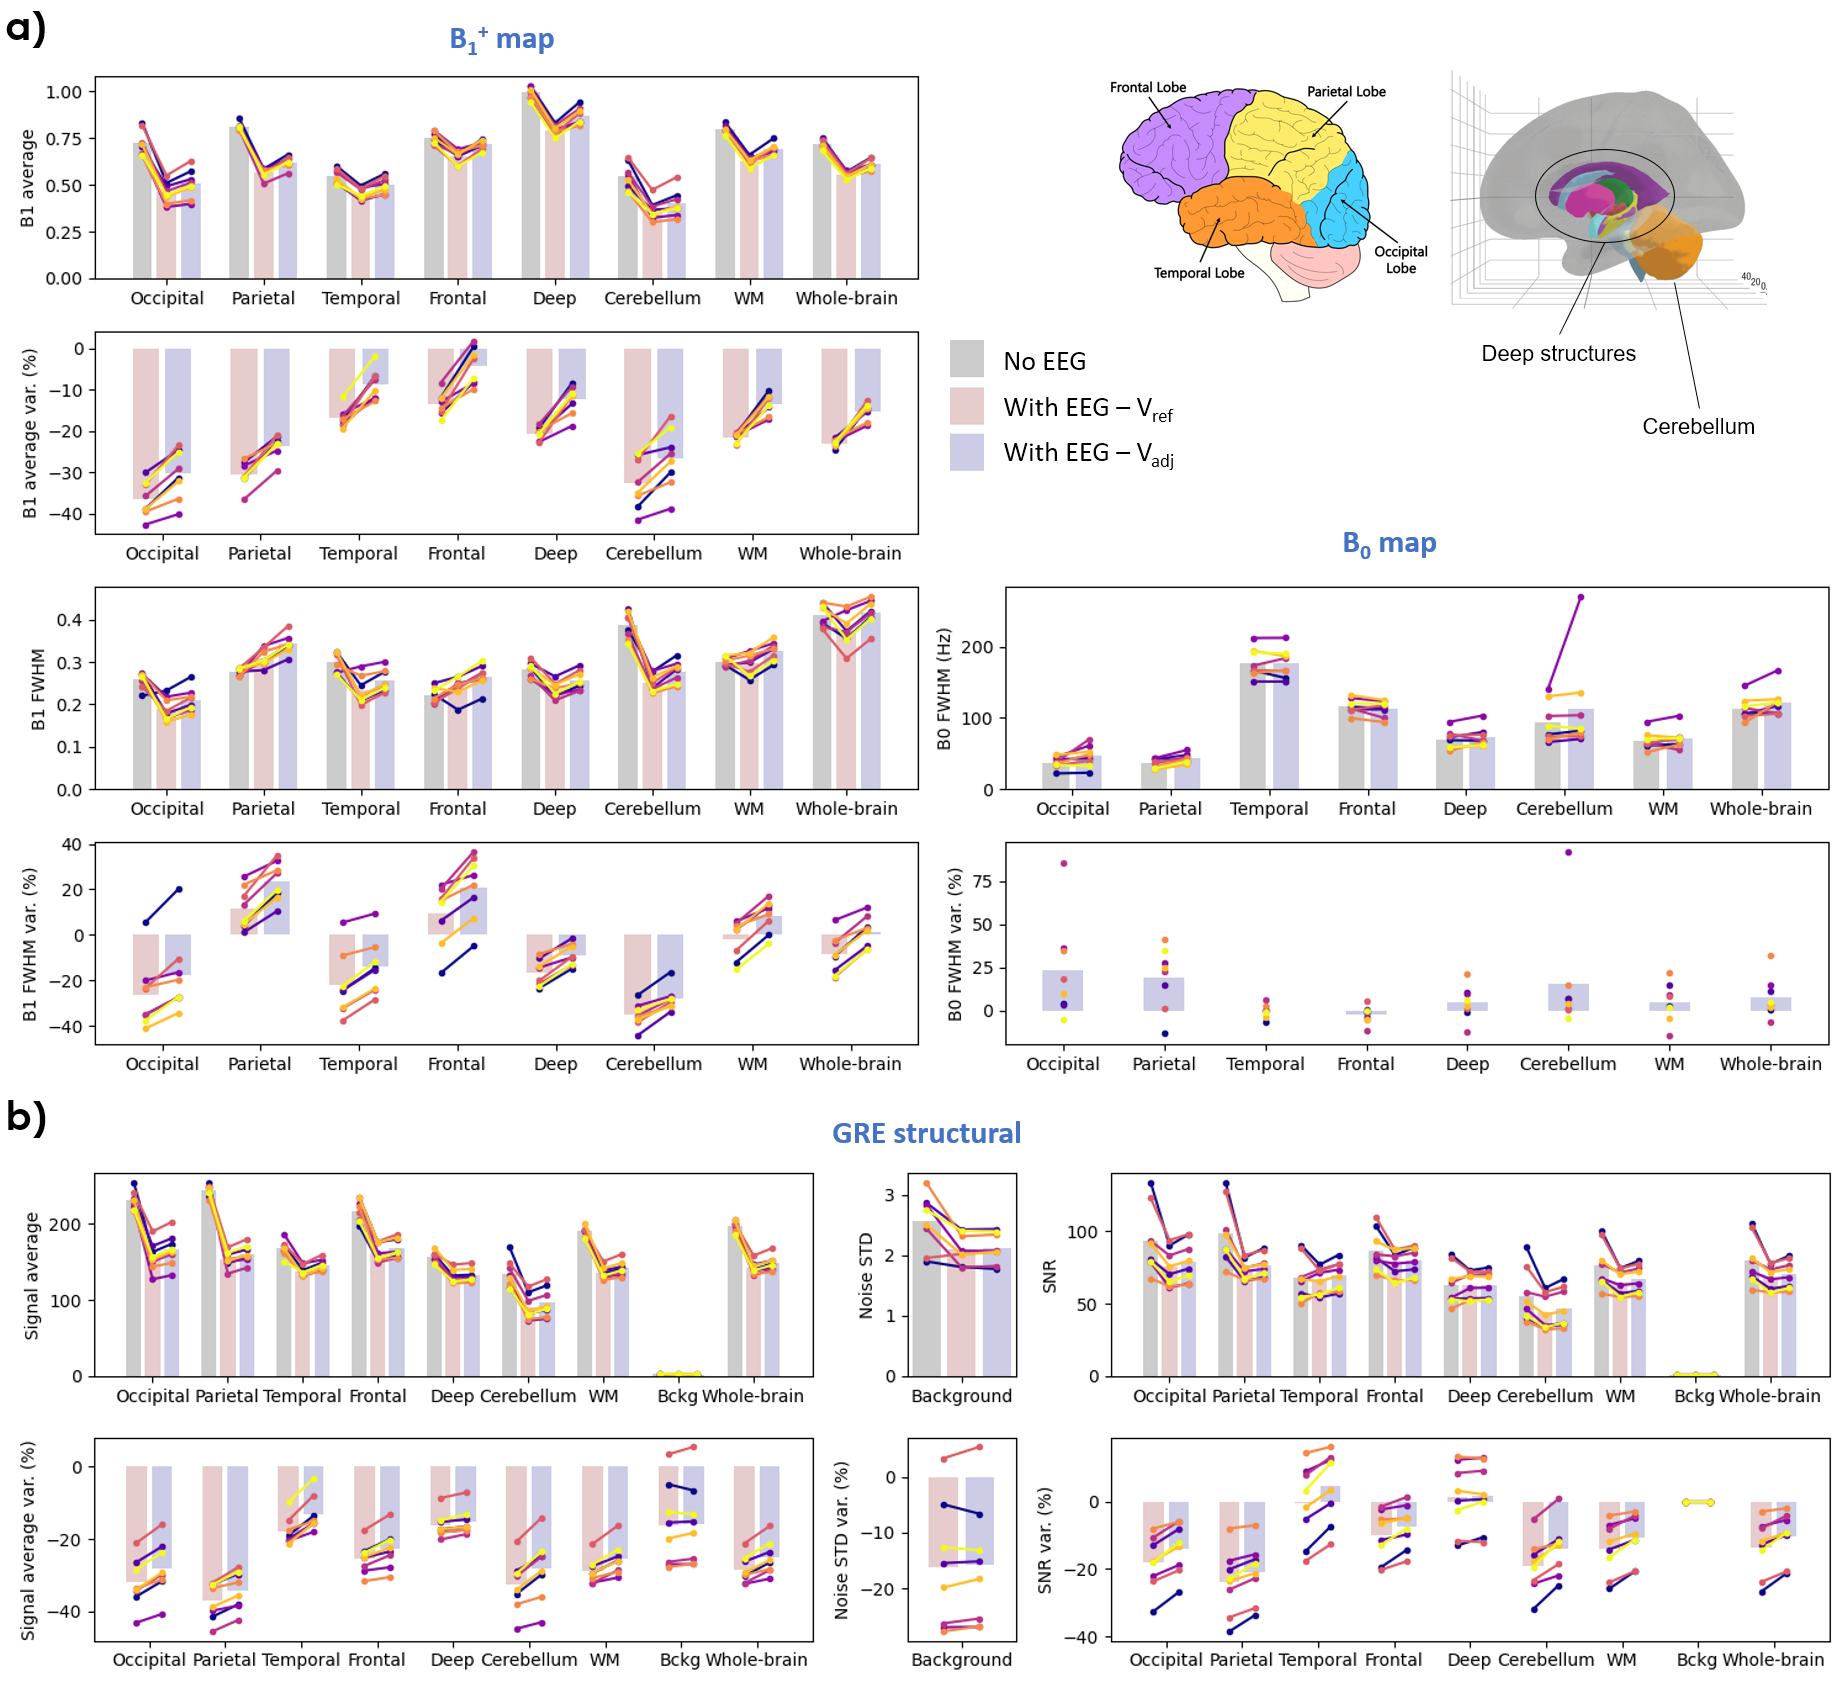
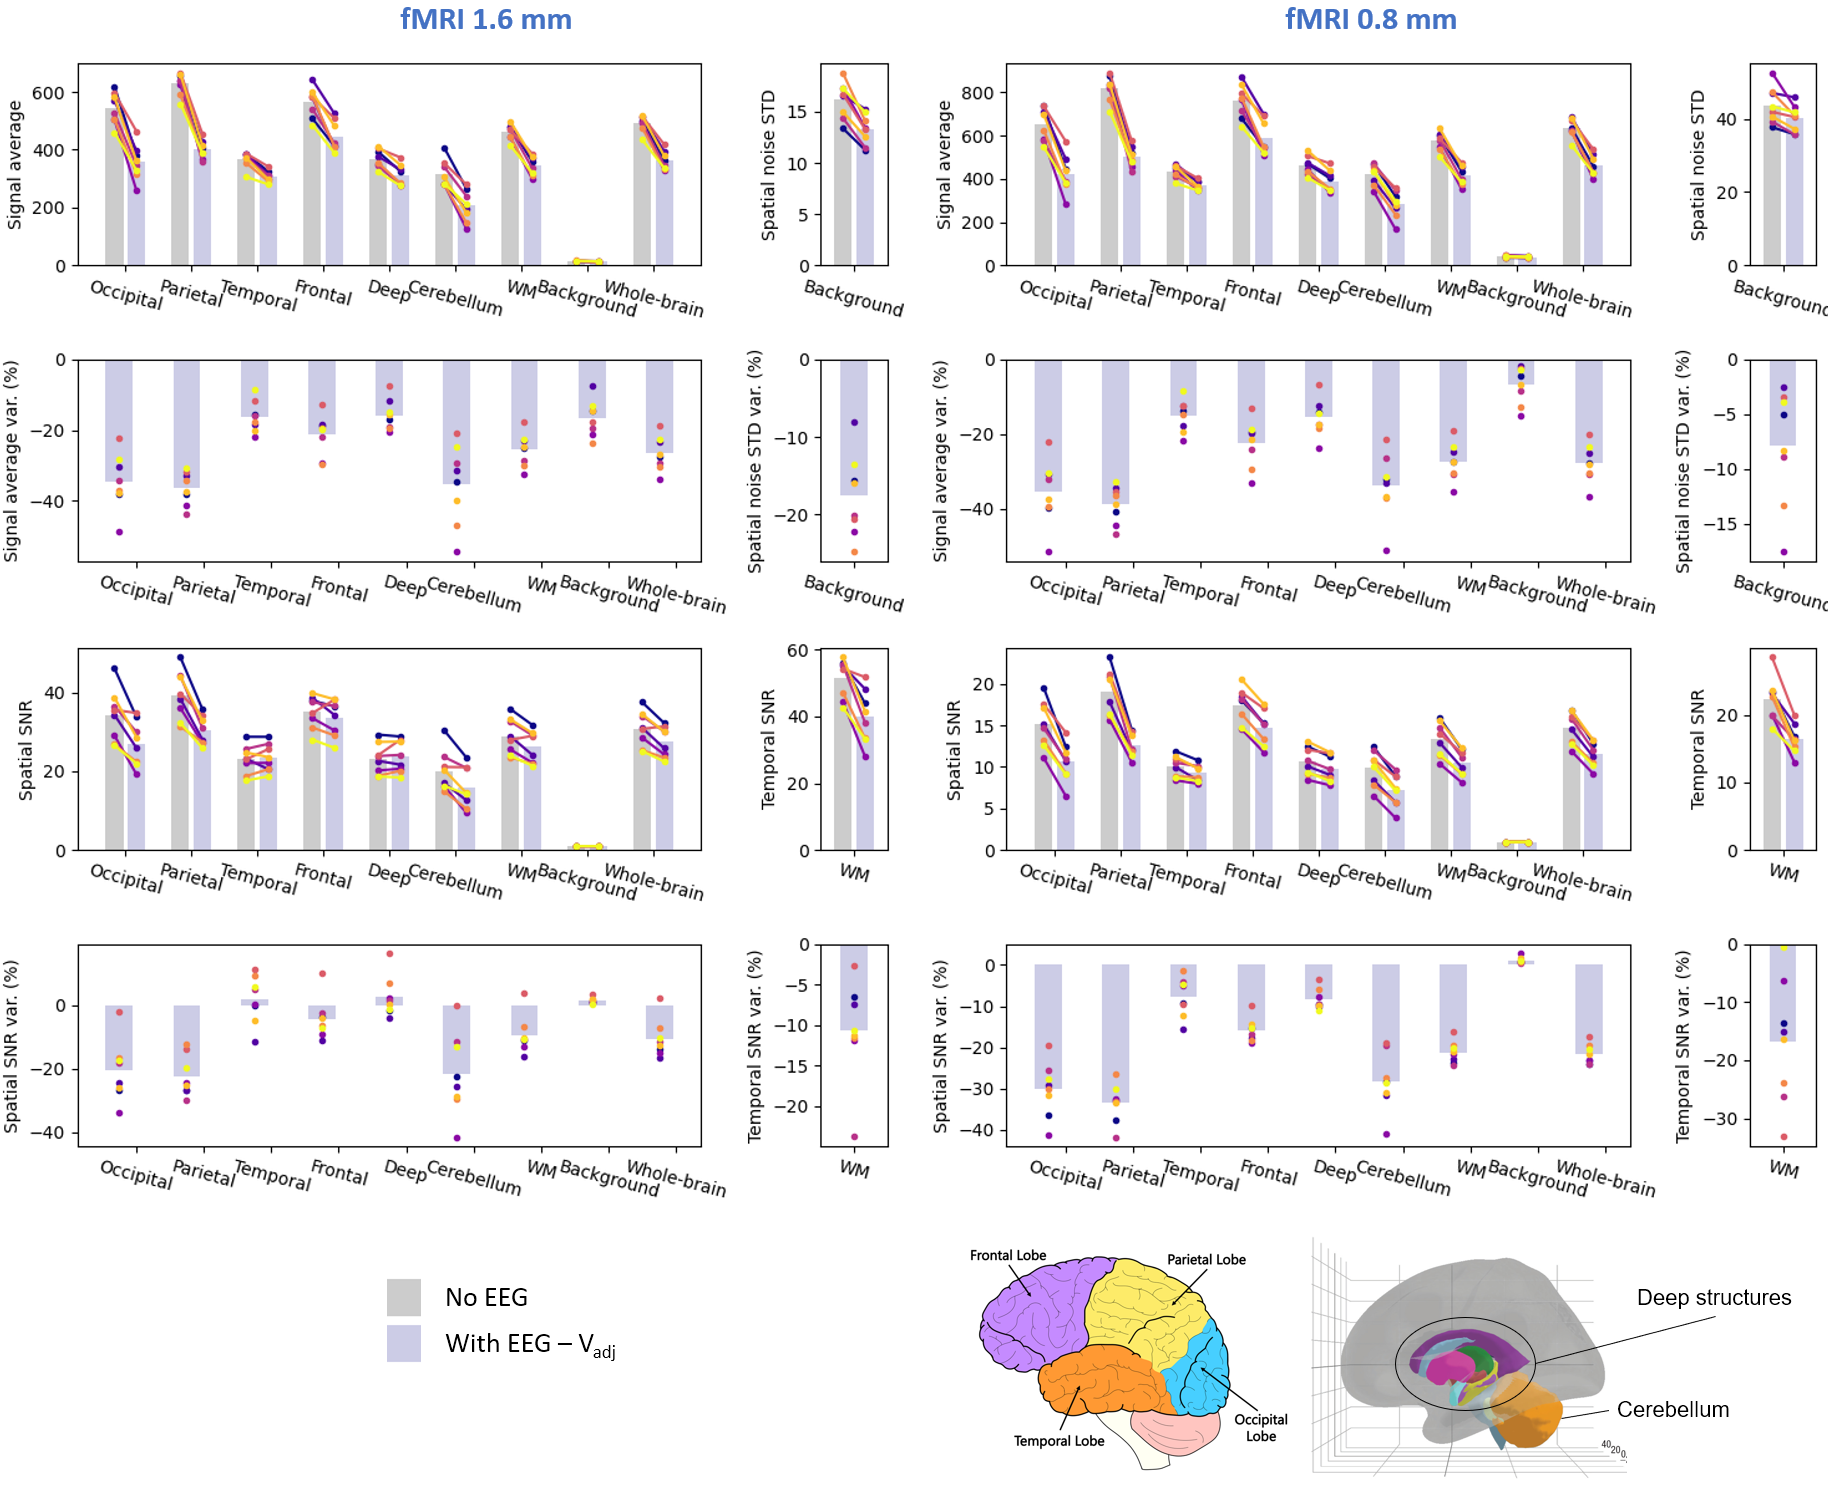
Safety: All sessions were completed without adverse events. All sequences had a B1+rms below 1 µT. Non-negligible heating was only identified on the EEG amplifiers (up to 0.32 °C/min during fMRI). On average, the scanner calibrations proposed a transmit voltage of 235V without EEG and 260V with EEG, increasing the SAR from 2.8 to 3.4W/Kg in fMRI.MRI quality: As in previous observations for a similar coil7, the EEG induced relatively distributed losses in MRI quality, without focal signal drops (Figure 1b). The mapping data showed, on average at whole-brain, minor changes in B0 or B1+ heterogeneity, but clear losses of ~15% in average B1+ – mitigated only partially by the transmit adjustment (Figure 2a). The GRE showed a reduction in both signal average and background STD, resulting in an SNR loss of only ~10% (Figure 2b). The 1.6mm fMRI data showed similar competing effects, resulting in losses of ~11% for spatial and temporal SNR; the 0.8mm was more strongly affected, with ~21% for spatial and ~17% for temporal SNR (Figure 3). The functional sensitivity measures, however, did not show any systematic alterations (Figure 4).
EEG quality: The EEG recordings showed negligible amplitude saturation for the sequences tested. The artifact corrections proved successful in bringing the EEG spectral content to a level and morphology comparable to recordings outside the scanner (Figure 5).
Conclusion
Leveraging recent methodological improvements, EEG-fMRI at 7T can be reliably performed in humans with state-of-the-art RF arrays, allowing fMRI protocols down to sub-mm resolution, with moderate quality losses, and potentially negligible impact on BOLD functional sensitivity.Acknowledgements
This work was funded by the Swiss National Science Foundation through grants 185909, 192749 and 209470, and supported by CSEM – Swiss Center for Electronics and Microtechnology, by the Translational Imaging Center (TIC) of the Swiss Institute for Translational and Entrepreneurial Medicine (SITEM), and by the CIBM Center for Biomedical Imaging, Switzerland.References
1. J. R. Polimeni, B. Fischl, D. N. Greve, and L. L. Wald, “Laminar analysis of 7T BOLD using an imposed spatial activation pattern in human V1,” NeuroImage, vol. 52, no. 4, pp. 1334–1346, Oct. 2010, doi: 10.1016/j.neuroimage.2010.05.005.
2. J. Jorge, W. van der Zwaag, and P. Figueiredo, “EEG-fMRI integration for the study of human brain function,” Neuroimage, vol. 102 Pt 1, pp. 24–34, Nov. 2014, doi: 10.1016/j.neuroimage.2013.05.114.
3. L. Huber et al., “Layer-dependent functional connectivity methods,” Progress in Neurobiology, vol. 207, p. 101835, Dec. 2021, doi: 10.1016/j.pneurobio.2020.101835.
4. T. Warbrick, “Simultaneous EEG-fMRI: What Have We Learned and What Does the Future Hold?,” Sensors, vol. 22, no. 6, p. 2262, Mar. 2022, doi: 10.3390/s22062262.
5. J. Jorge et al., “Simultaneous EEG-fMRI at ultra-high field: artifact prevention and safety assessment,” Neuroimage, vol. 105, pp. 132–144, Jan. 2015, doi: 10.1016/j.neuroimage.2014.10.055.
6. J. Jorge, F. Grouiller, R. Gruetter, W. van der Zwaag, and P. Figueiredo, “Towards high-quality simultaneous EEG-fMRI at 7 T: Detection and reduction of EEG artifacts due to head motion,” Neuroimage, vol. 120, pp. 143–153, Oct. 2015, doi: 10.1016/j.neuroimage.2015.07.020.
7. M. C. Meyer, R. Scheeringa, A. G. Webb, N. Petridou, O. Kraff, and D. G. Norris, “Adapted cabling of an EEG cap improves simultaneous measurement of EEG and fMRI at 7T,” Journal of Neuroscience Methods, vol. 331, p. 108518, Feb. 2020, doi: 10.1016/j.jneumeth.2019.108518.
8. B. T. Thomas Yeo et al., “The organization of the human cerebral cortex estimated by intrinsic functional connectivity,” Journal of Neurophysiology, vol. 106, no. 3, pp. 1125–1165, Sep. 2011, doi: 10.1152/jn.00338.2011.
9. Q.-H. Zou et al., “An improved approach to detection of amplitude of low-frequency fluctuation (ALFF) for resting-state fMRI: Fractional ALFF,” Journal of Neuroscience Methods, vol. 172, no. 1, pp. 137–141, Jul. 2008, doi: 10.1016/j.jneumeth.2008.04.012.
10. L. Li, H. Dai, J. Ke, C. Shi, N. Jiang, and C.-M. Yang, “Resting-State Functional MRI Study: Connection Strength of Brain Networks in DR Patients,” NDT, vol. Volume 15, pp. 3359–3366, Dec. 2019, doi: 10.2147/NDT.S227468.
11. R. K. Niazy, C. F. Beckmann, G. D. Iannetti, J. M. Brady, and S. M. Smith, “Removal of FMRI environment artifacts from EEG data using optimal basis sets,” NeuroImage, vol. 28, no. 3, pp. 720–737, Nov. 2005, doi: 10.1016/j.neuroimage.2005.06.067.
12. J. Jorge, C. Bouloc, L. Bréchet, C. M. Michel, and R. Gruetter, “Investigating the variability of cardiac pulse artifacts across heartbeats in simultaneous EEG-fMRI recordings: A 7T study,” NeuroImage, vol. 191, pp. 21–35, May 2019, doi: 10.1016/j.neuroimage.2019.02.021.
Figures