1317
Development of a musculoskeletal relaxometry phantom for T1, T2, and T1rho measurements1Program of Advanced Musculoskeletal Imaging (PAMI), Cleveland Clinic, Cleveland, OH, United States, 2Department of Electrical, Computer, and Systems Engineering, Cleveland ClinicCase Western Reserve University, Cleveland, OH, United States, 3National Institute of Standards and Technology (NIST), Boulder, CO, United States, 4Calimetrix, Madison, WI, United States
Synopsis
Keywords: Phantoms, Phantoms
Motivation: There is not a commercially available musculoskeletal (MSK) relaxometry phantom.
Goal(s): Develop a dedicated MSK relaxometry phantom for T1, T2, and T1rho measurement quality assurance.
Approach: A cylindrical phantom with 12 vials containing modulated T1 and T2 samples was created, with an MR-visible thermometer for temperature tracking. Phantom stands were used for consistent positioning. MRI/NMR measurements were collected for longitudinal stability and temperature dependence.
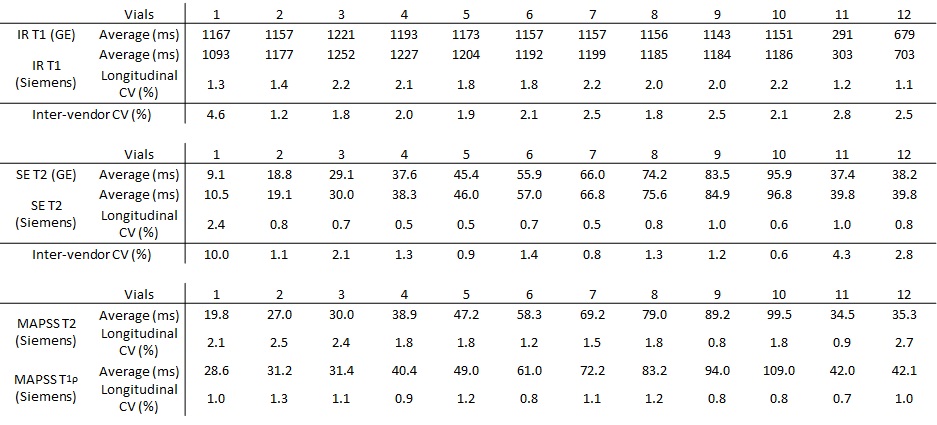
Results: MRI measurements were in good agreement between two vendors with CVs<3% and demonstrated longitudinal stability with CVs<3% over a 3-month period. NMR measurements showed clear changes in T1, T2, and T1rho with changing temperature.
Impact: A stable MSK relaxometry phantom prototype was successfully developed and characterized, including changes with temperature. With harmonized measurement protocols, this phantom will facilitate the use of quantitative relaxometry MRI in large-scale multi-site multi-vendor trials.
Introduction
Quantitative MRI (qMRI) relaxometry is widely investigated to probe tissue compositional changes at early stages of diseases, which are difficult to capture with conventional morphological imaging. Particularly, T1, T2, and T1rho have been studied to detect early cartilage degeneration in osteoarthritis.1,2 Due to its quantitative nature, standardization of measurement and quality assurance of qMRI are crucial when interpreting findings from patients, especially in multi-site and multi-vendor trials. Quantitative phantoms are essential to this process.3 However, no dedicated musculoskeletal (MSK) relaxometry phantoms are commercially available.The goal of the study was to develop a dedicated MSK relaxometry phantom that can be used for quality assurance of articular cartilage T1, T2 and T1rho measures, with a focus on the knee joint.
Methods
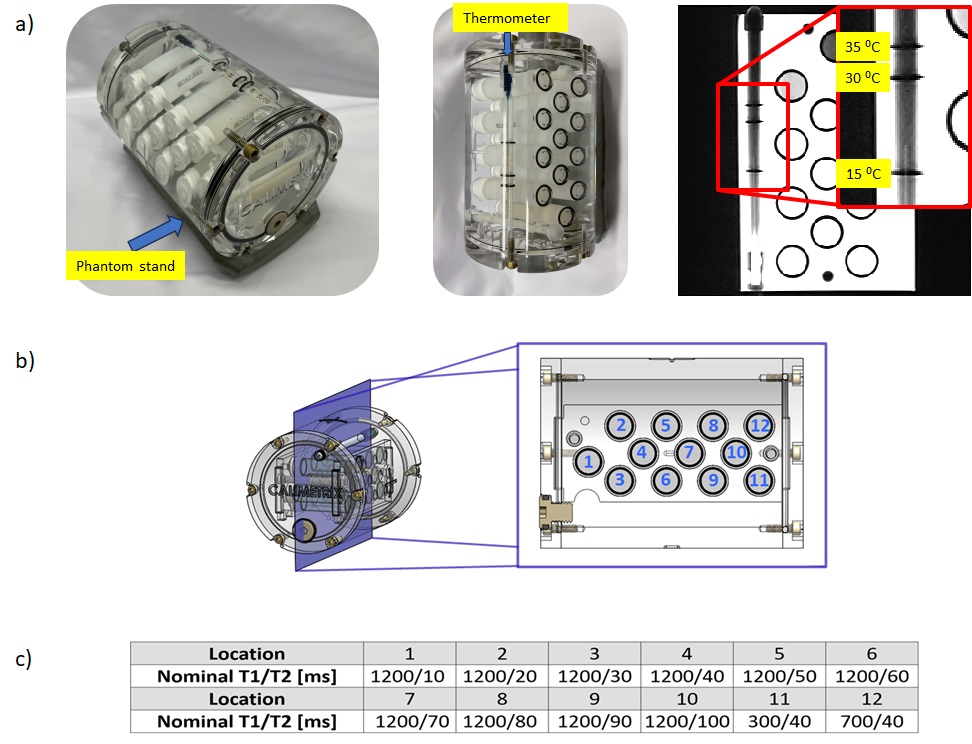
MSK Relaxometry Phantom DesignAn MSK relaxometry phantom prototype was designed to have the following attributes: 1) materials that mimic T1, T2, and T1rho relaxation times characteristic of articular cartilage; 2) compatibility with commonly used knee coils; and 3) the ability to measure temperature for possible temperature dependency of phantom material. The Special-Order MSK Relaxometry Phantom (Calimetrix, Madison, WI) is composed of a cylindrical phantom housing filled with a doped water solution. It contains 12 vials filled with gels that simultaneously modulate T1 and T2 to mimic knee cartilage (Figure 1). A NIST-traceable analog MR-visible thermometer with marks on 15, 30, and 35⁰C is embedded within the phantom to allow precise temperature monitoring from both visual observation of the thermometer through the phantom wall and by MR images. Finally, four custom external positioners (“stands”) for commonly used MRI knee coils are provided to ensure repeatable phantom positioning parallel to the patient table (QED 1Tx/28Rx or 15Rx knee coils, Philips 1Tx/8Rx or 16Rx knee coils).
MRI T1, T2, and T1rho Measurement
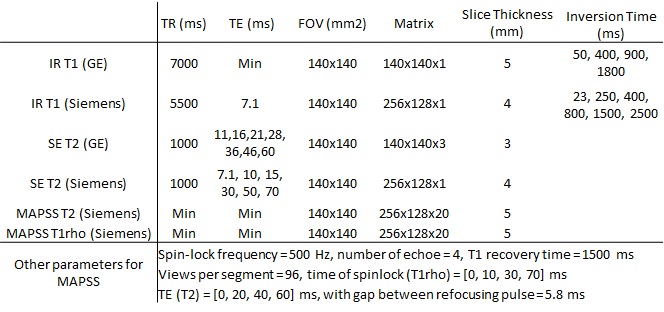
MRI measurements were performed using two 3T scanners (Siemens Prisma with QED 1Tx/15Rx knee coil and GE Healthcare SIGNA Premier with AIR Anterior array coil) for inter-vendor comparison using coefficients-of-variation (CV). T1 was measured using 2D inversion-recovery spin-echo (IR SE) sequence. T2 was measured using spin-echo (SE) and MLEV-16 (phase modulated CPMG) prepared MAPSS sequence.4,5 T1rho was measured using a spin-lock-prepared MAPSS sequence4,5 (Table 1). Using the Siemens scanner, six measurements over three months were compared for longitudinal CV.
NMR Measurement
NMR spectroscopy measures were performed at NIST using a 3T system (Tecmag Redstone with Doty Scientific 5mm probe) on single material sample tubes. IR T1s with composite inversion pulses were measured with 20 logarithmically-spaced inversion times. T2s were measured using three sequences: CPMG sequences with echo timings of 2ms and 5.8ms, respectively, and a spin-echo sequence. All T2 sequences contained 20 linearly-spaced echo times. T1rho sequences used a spin-lock-prepared sequence with 20 times of spinlock. Each sequence was adjusted to ensure full coverage of the relaxation range over the timing array. All measurements were allowed for sufficient recovery (TR>5T1). T1 and T2s were measured at six degrees ranging 16°C-26°C, with an increment of 2°C.
Results
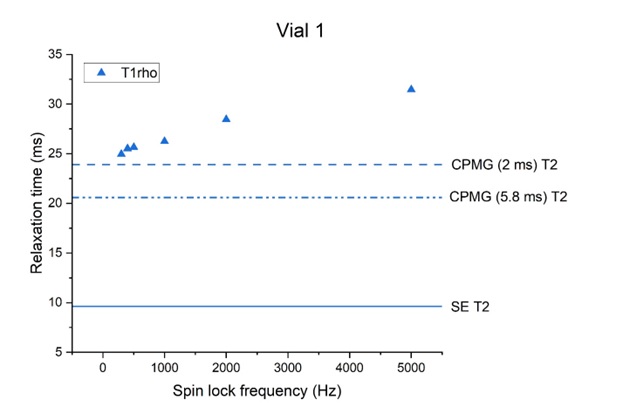
IR T1 and SE T2 demonstrated good agreement between the two vendors, achieving CVs<3% in all vials except for vial 1, which had the shortest T2 (Table 2). SE T2, MAPSS T2, and MAPSS T1rho showed similar values in all vials except for vials 1 and 2. NMR measurement for vial 1 confirmed this trend and showed T1rho dispersion (Figure 2).Longitudinal measurements of all T1 and T2s had CVs<3% over the 3-month period (Table 2).
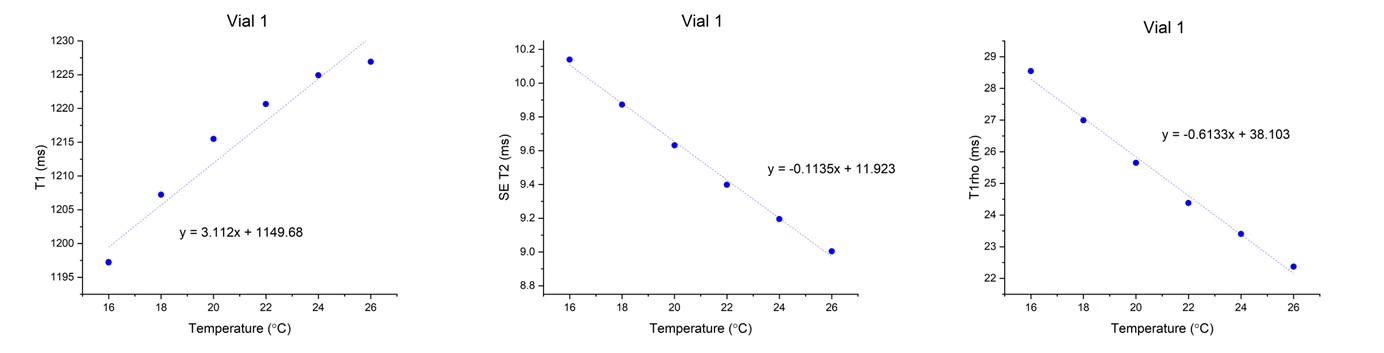
In vial 1, NMR-measured T1 increased with increasing temperature, while NMR-measured T2 and T1rho decreased with increasing temperature (Figure 3).
Discussion
We developed a phantom that can be used for MSK applications with T1, T2, and T1rho in the range of knee cartilage. MRI measurements using IR T1 and SE T2 were reproducible between the two vendors. Such agreement is essential to conduct a multi-vendor quantitative relaxometry study. Vial 1 had discrepancy between T2s with different spacing between refocusing pulses, verified by the NMR measurement. This finding shows the necessity of reporting specific sequence parameters when reporting T2. NMR measurements also verified the T1 and T2 dependency on temperature, and these could be used to correct phantom measurements conducted on MRI systems with different ambient temperatures. The phantom measurements were stable over 3-months. These measurements will be continuously collected for long-term stability evaluation. NIST NMR measurements will be performed on all vials to provide reference values.Conclusion
A stable MSK relaxometry phantom prototype was successfully developed and characterized, including changes with temperature. With harmonized measurement protocols, this phantom will facilitate the use of quantitative relaxometry MRI in large-scale multi-site, multi-vendor trials.Acknowledgements
The study was supported by NIH/NIAMS R01AR077452.References
1. de Mello, R., Ma, Y., Ji, Y., Du, J., & Chang, E. Y. (2019). Quantitative MRI MSK techniques: An update. AJR. American journal of roentgenology, 213(3), 524.
2. Eck, B. L., Yang, M., Elias, J. J., et al. (2023). Quantitative MRI for evaluation of musculoskeletal disease: cartilage and muscle composition, joint inflammation, and biomechanics in osteoarthritis. Investigative radiology, 58(1), 60-75.
3. Keenan, K. E., Ainslie, M., Barker, A. J., et al. (2018). Quantitative magnetic resonance imaging phantoms: a review and the need for a system phantom. Magnetic resonance in medicine, 79(1), 48-61.
4. Li, X., Pedoia, V., Kumar, D., et al. (2015). Cartilage T1ρ and T2 relaxation times: longitudinal reproducibility and variations using different coils, MR systems and sites. Osteoarthritis and cartilage, 23(12), 2214-2223.
5. Kim, J., Mamoto, K., Lartey, R., et al. (2020). Multi-vendor multi-site T1ρ and T2 quantification of knee cartilage. Osteoarthritis and cartilage, 28(12), 1539-1550.
Figures