1316
Contrast-free Blood Volume, Microvascular Properties and Relaxometry mapping using bSSFP MR Fingerprinting1Univ. Grenoble Alpes, INSERM U1216, Grenoble Institut Neurosciences, GIN, Grenoble, France, 2Univ. Grenoble Alpes, INSERM US17, CNRS, UAR 3552, CHU Grenoble Alpes, IRMaGe, Grenoble, France, 3Univ. Grenoble Alpes, Service de Neurologie, CHU Grenoble Alpes, Grenoble, France, 4Philips France Commercial, Suresnes, France, 5Philips Research Hamburg, Roentgenstrasse 24, Hamburg, Germany
Synopsis
Keywords: Novel Contrast Mechanisms, Perfusion, blood volume, oxygenation, relaxometry
Motivation: Most MR methods for quantifying microvascular properties involve the injection of exogenous contrast agents (CA).
Goal(s): We propose an innovative MRI method that simultaneously maps the deoxygenated cerebral blood volume (CBV), microvascular geometry (averaged vessel radius), and relaxometry (T1&T2) without CA injection.
Approach: Acquisitions are made using a multi-echo, phase-cycled, bSSFP-sequence acquired in transient and pseudo-steady-state regimes. Reconstruction of the maps is made under the MRFingerprinting framework using realistic 3D microvessel representations. Magnetic field distributions (B1&B0) are also taken into account.
Results: Preliminary results on five healthy volunteers are in line with previous measurements made with MRF and PWI with gadolinium injection.
Impact: We propose a contrast-free quantification technique of microvascular properties and relaxation times. It could be useful for functional experiments as well as clinical investigations of several cerebrovascular pathologies including stroke and cancer.
Introduction
Most current MR methods for quantifying microvascular properties, such as cerebral blood volume (CBV), involve the injection of exogenous contrast agents (CA). In a Dynamic Susceptibility Contrast (DSC) experiment, magnetic field perturbations caused by the paramagnetic agent are analyzed through T2* effects. Without CA, the BOLD effect also creates field perturbations but it is extremely difficult to separate the contributions of CBV and blood oxygenation in the exponential MR signal decay1. On the other hand, bSSFP-type sequences can be very sensitive to frequency (δf) distributions inside the voxels2. Yet, they are also affected by other factors (T1-T2-B1-FA-TR, etc.), which makes them difficult to apply2. Here, we used the MR Fingerprinting (MRF) framework3 to analyze the complex signals of multi-echo phase-cycled bSSFP sequences. Using MRF dictionaries built from 3D realistic vascular networks, we simultaneously derived maps of CBV, average vessel radius (R), T1 and T2 in healthy volunteers without the need for CA injection.Materials and Methods
MRF dictionaries: First, a base dictionary with 4 dimensions was simulated using the Bloch matrix formulation and unique values of δf, T1, T2, and B1. Then, simulations of the BOLD effect in 3D realistic vascular networks4-5 were performed to provide distributions of δf values inside each voxel (Figure 1.a). These δf distributions depend on the CBV and R values of the vascular network and on the prescribed blood oxygenation (SO2) values. Finally, multiple signals from the base dictionary were combined according to the δf distributions to produce a 7-dimensional dictionary (δf-T1-T2-B1-SO2-CBV-R). In our study, the base dictionary contained 1,280 million entries. 2700 voxels obtained from 3D microscopy imaging were used to produce a 7-dimensional dictionary with 3,456 billion entries after the convolution by the distributions.Acquisitions: In vivo acquisitions were realized on five healthy volunteers (26.2±2.6yo, 3 females) with a Philips 3T Achieva dStream MRI at the IRMaGe facility (MAP-IRMaGe protocol, NCT05036629). The proposed MRF sequence was based on an IR-bSSFP acquisition. 260 repetitions were used (TR=21ms, TE=4-10-16ms) with Flip Angle (FA) linearly increasing from 7° to 70° 6 and a quadratic phase cycle of 10°. For our proof of principle study, the acquisitions were performed using Cartesian sampling: matrix size=128x128x5; voxel size=1.56x1.56x3.00mm^3; CS=3; duration=4min/slice. A DREAM7 sequence was acquired to obtain a reference B1 map.
Reconstruction: A standard dictionary-matching method was used with restriction of the searched space with the B1 map, reducing computation time and cost as well as improving the estimations. A 1.2mm FWHM Gaussian filter was used for smoothing maps.
Results
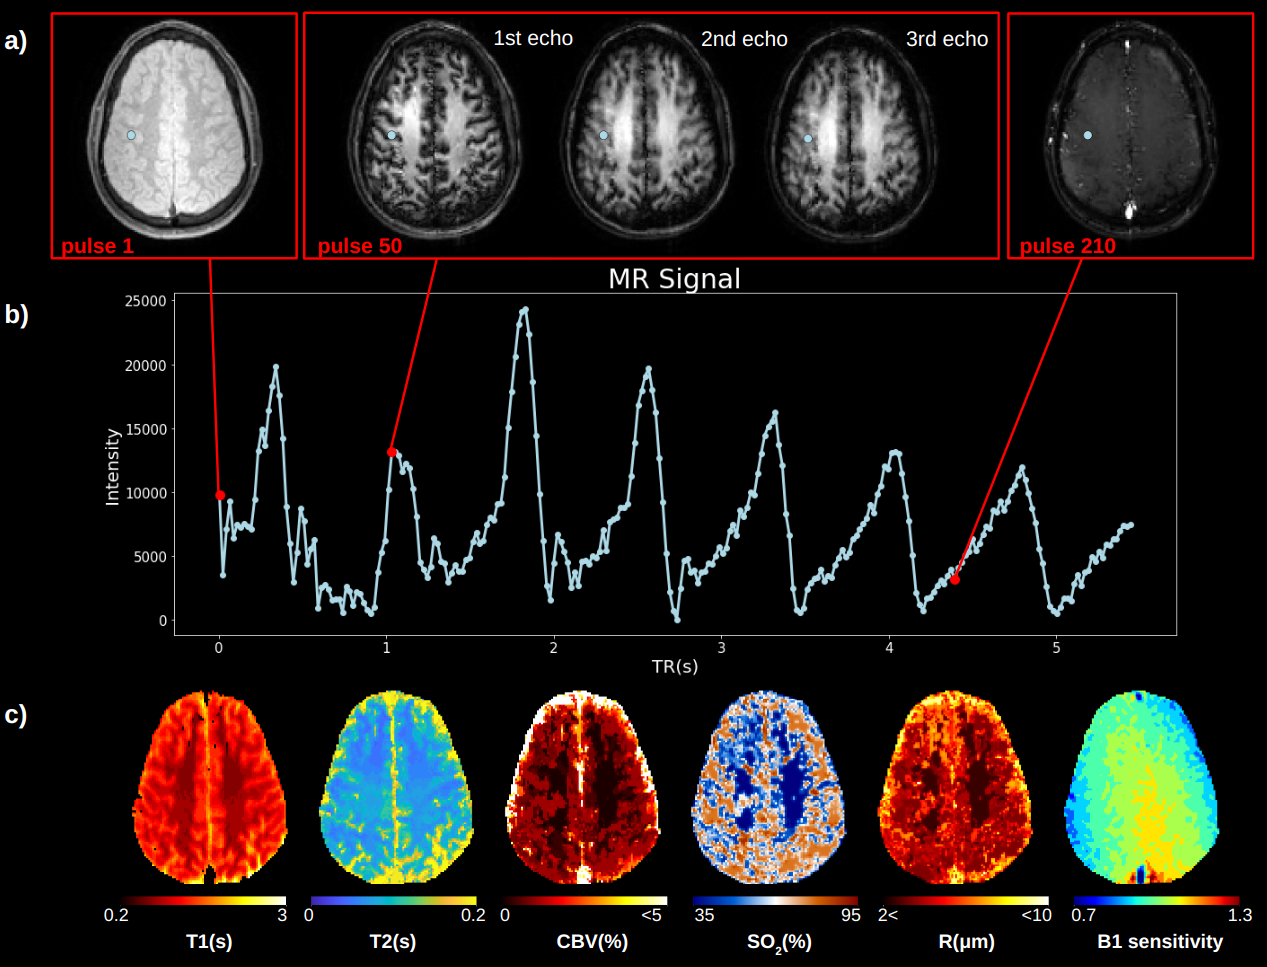
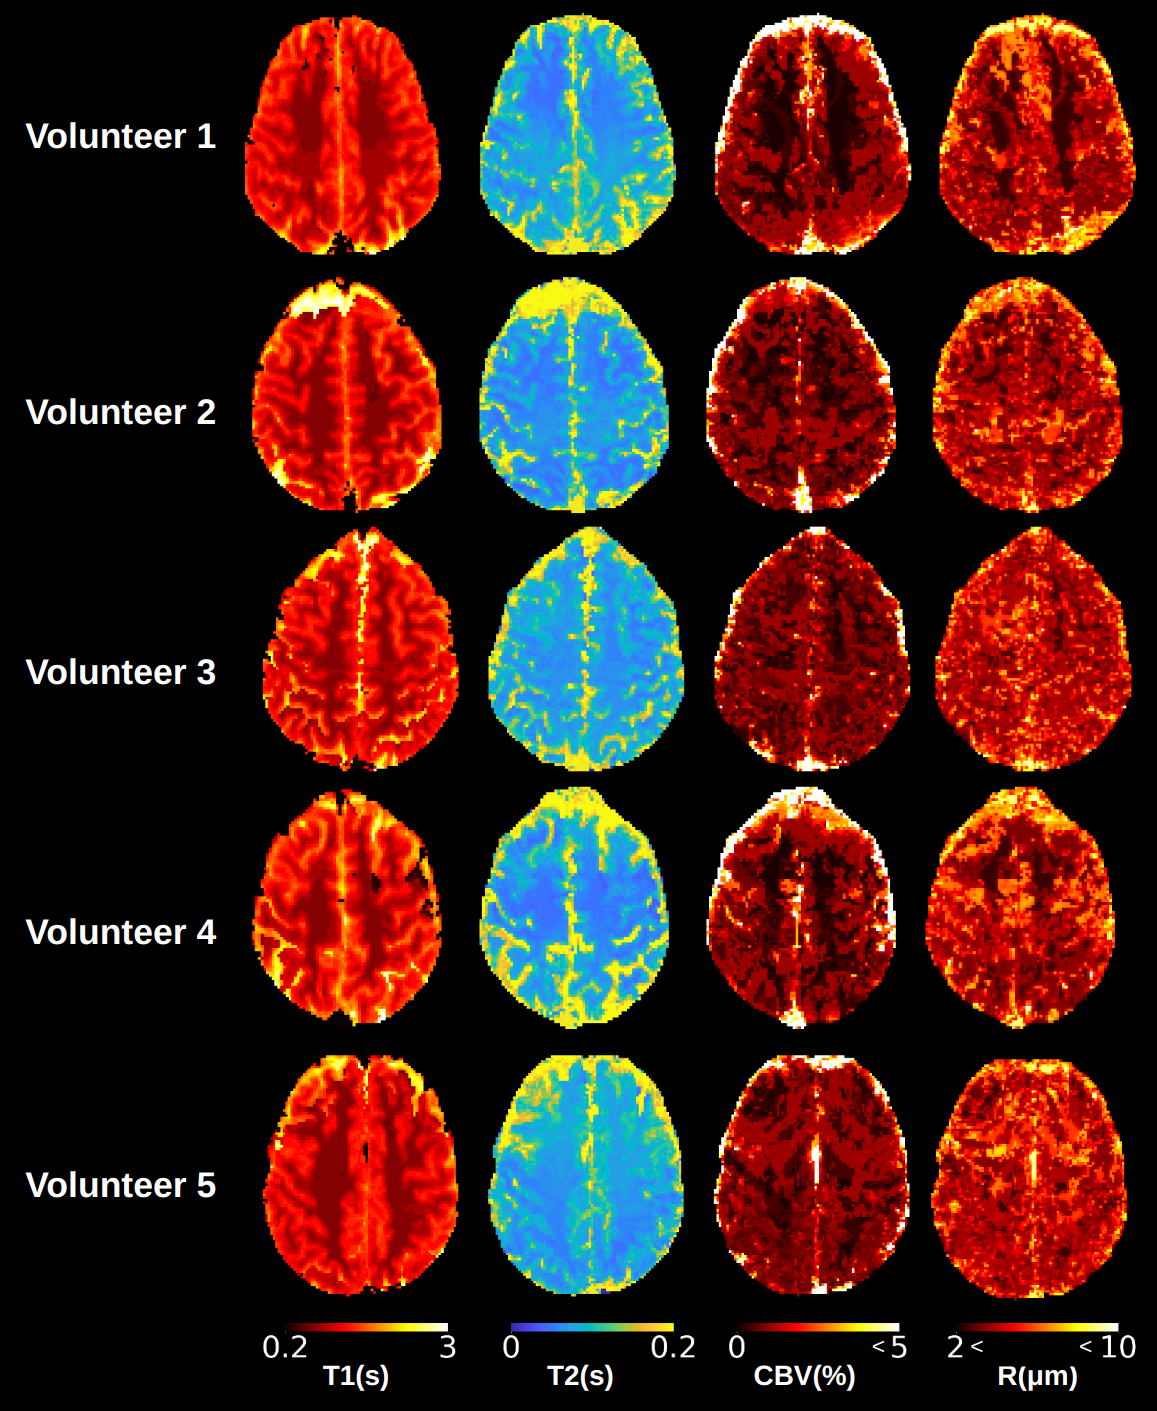
Simulations of MR signals are shown in Figure 1.b.c to illustrate the potential of the bSSFP approach for microvascular imaging. Figure 2 shows signal entries from the MRF dictionary to illustrate the sensitivity to each considered parameter, B1 excepted. Changes in all parameters except SO2 induce large signal variations. A signal entry is also shown in Figure 3. It highlights the importance of phase cycling to avoid banding artifacts in the reconstructed maps. In-vivo results from one volunteer are shown in Figure 4. Signals from acquired voxels have similar trends as in Figure 3, and corresponding raw images show large contrast variations between repetitions and echoes. Estimated T1 and T2 maps are in line with previous MRF estimates3. Most interestingly, the CBV and R maps are different from the relaxometry maps, with high values where large vessels are expected. The oxygenation map is noisy however and exhibits a gray/white matter contrast. Maps from all 5 volunteers are presented in Figure 5. Quantitative estimates averaged over the volunteers were, for WM and GM respectively: T1=[853.5±103.3;1396.8±126.7]ms, T2=[74.0±3.5;119.4±15.2]ms, CBV=[1.0±0.2, 1.8±0.5]%, and R=[4.2±0.2,4.9±0.2]μm. Note that the CBV values are lower than standard DSC estimates as only deoxygenated blood is measured using our approach.Discussion
Our first in vivo results are encouraging and several improvements can be foreseen. First, we could increase the sensitivity of the sequence by further tuning the FA and RF trains. This could also lead to more accurate blood oxygenation measurements. Second, numerical simulations could be improved by considering different vascular structures in the white matter region. Finally, several MRF solutions (3D spiral, subspace recon, etc.) could be used to accelerate the acquisitions.Conclusion
After validation against standard DSC measurements, the method could be useful for functional experiments as well as for clinical investigations of several pathologies.Acknowledgements
Project supported by ANR MRFUSE [ANR-20-CE19-0030]
We thank the MRI facility IRMaGe partly funded by the French program “Investissement d’avenir” run by the French National Research Agency, grant “Infrastructure d’avenir en Biologie et Santé”. [ANR-11-INBS-006]
References
1. Christen et al, “Tissue oxygen saturation mapping with magnetic resonance imaging“. J Cereb Blood Flow Metab. 2014 Sep;34(9):1550-7. doi: 10.1038/jcbfm.2014.116. Epub 2014 Jul 9. PMID: 25005878; PMCID: PMC4158672.
2. Bieri & Scheffler, “Fundamentals of balanced steady-state free precession MRI”. MRI. J Magn Reson Imaging. 2013 Jul;38(1):2-11. doi: 10.1002/jmri.24163. Epub 2013 Apr 30. PMID: 23633246.
3. Ma et al,” Magnetic Resonance Fingerprinting”. Nature. 2013 Mar 14;495(7440):187-92. doi: 10.1038/nature11971. PMID: 23486058; PMCID: PMC3602925.
4. Christen et al., "MR vascular fingerprinting: A new approach to compute cerebral blood volume, mean vessel radius, and oxygenation maps in the human brain". Neuroimage. 2014 Apr 1;89:262-70. doi: 10.1016/j.neuroimage.2013.11.052. Epub 2013 Dec 7. PMID: 24321559; PMCID: PMC3940168.
5. Delphin et al., “Enhancing MR vascular Fingerprinting through realistic microvascular geometries”. Preprint, arXiv:2305.17092.
6. Gomez et al., “Designing contrasts for rapid, simultaneous parameter quantification and flow visualization with quantitative transient-state imaging”. Sci Rep 9, 8468 (2019). https://doi.org/10.1038/s41598-019-44832-w.
7. Nehrke & Börnert, “DREAM—a novel approach for robust, ultrafast, multislice B1 mapping”. Magn Reson Med. 2012 Nov;68(5):1517-26. doi: 10.1002/mrm.24158. Epub 2012 Jan 17. PMID: 22252850.
Figures
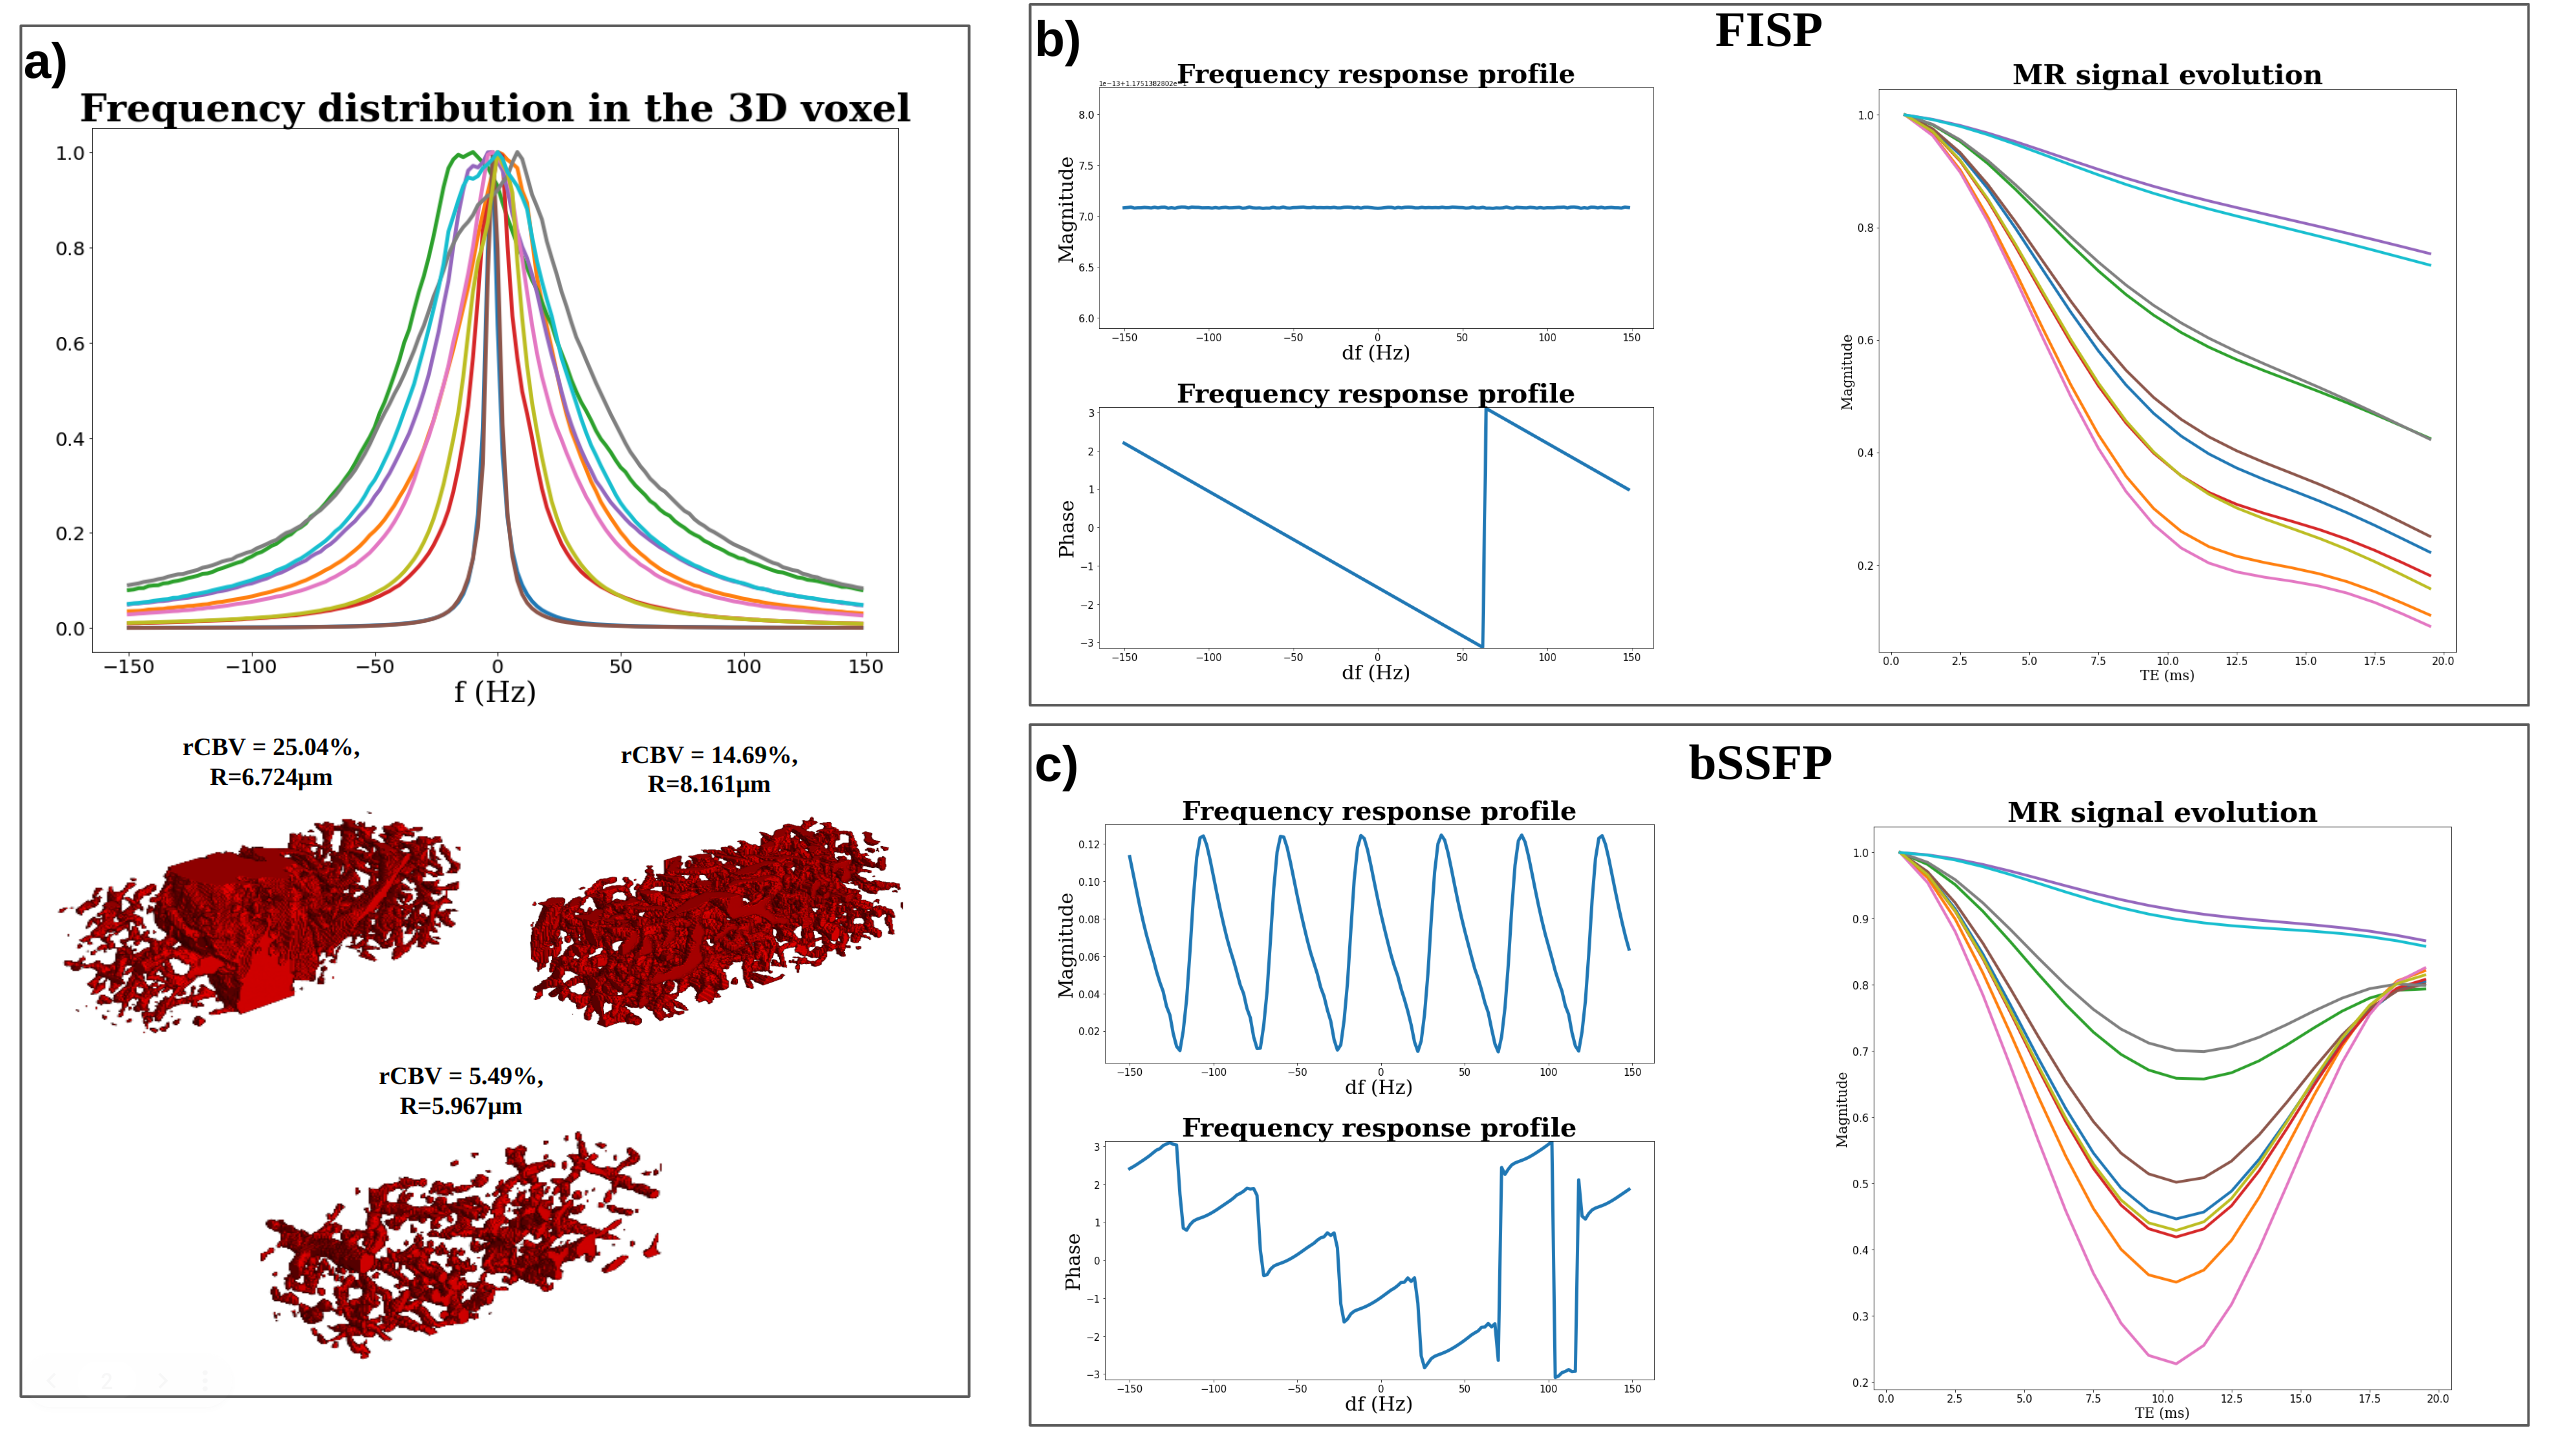
Figure 1: a) Example of frequency distributions d/t BOLD effect associated with different microvascular parameters (top). Example of 3 voxels from micro-vascular networks and their R and CBV values (bottom). b)c) Comparison of the response profiles of FISP (b) and bSSFP (c) in the transient state as a function of δf. MR signals associated with the previous frequency distributions (T1=1300ms, T2=110ms, B1=1, δf=0Hz), are shown for both sequences. Note that bSSFP signal time evolutions are not necessarily monotonic due to the variability of the magnitude frequency response profile.
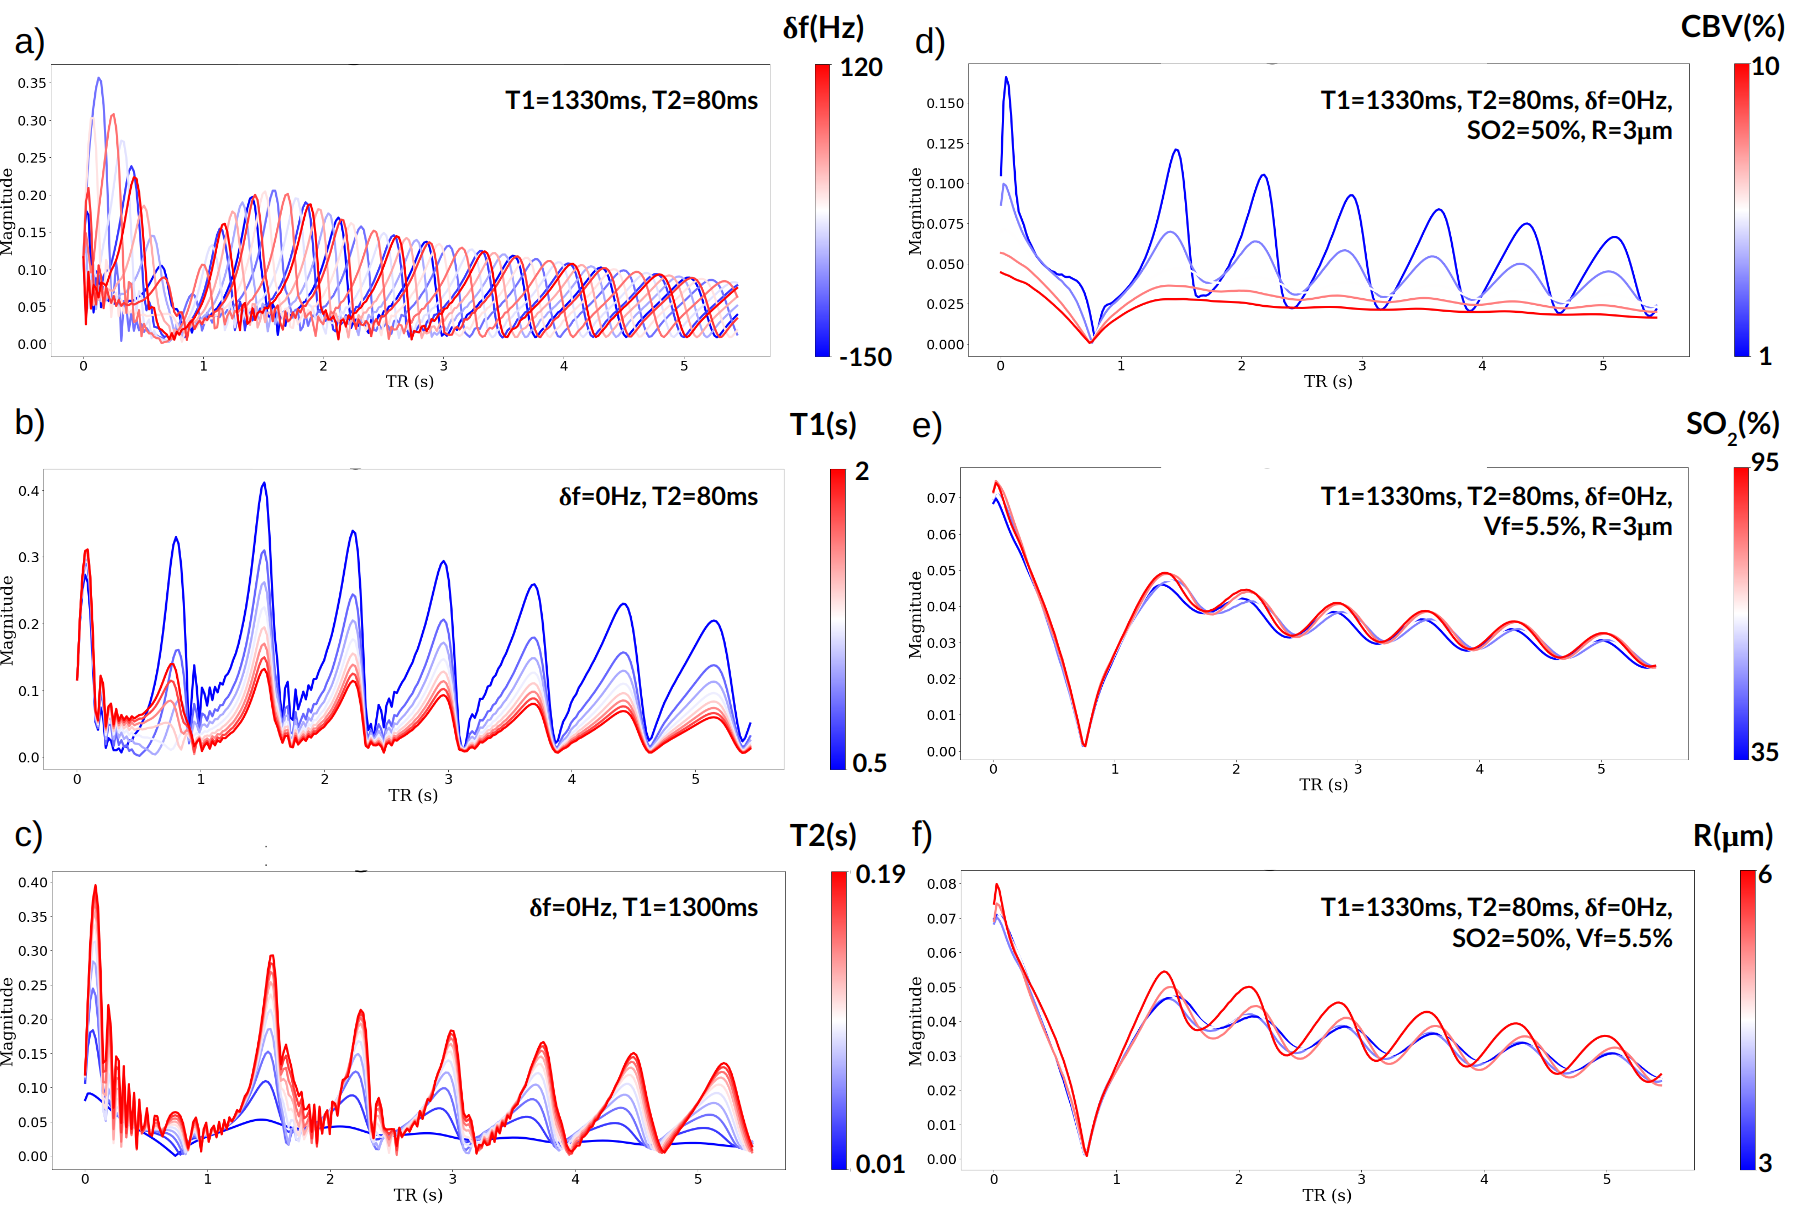
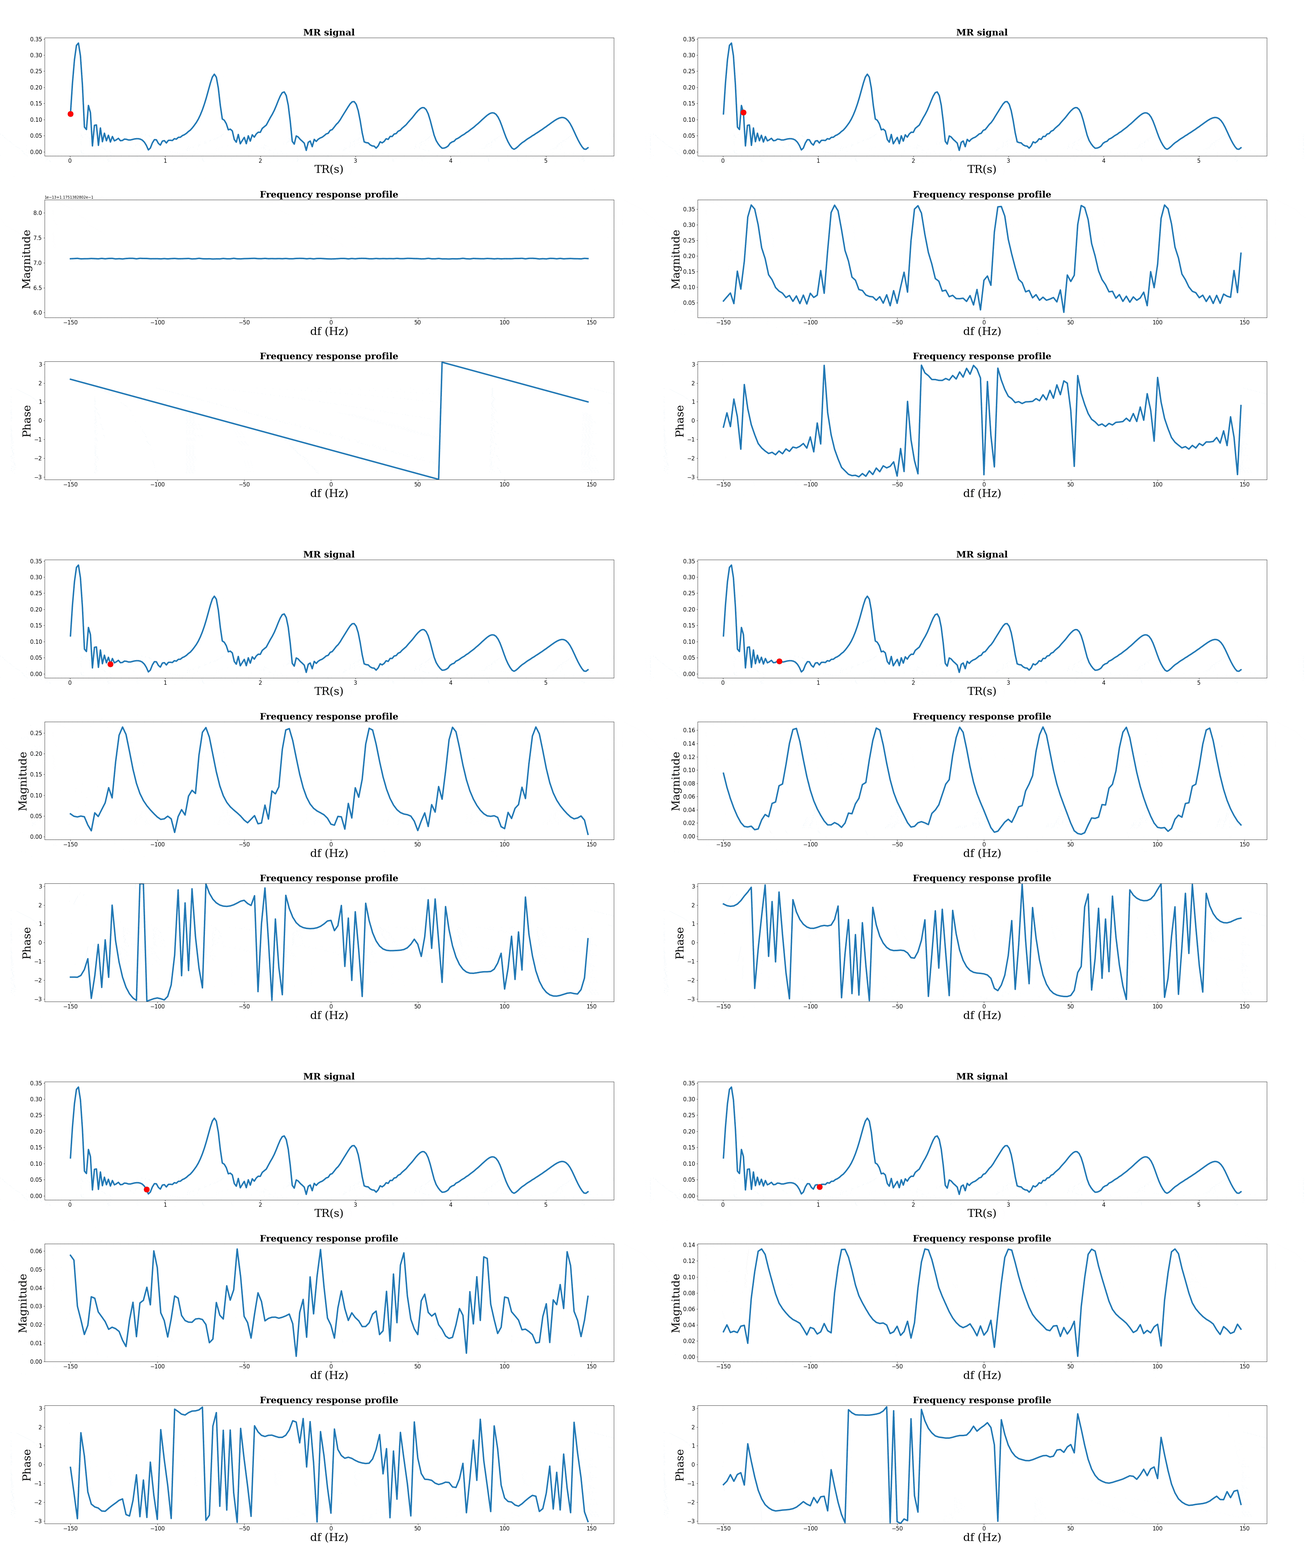
Figure 3: Animation showing one dictionary signal entry plot for T1=1300ms, T2=110ms, B1=1, δf=0Hz before convolution, as well as the MRF sequence magnitude and phase frequency response for the particular repetition marked by a red dot in the first row.
For gif size issues, only one over two TRs in the 50 first TRs are shown.