1315
Robust Estimation of Venous Cerebral Blood Volume Using Flow-Diffusion Modeling Combined with R2' and Perfusion Measurements1CUBRIC - School of Physics, Cardiff University, Cardiff, United Kingdom, 2CUBRIC - School of Psychology, Cardiff University, Cardiff, United Kingdom, 3Institute of Neuroscience and Medicine, Forschungszentrum Jülich, Jülich, Germany, 4Institute for Advanced Biomedical Technologies and Department of Neurosciences, Imaging, and Clinical Sciences, University G. D’Annunzio of Chieti-Pescara, Chieti, Italy
Synopsis
Keywords: Relaxometry, Metabolism, Oxygen metabolism
Motivation: Factoring out venous cerebral blood volume (vCBV) and oxygen extraction fraction (OEF) from the relaxation of R2’ poses a significant challenge.
Goal(s): We combined robust measurements of R2’ relaxation from GE-SE EPIK and perfusion from VSI-ASL with a flow-diffusion model of oxygen transport to improve estimation of vCBV and OEF.
Approach: The proposed method was tested in normoxia, hyperoxia and hypercapnia against validated TRUST measurements of OEF.
Results: Maps of OEF and vCBV accurately depicted the oxygen metabolism at baseline as well as during the gas challenges without the need of any calibration, with high resolution and within reasonable acquisition time.
Impact: The integration of the oxygen flow-diffusion model with GE-SE EPIK measurements of R2’ relaxation and VSI-ASL measurements of perfusion gives high resolution parametric maps of oxygen metabolism within reasonable acquisition time, ultimately reducing the gap between research and clinical practise.
Introduction
The cerebral metabolic rate of oxygen consumption (CMRO2), oxygen extraction fraction (OEF), and cerebral blood volume (CBV) provide valuable insights into brain metabolism, especially in pathological conditions. OEF and venous CBV (vCBV) maps can be extracted from R2'-relaxometry due to the differing susceptibility of de-oxyhaemoglobin (Hb) and Hb in blood. However, accurate estimation of vCBV and OEF from MR signal decay alone remains challenging. We propose a method that integrates a flow-diffusion model of oxygen transport [2] to simultaneously estimate OEF, vCBV, and CMRO2 maps from R2' measurements (with EPI keyhole acquisition [3]) and cerebral blood flow (CBF) (with arterial spin labelling (ASL)). The method's performance is evaluated against validated TRUST measurements of OEF at the superior sagittal sinus [4] and compared to fixing vCBV at a fixed literature value. Performance is tested under normoxia, as well as under altered physiological conditions induced by respiratory hyperoxia (increased blood oxygenation) and hypercapnia (increased perfusion).Methods
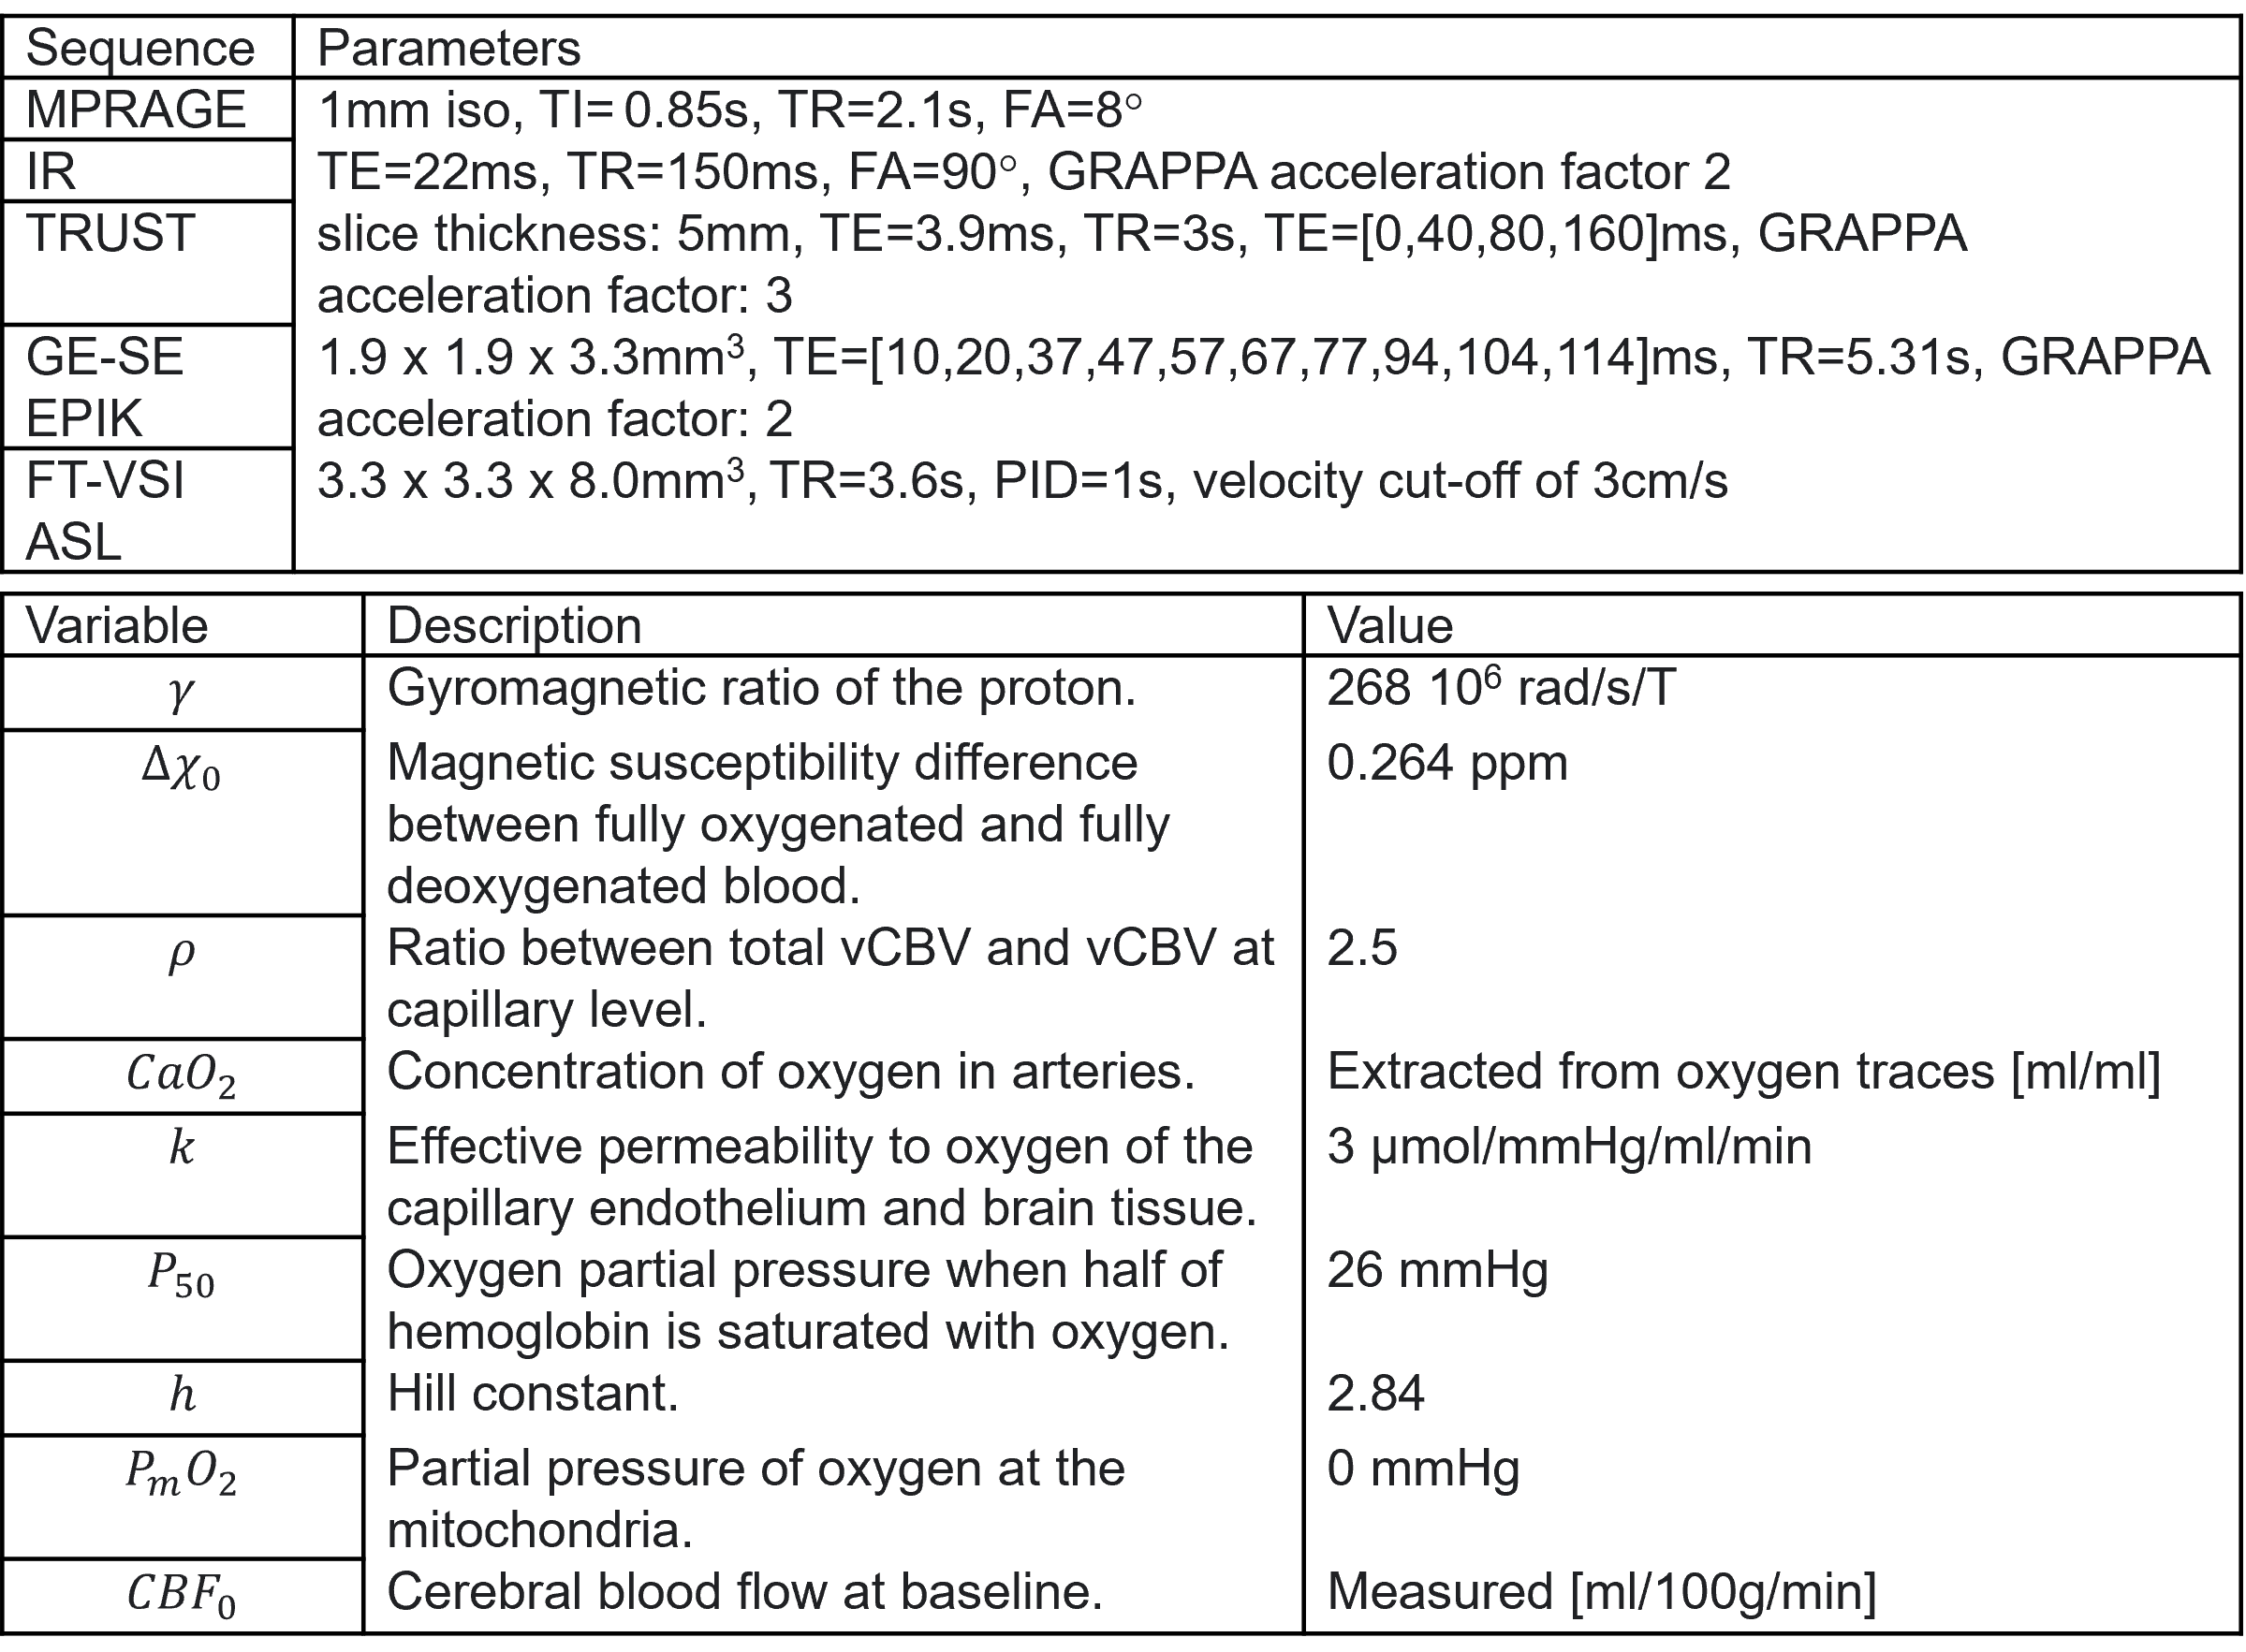
Six healthy volunteers (2 female, mean age 24 years) were recruited to the study. Data were acquired using a Siemens MAGNETOM Prisma 3T clinical scanner with a 32-channel receiver head coil (Siemens Healthcare GmbH, Erlangen). An initial anatomical isotropic MPRAGE scan was followed by IR and TRUST measurements in the superior sagittal sinus to obtain, respectively, global haematocrit (Hct) and OEF values. T2’ relaxation was captured with the GE-SE EPIK sequence [3]. Cerebral blood flow (CBF) was measured via Fourier transform velocity-selective inversion (FT-VSI) ASL [5]. Scanning parameters are reported in Table 1.Variations in R2' (GE-SE EPIK) were capture during both a 10-min hyperoxic and another 10-min hypercapnic gas challenges. Afterwards, a second hypercapnic challenge was administered to capture CBF (FT-VSI ASL). TRUST measurements were acquired either at the beginning or the end of each gas challenge. Each 10-min challenge consisted of two 2 mins of gas modulation interleaved with 2 mins of normoxia. For the hyperoxic challenge, a pre-emphasis of 100% O2 for 14s as well as a post-emphasis of 10% O2 / 90% N2 were administered at the beginning and end of each gas block to shorten the transition from and to baseline. Gas delivery was controlled by four mass flow controllers (MKS Instruments, Wilmington, MA, USA) and end-tidal gas traces were sampled during scanning with a rapidly responding gas analyser (AEI Technologies, Pittsburgh, PA, USA). Change in O2 pressure during hyperoxic paradigm was 264.92±12.90 mmHg between participants, whereas a change in CO2 of 17.04±2.58 mmHg during the hypercapnic one.
The relationship between R2’, OEF and vCBV was described as [6]:
$$R2'=\frac{4}{3}\cdot γ\cdot π\cdot Δχ_0\cdot Hct\cdot OEF\cdot vCBV\cdot B_0.$$
with the flow-diffusion model describing [2]:
$$vCBV=\rho\frac{CBF\cdot OEF\cdot C_aO_2}{k\cdot (P_{50}\cdot \sqrt[h]{\frac{2}{OEF}-1}-P_mO_2)}.$$
For clarity, variable names and values are reported in Table 1. Finally, CMRO2 was evaluated with the Fick’s principle [7]:
$$CMRO_2=CBF\cdot OEF\cdot C_aO_2.$$
Analysis was carried out in the coarser subject-specific space defined by the FT-VSI scan. Gray matter (GM) segmentations from the MPRAGE scan (FAST, threshold 0.5 [8]) were registered to the same ASL space (EPI-REG [9]). Change and baseline R2’ values associated to gas manipulations was extracted with a general linear model. The vCBV estimates from the flow-diffusion model were compared to the assumption of fixed vCBV=3%[1]. The latter was corrected during hypercapnia to account for the increased perfusion following the Grubb’s relationship [10]:
$$vCBV=3\%\cdot (\frac{CBF}{CBF_0})^{0.18}.$$
Results
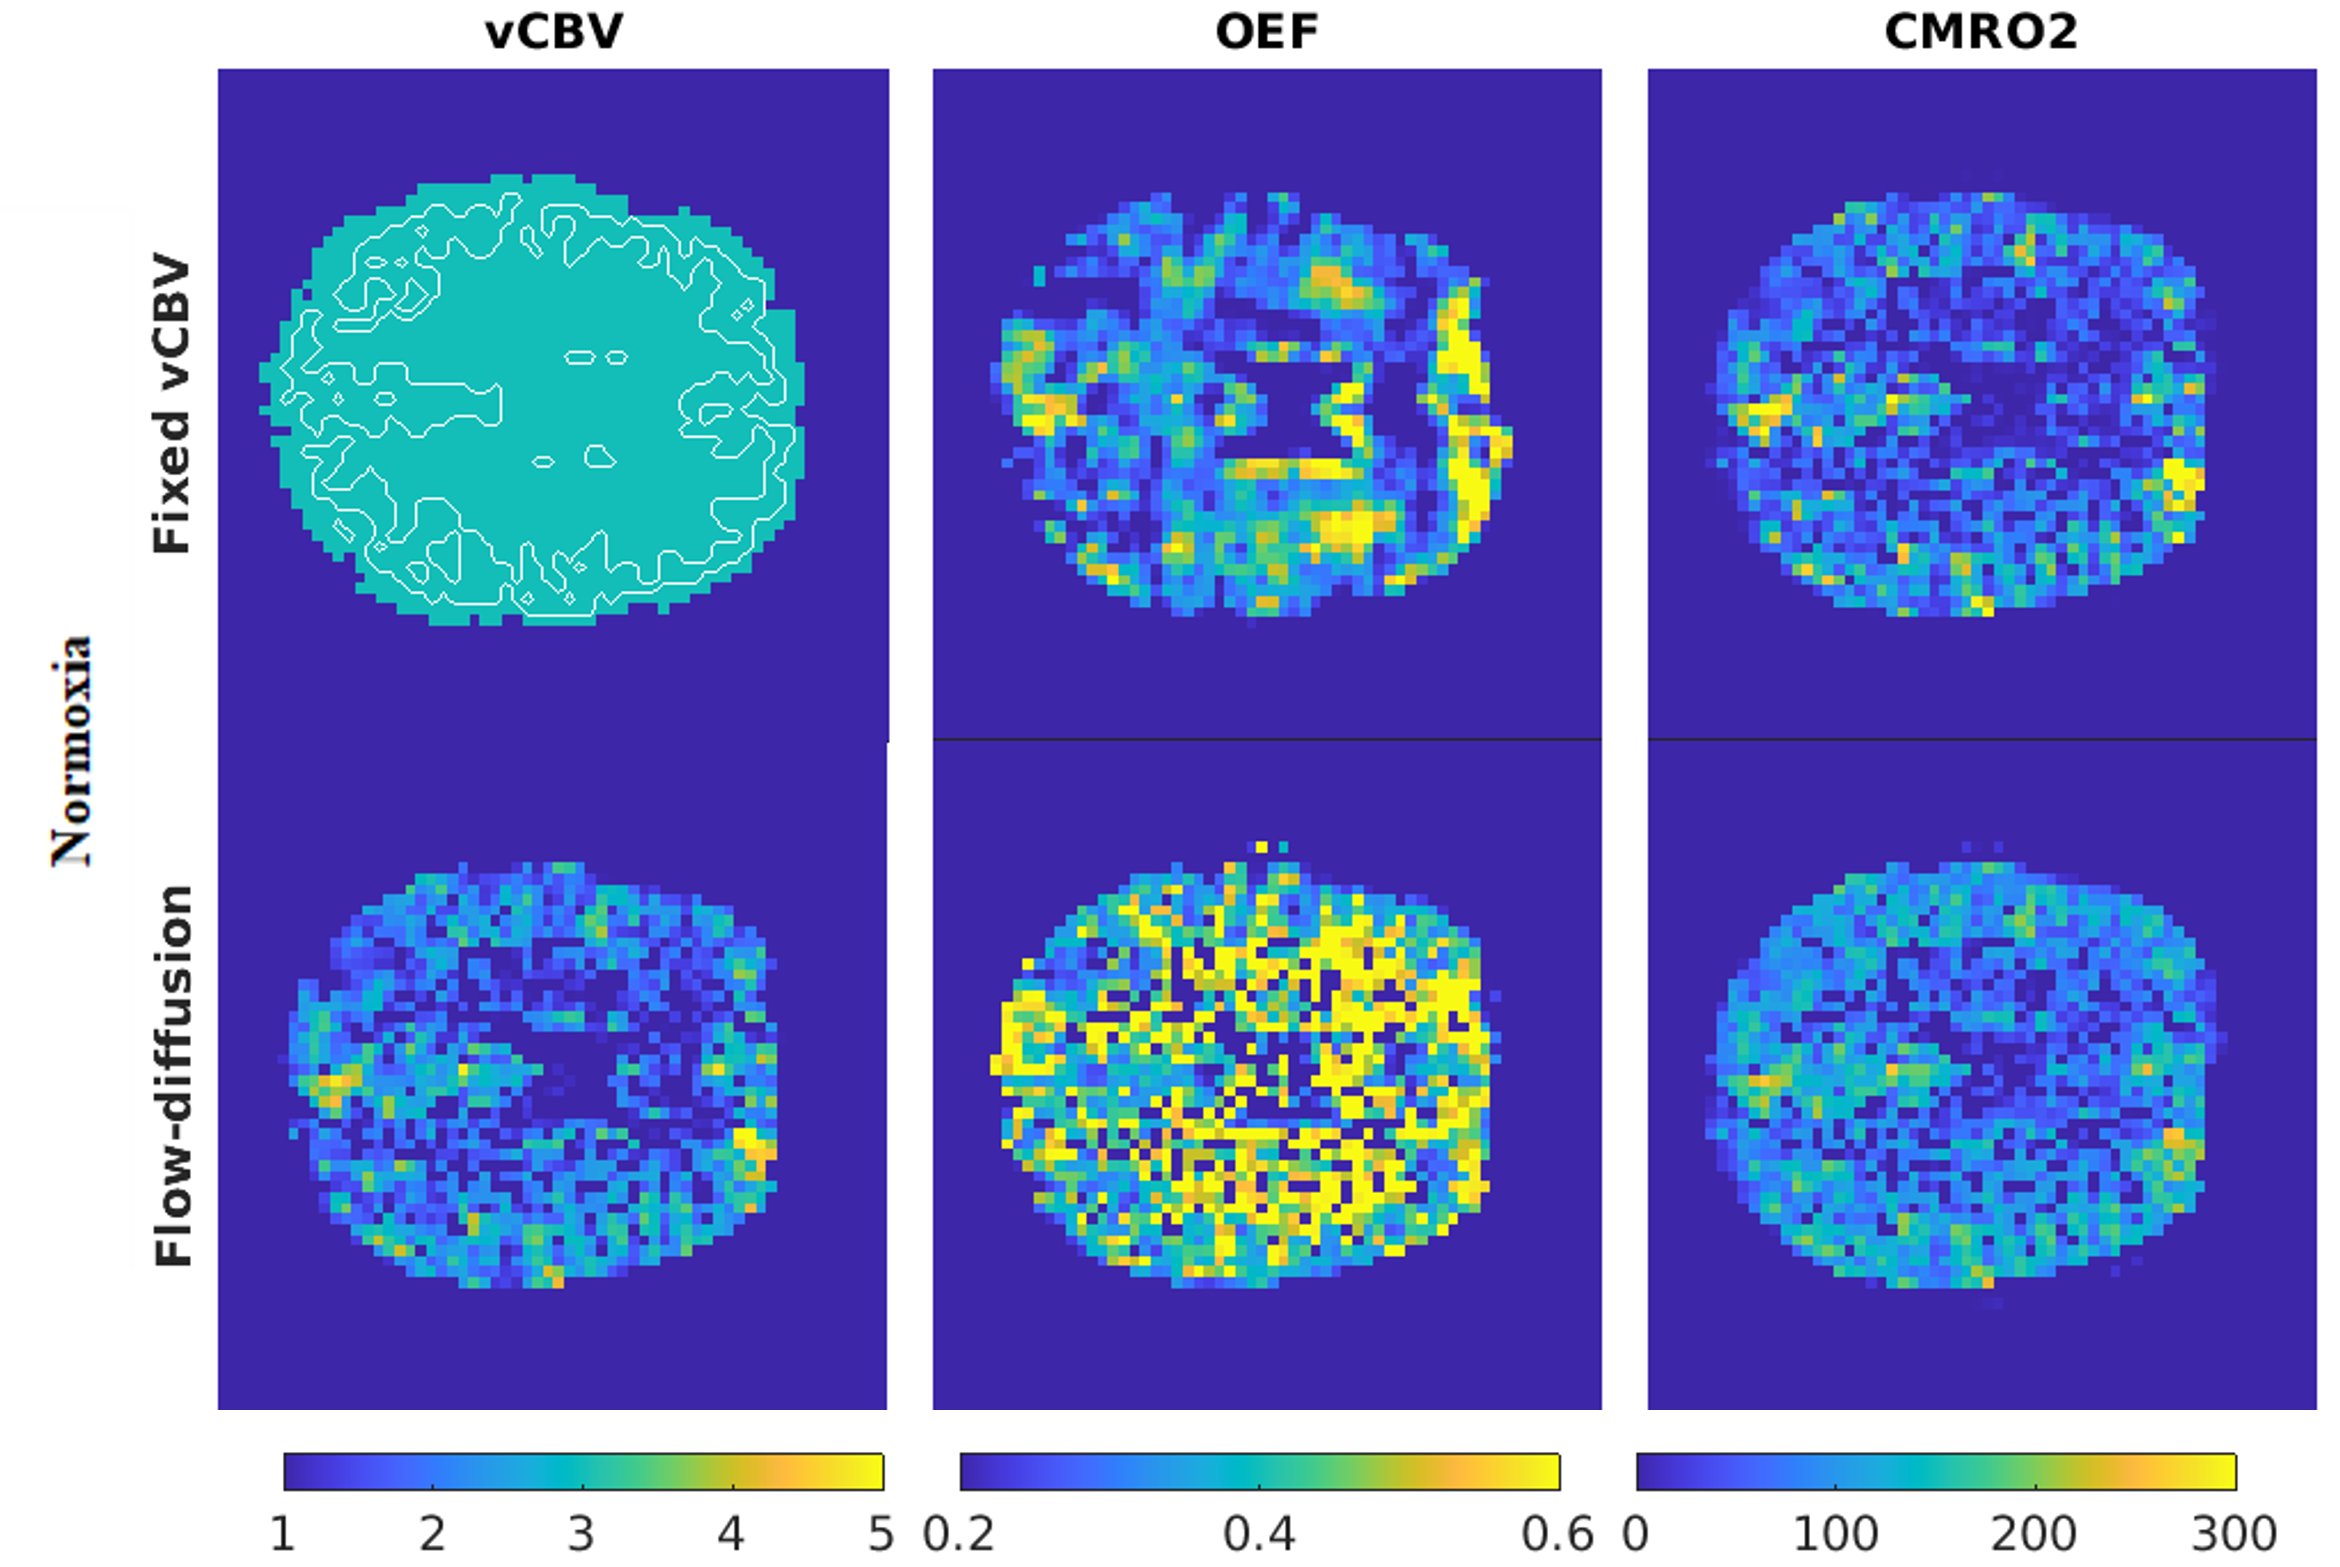
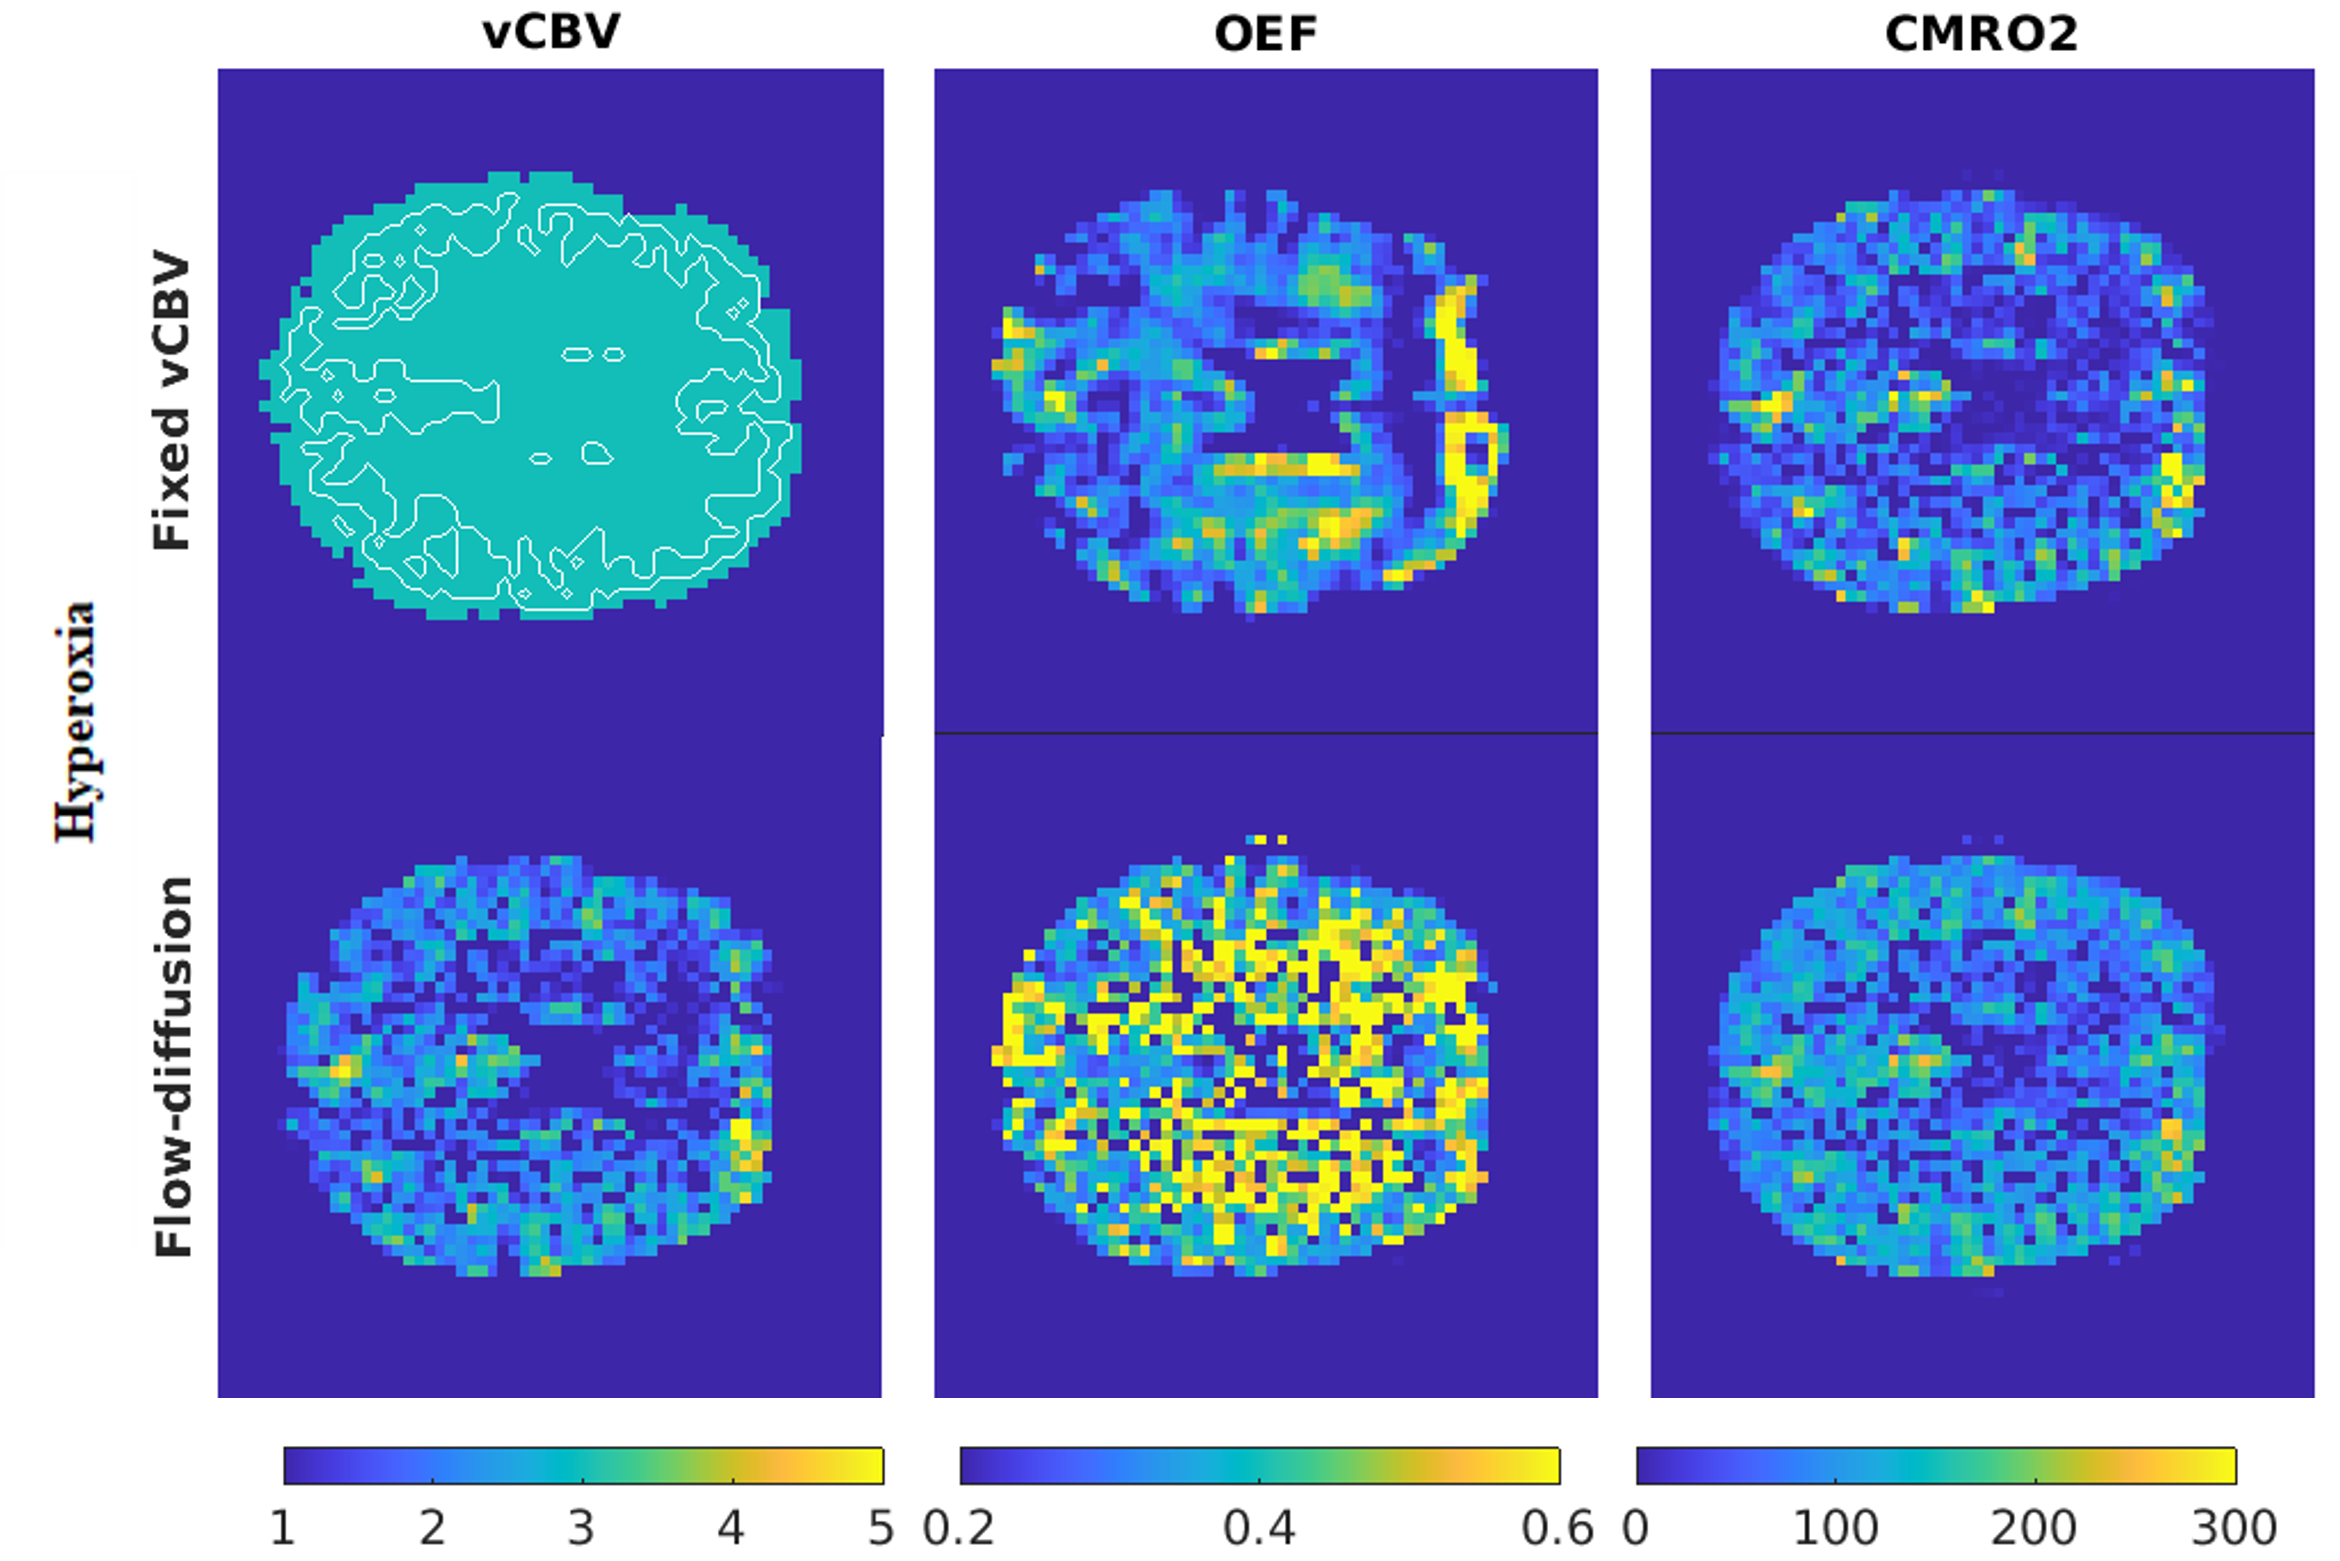
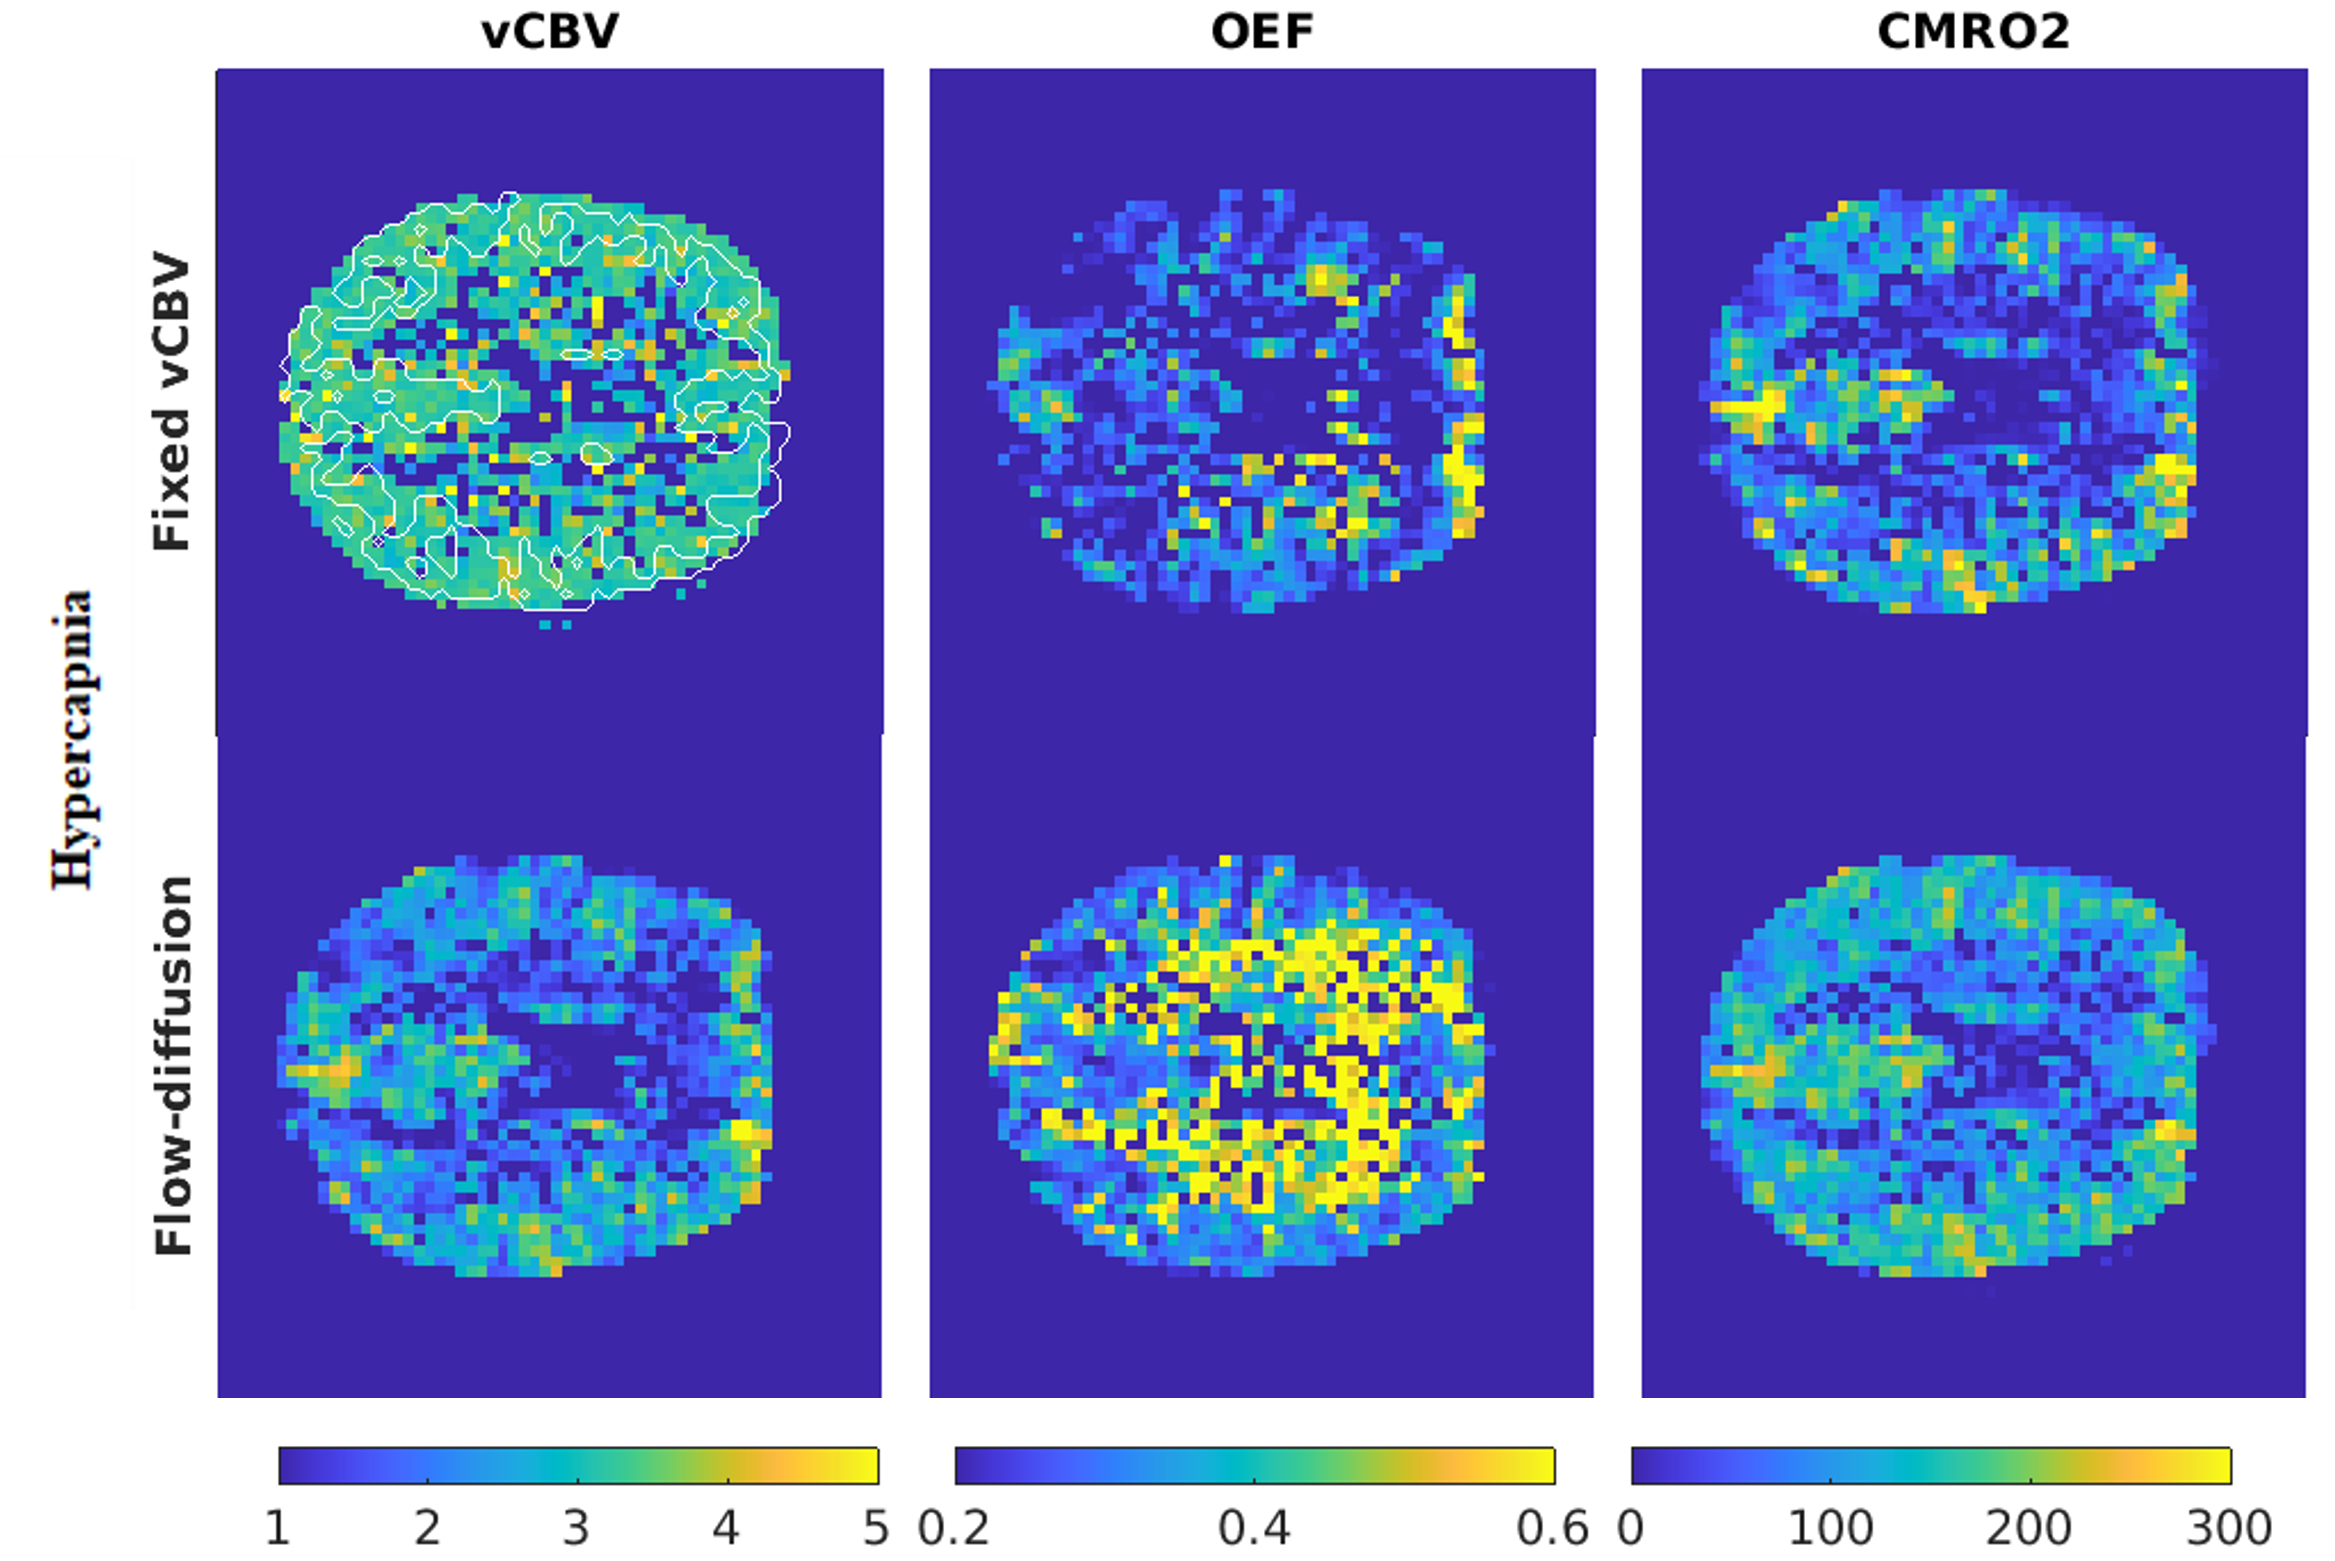
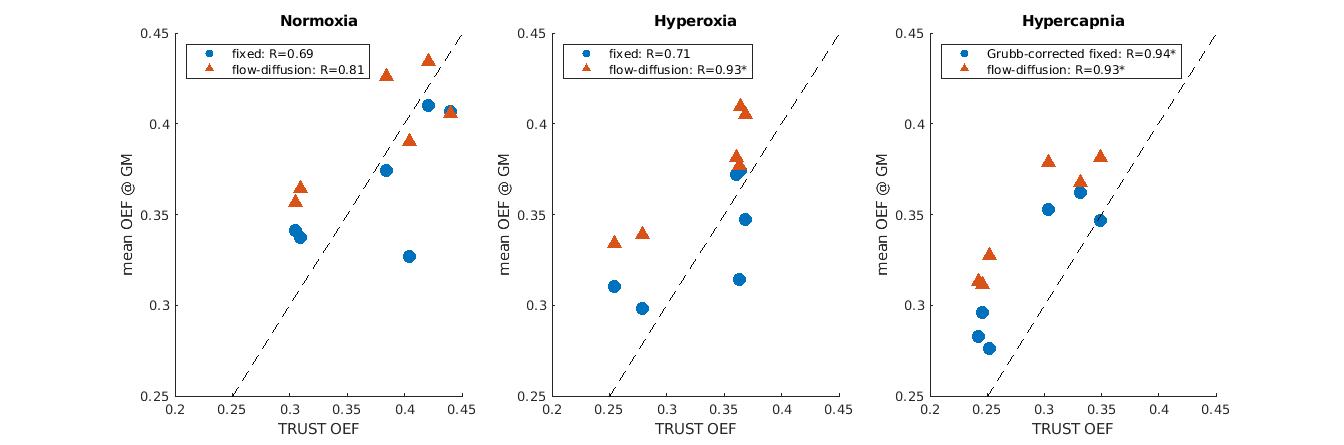
Figures 1, 2 and 3 show the spatial distribution of OEF and vCBV during the three conditions tested. vCBV estimations were 3.96±0.32%, 3.74±0.32% and 3.47±0.33% in normoxia, hyperoxia and hypercapnia, respectively. A CBF increase of 1.260±0.081 was captured during hypercapnia. Finally, a significant correlation (r=0.921, p<<0.05) between TRUST OEF and mean GM OEF from the flow-diffusion model was found across physiological states (Figure 4), with estimates in agreement with previous literature [11-13].Discussion
The flow-diffusion model, integrated with GE-SE EPIK R2' relaxation measures, yielded reliable vCBV and OEF maps under normoxia, hyperoxia, and hypercapnia. This methodology outperforms other R2'-relaxometry techniques by providing robust parametric maps with high spatial resolution and reasonable acquisition times [3]. It also offers quantitative physiological parameters without requiring gas calibration or independent vCBV measurements [7, 14, 15, 16]. The method's stability in response to the physiological alterations during hypercapnia and hyperoxia indicates its robustness to moderate changes in vascular physiology and mitochondrial oxygen tension ($$$P_mO_2$$$) [2]. These findings suggest a simple and robust method for measuring cerebral oxygen metabolism in healthy and diseased brains. Future studies will investigate the influence of larger $$$P_mO_2$$$ variations and effective oxygen permeability in grossly abnormal physiology.Acknowledgements
The study was funded by EPSRC grant (EP/S025901/1), MG’s Wellcome Fellowship . (220575/Z/20/Z), and the Wellcome Trust for the Strategic Award (104943/Z/14/Z).
Funded in part by the European Union - NextGenerationEU under the National Recovery and Resilience Plan (NRRP), Mission 4 Component 2 -M4C2, Investment 1.5 - Call for tender No. 3277 of 30.12.2021 Italian Ministry of Universities Award Number: ECS0000004, Project Title: “Innovation,digitalisation and sustainability for the diffused economy in Central Italy,” Concession Degree No. 1057 of 23.06.2022 adopted by the Italian Ministry of Universities, CUP: D73C22000840006.
References
1. He, X. and D.A. Yablonskiy, Quantitative BOLD: Mapping of human cerebral deoxygenated blood volume and oxygen extraction fraction: Default state. Magnetic resonance in medicine, 2007. 57(1): p. 115-126.
2. Hayashi, T., et al., A Theoretical Model of Oxygen Delivery and Metabolism for Physiologic Interpretation of Quantitative Cerebral Blood Flow and Metabolic Rate of Oxygen. Journal of cerebral blood flow and metabolism, 2003. 23(11): p. 1314-1323.
3. Kuppers, F., S.D. Yun, and N.J. Shah, Development of a novel 10-echo multi-contrast sequence based on EPIK to deliver simultaneous quantification of T(2) and T(2)(*) with application to oxygen extraction fraction. Magn Reson Med, 2022. 88(4): p. 1608-1623.
4. Lu, H., et al., Calibration and validation of TRUST MRI for the estimation of cerebral blood oxygenation. Magnetic Resonance in Medicine, 2012. 67(1): p. 42-49.
5. Qin, Q. and P.C.M. Van Zijl, Velocity-selective-inversion prepared arterial spin labeling. Magnetic Resonance in Medicine, 2016. 76(4): p. 1136-1148.
6. Yablonskiy, D.A. and E.M. Haacke, Theory of NMR signal behavior in magnetically inhomogeneous tissues: The static dephasing regime. Magnetic resonance in medicine, 1994. 32(6): p. 749-763.
7. Chiarelli, A.M., et al., A flow-diffusion model of oxygen transport for quantitative mapping of cerebral metabolic rate of oxygen (CMRO(2)) with single gas calibrated fMRI. J Cereb Blood Flow Metab, 2022. 42(7): p. 1192-1209.
8. Zhang, Y., M. Brady, and S. Smith, Segmentation of brain MR images through a hidden Markov random field model and the expectation-maximization algorithm. IEEE Trans Med Imaging, 2001. 20(1): p. 45-57.
9. Jenkinson, M., et al., Improved Optimization for the Robust and Accurate Linear Registration and Motion Correction of Brain Images. NeuroImage, 2002. 17(2): p. 825-841.
10. Chen, J.J. and G.B. Pike, BOLD-specific cerebral blood volume and blood flow changes during neuronal activation in humans. NMR in Biomedicine, 2009. 22(10): p. 1054-1062.
11. Marchal, G., et al., Regional cerebral oxygen consumption, blood flow, and blood volume in healthy human aging. Arch Neurol, 1992. 49(10): p. 1013-20.
12. Yin, Y., Y. Zhang, and J.H. Gao, Dynamic measurement of oxygen extraction fraction using a multiecho asymmetric spin echo (MASE) pulse sequence. Magn Reson Med, 2018. 80(3): p. 1118-1124.
13. Ma, Y.H., et al., Quantification of brain oxygen extraction fraction using QSM and a hyperoxic challenge. Magnetic Resonance in Medicine, 2020. 84(6): p. 3271-3285.
14. Germuska, M., et al., Dual-calibrated fMRI measurement of absolute cerebral metabolic rate of oxygen consumption and effective oxygen diffusivity. NeuroImage (Orlando, Fla.), 2019. 184: p. 717-728.
15. Germuska, M., et al., Quantitative mapping of cerebral oxygen metabolism using breath-hold calibrated fMRI. 2021, Cold Spring Harbor Laboratory.
16. Stone, A.J. and N.P. Blockley, Improving qBOLD based measures of oxygen extraction fraction using hyperoxia-BOLD derived measures of blood volume. 2020, Cold Spring Harbor Laboratory.
Figures