1314
Derivation of a suitable exchange fraction expression to model diffusion-driven exchange with MR measurements.1Department of Biomedical Engineering, Linköping University, Linköping, Sweden, 2Department of Chemistry, Zhejiang University, Hangzhou, China, 3School of Medicine, Zhejiang University, Hangzhou, China, 4Department of Mathematics, Linköping University, Linköping, Sweden
Synopsis
Keywords: Relaxometry, Relaxometry, Water exchange, diffusion physics
Motivation: Transmembrane water exchange in brain tissue is a process often modelled via the first order kinetics reaction (1OKR) expression. However, this expression does not account for diffusion dynamics, suggesting it is not suitable to describe diffusion-driven exchange.
Goal(s): Assess the difference between the 1OKR expression and the exchange fraction derived from a generally defined system.
Approach: The exchange fraction was derived considering geometry, and compartment-specific relaxation processes of a system via the diffusion-reaction equation.
Results: The derived exchange fraction features a multi-exponential recovery at short times and a mono-exponential decay at long times, both of which are not captured by the 1OKR expression.
Impact: The two additional features of the exchange fraction found in this work provide additional insight on a system’s microstructure and properties. This expression can therefore be the basis of new biophysical models which more accurately describe the water exchange process.
Introduction & Theory
Transmembrane water exchange has been studied using different frameworks using magnetic resonance (MR) relaxation and diffusion measurements1-5. Most frameworks study two compartment systems (here labelled as A and B) and model exchange via the first order kinetics reaction (1OKR) expression:$$f_{a,b}(t)=f_{b,a}(t)=f_a\,f_b\,\left(1-e^{-k\,t}\right),\qquad{(1)}$$
where $$$f_{a,b}(t)$$$ is the exchange fraction, $$$f_a$$$ and $$$f_b$$$ are equilibrium fractions, and $$$k$$$ the exchange rate. The 1OKR expression is suitable to describe chemical reaction kinetics, however it may not be appropriate to describe diffusion-driven exchange processes since it holds no relationship to diffusion dynamics. In this work, we address this limitation by deriving an expression for the exchange fraction directly from the analysis of the diffusion-reaction equation.
Methods
Diffusion dynamics are governed by the following diffusion-reaction equation:$$\frac{\partial}{\partial{t}}p(x,t)=\frac{\partial}{\partial{x}}\left[D(x)\frac{\partial}{\partial{x}}p(x,t)\right]-H(x)\,p(x,t),\qquad{(2)}$$
where $$$p(x,t)$$$ denotes the particle density, $$$D(x)$$$ the diffusivity, and $$$H(x)$$$ the magnetization relaxation rate. All components of Eq.2 are space dependent, which accounts for the geometry of the analysed system. Solving this differential equation in a bounded domain ($$$x\in\Psi$$$) allows to express the space dependent terms in the following eigenbasis:
$$\frac{\partial}{\partial{x}}\left[D(x)\frac{\partial}{\partial{x}}u_n(x)\right]-H(x)u_n(x)=-\lambda_{n}u_n(x) ,\qquad{(3)}$$
where the diffusion spectrum consists of the (non-negative) eigenvalues $$$\lambda_n$$$, and orthonormal eigenfunctions $$$u_n(x)$$$ which satisfy any given boundary conditions.
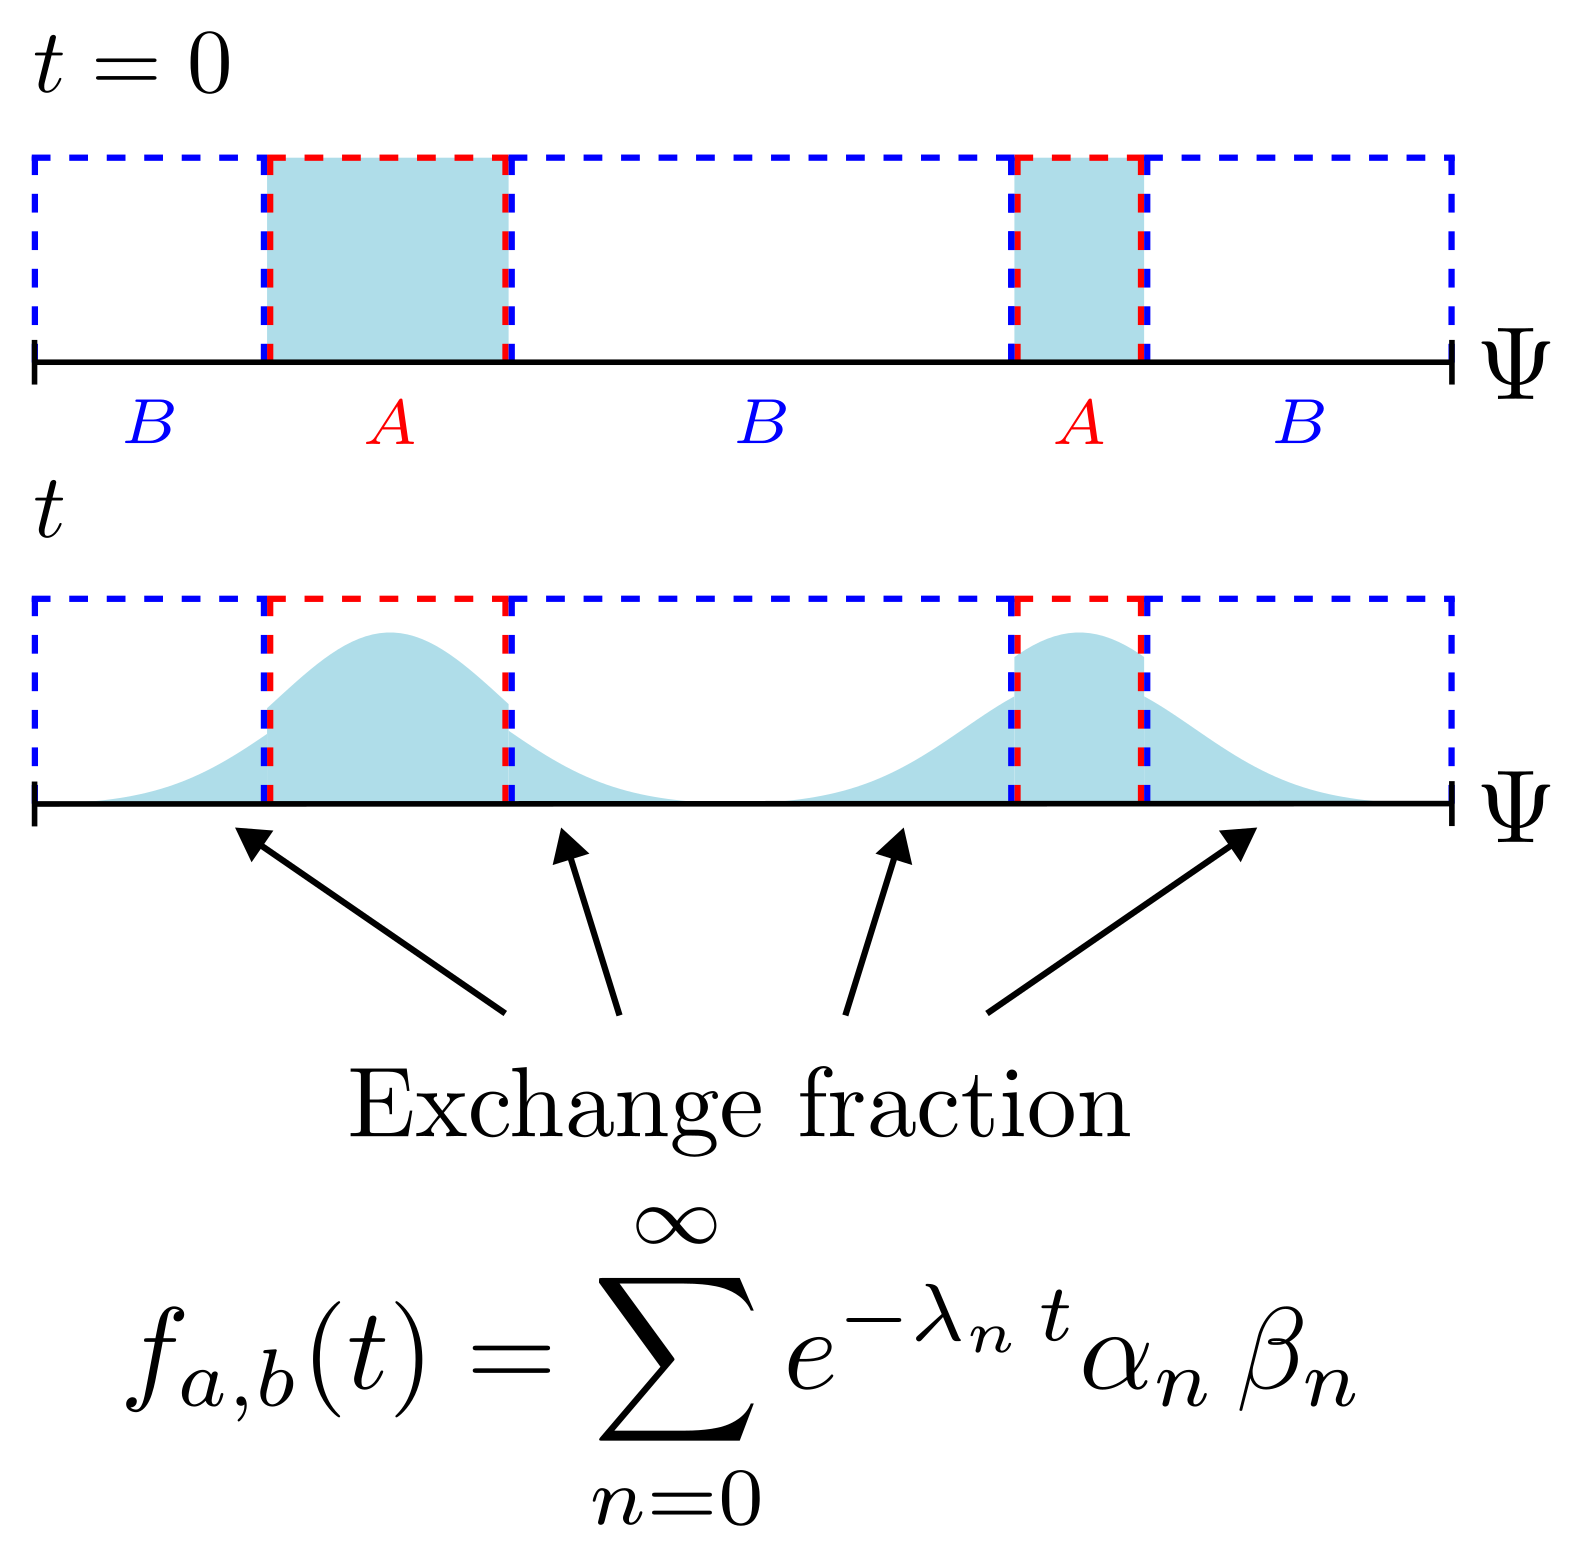
The proposed method, illustrated in Fig.1, models the exchange fraction $$$f_{a,b}$$$ by first imposing a uniform and non-zero initial condition only in compartment A. After time $$$t$$$, some particles will have diffused over to the second compartment. Finally, $$$f_{a,b}$$$ is calculated as the ratio of the number of particles in the second pool to the number of particles in the domain, yielding:
$$f_{a,b}(t)=\sum_{n=0}^{\infty}e^{-\lambda_n\,t}\alpha_n\,\beta_n=e^{-\lambda_0\,t}\alpha_0\,\beta_0\left[1+\sum_{n=1}^{\infty}e^{-\left(\lambda_n-\lambda_0\right)\,t}\frac{\alpha_n\, \beta_n}{\alpha_0\,\beta_0}\right],\qquad{(4)}$$
where:
$$\alpha_n=\int_{A}dx\,u_n(x),\qquad\beta_n=\int_{B}dx\,u_n(x)\qquad{(5)}$$
For systems featuring relaxation, $$$\lambda_0\neq0$$$ and introduces an exponential decay to $$$f_{a,b}$$$. Furthermore, the sum series of exponential functions imply that $$$f_{a,b}$$$ features a multi-exponential recovery over time.

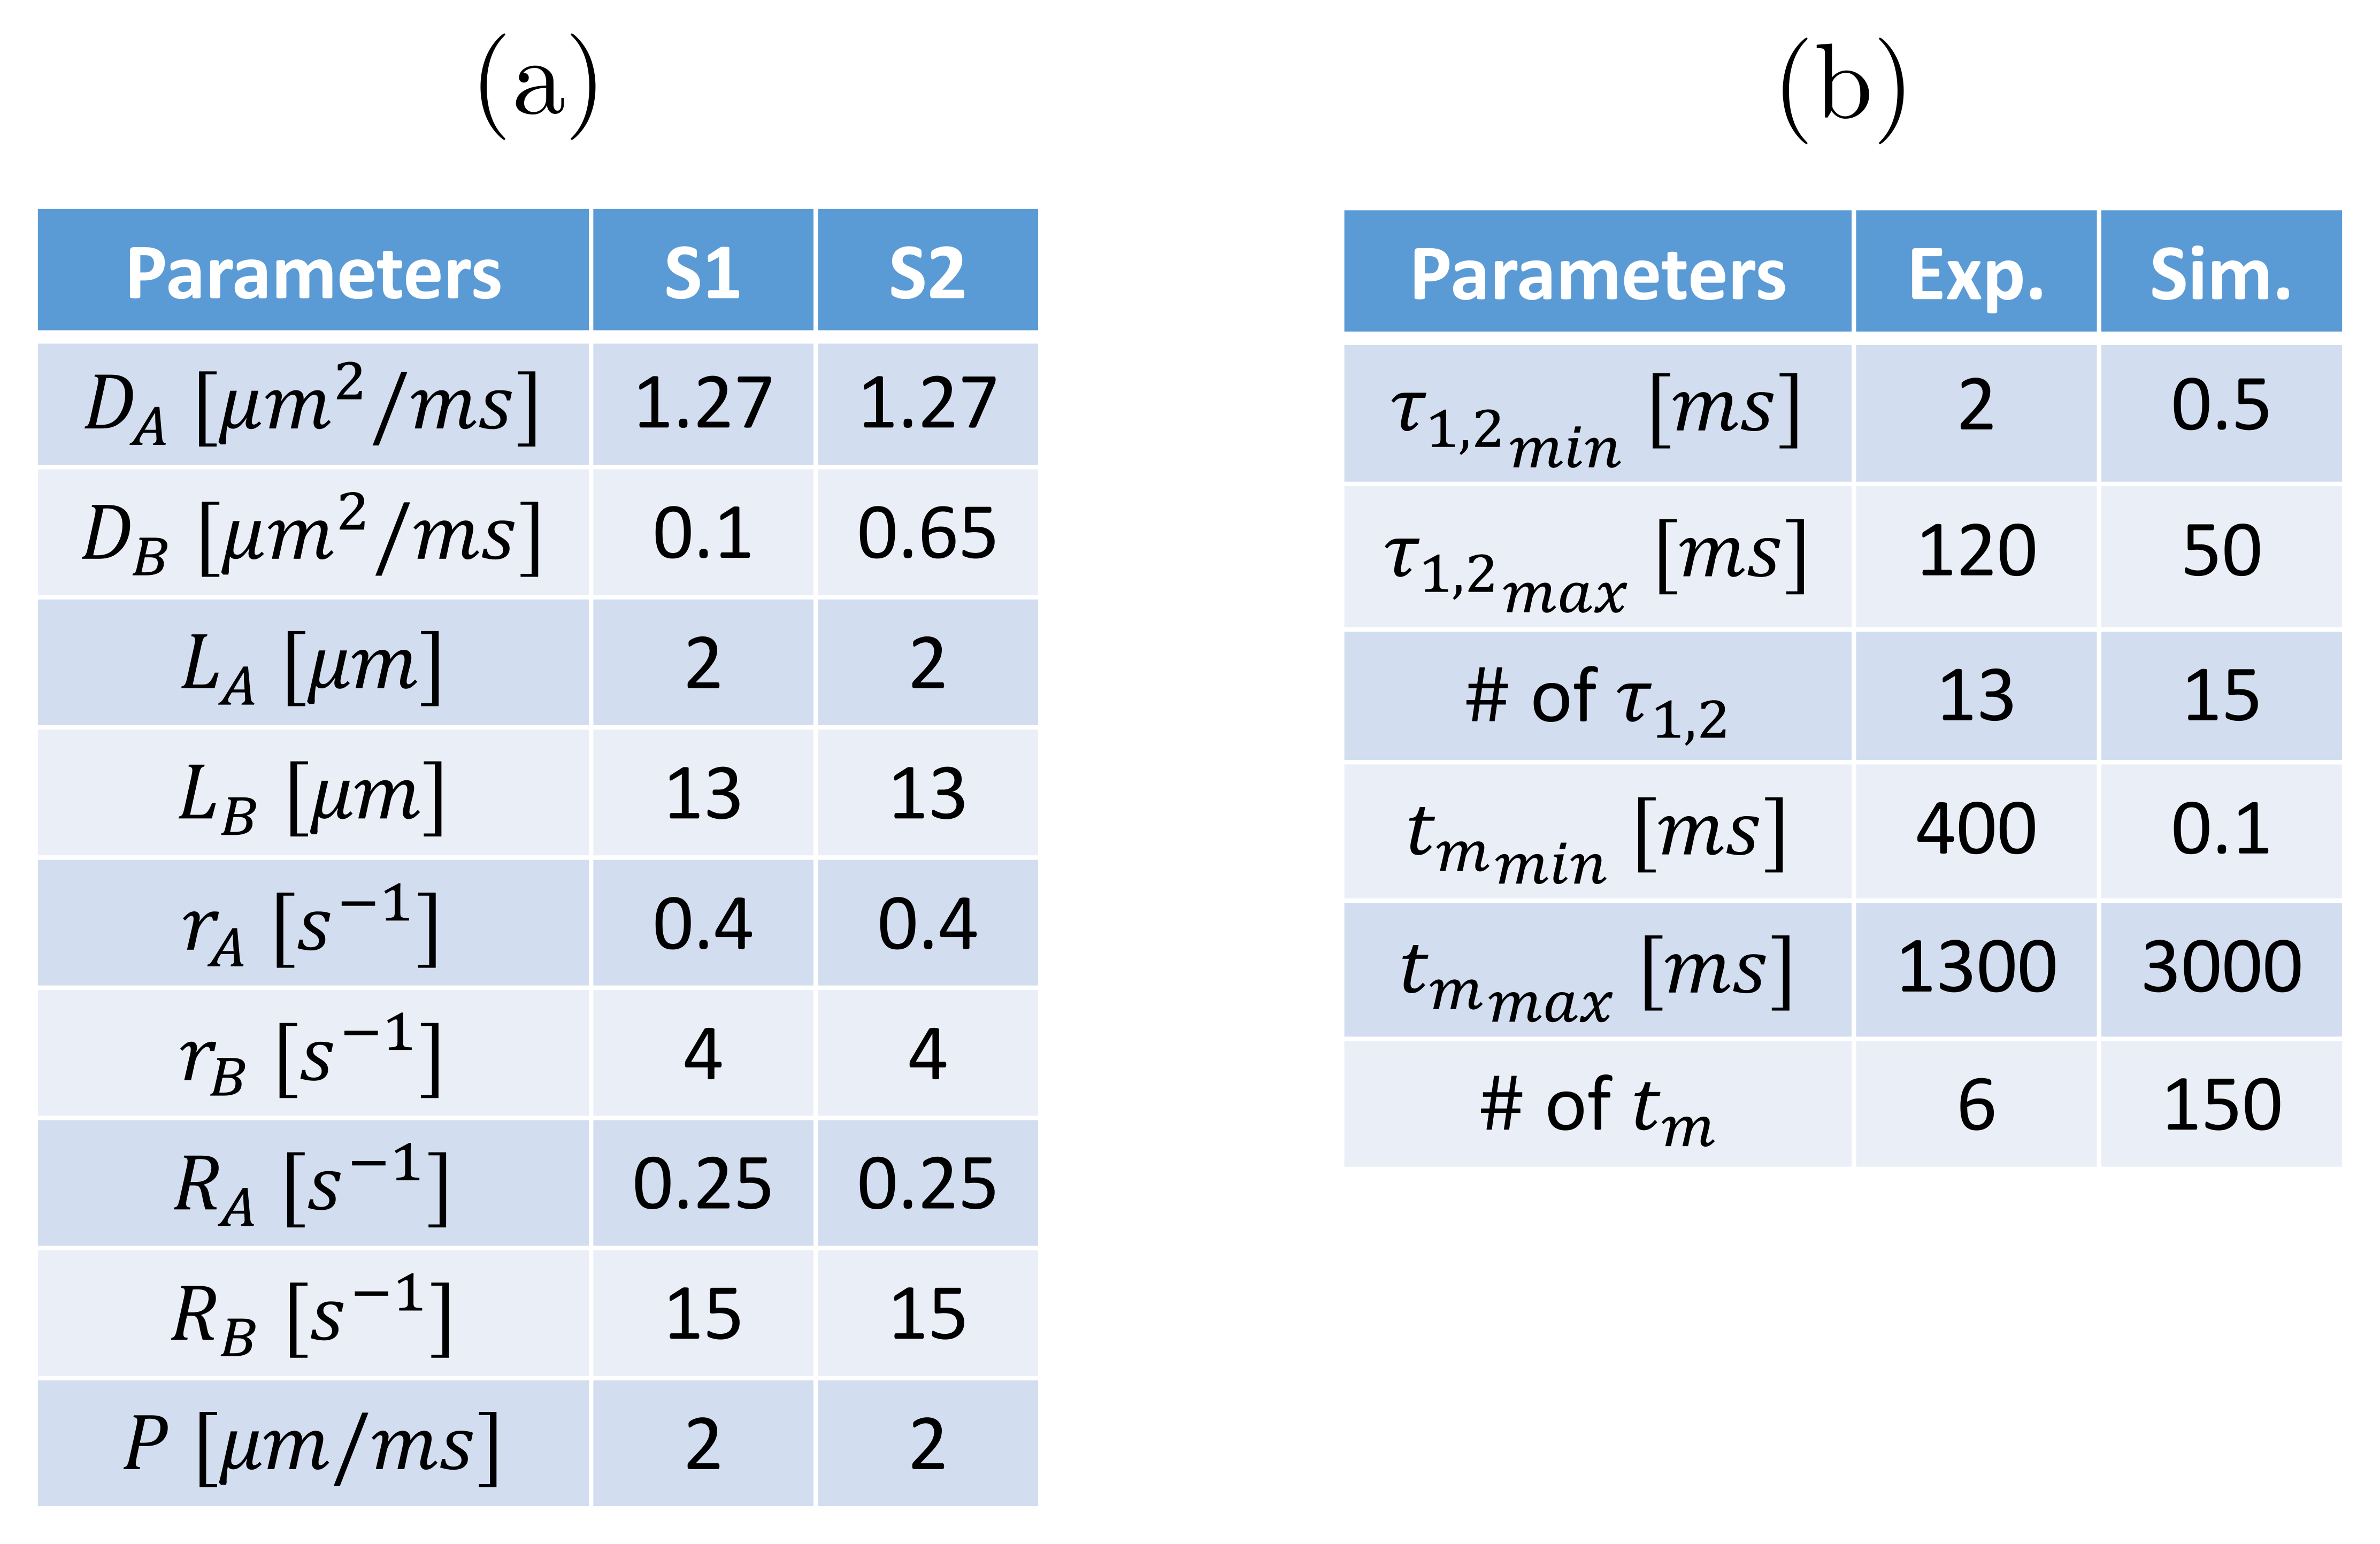
To test our findings, data from four identical urea-water (UW) samples and two simulated periodic systems (referred to as S1 and S2) were analysed. UW samples present a two-compartment exchanging system6,7 which lacks a defined geometry, making them useful to observe the exponential decay in $$$f_{a,b}$$$. The simulated systems (illustrated in Fig.2a) were composed of two compartments with a membrane between them. Each compartment is fully defined by its diffusivity, relaxation rates, and length, and the membranes, by their permeability (parameters are presented in Table 1a). Data from a REXSY1 experiment (Fig.2b) was acquired for the UW samples (600MHz Bruker scanner) and synthesised for S1 and S2 employing a matrix formalism (which makes use of the diffusion spectrum). The acquisition and simulation parameters are presented in Table 1b.
The exchange fraction was obtained from our derivations (referred to as the extracted exchange fraction) and estimated from experimental and simulated data (referred to as the estimated exchange fraction) by adapting a framework originally introduced for diffusion encoded measurements5 to relaxation experiments. All computations were performed with Mathematica and Python software developed in-house.
Results
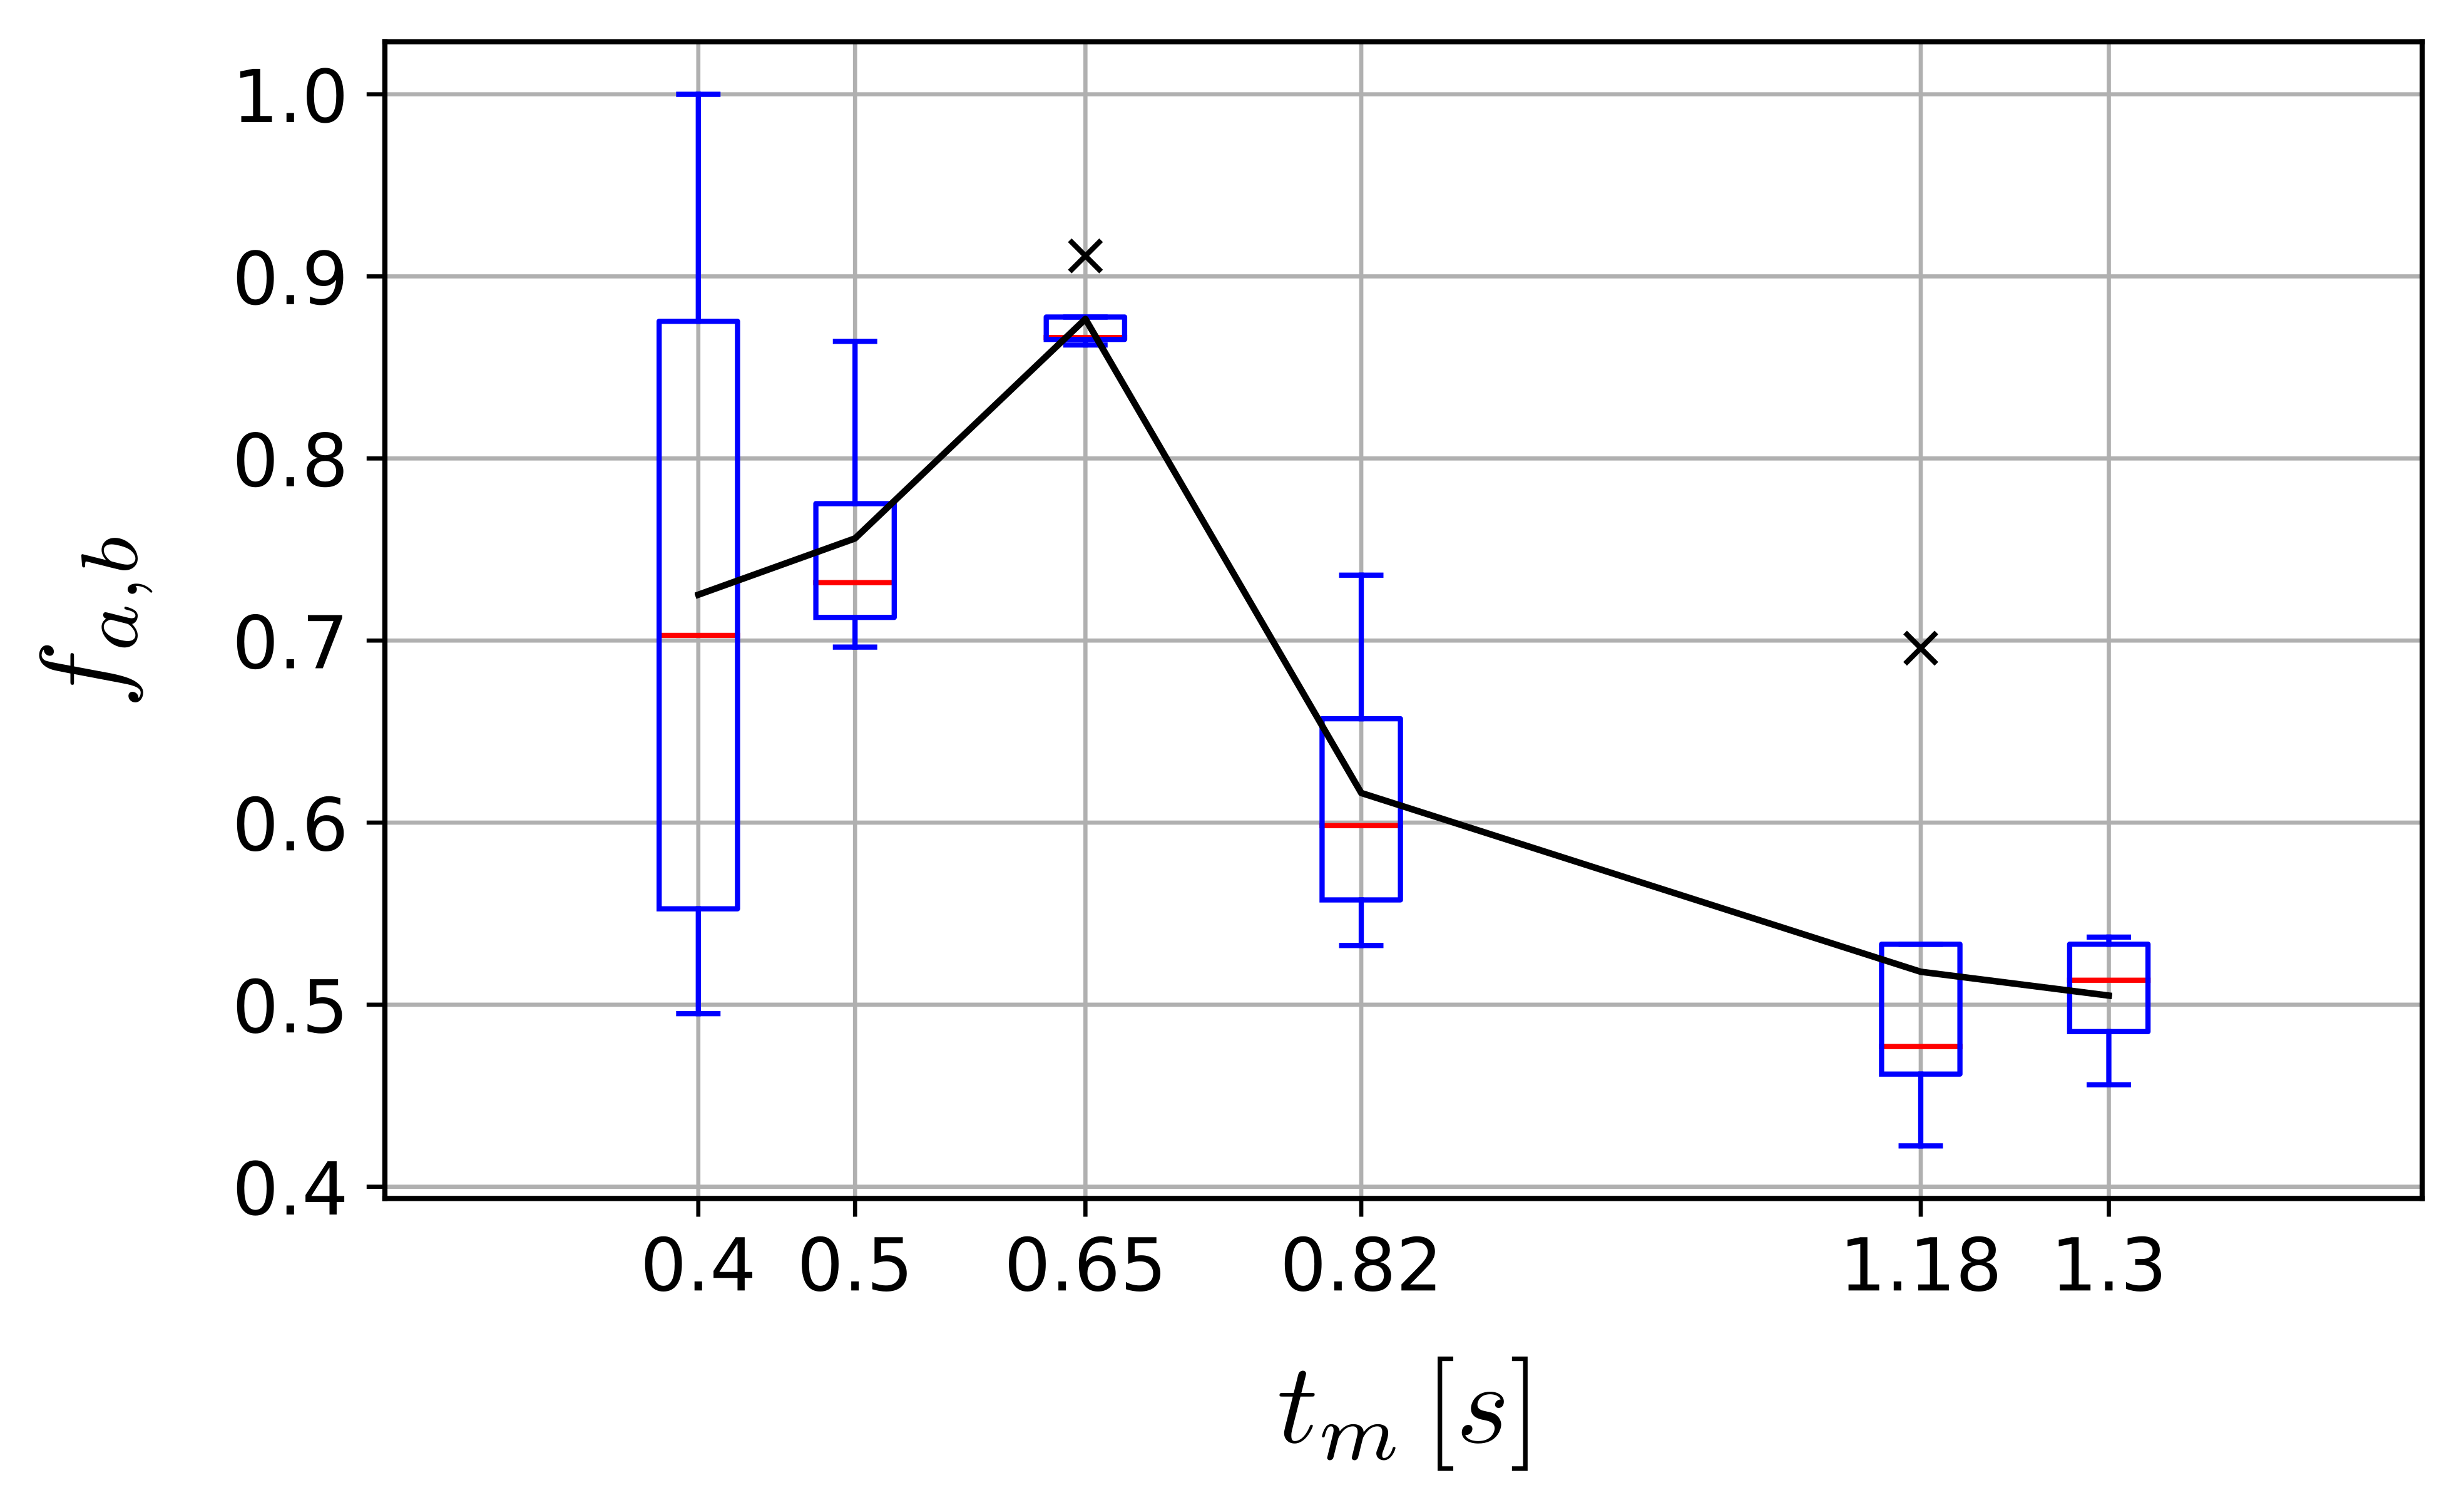
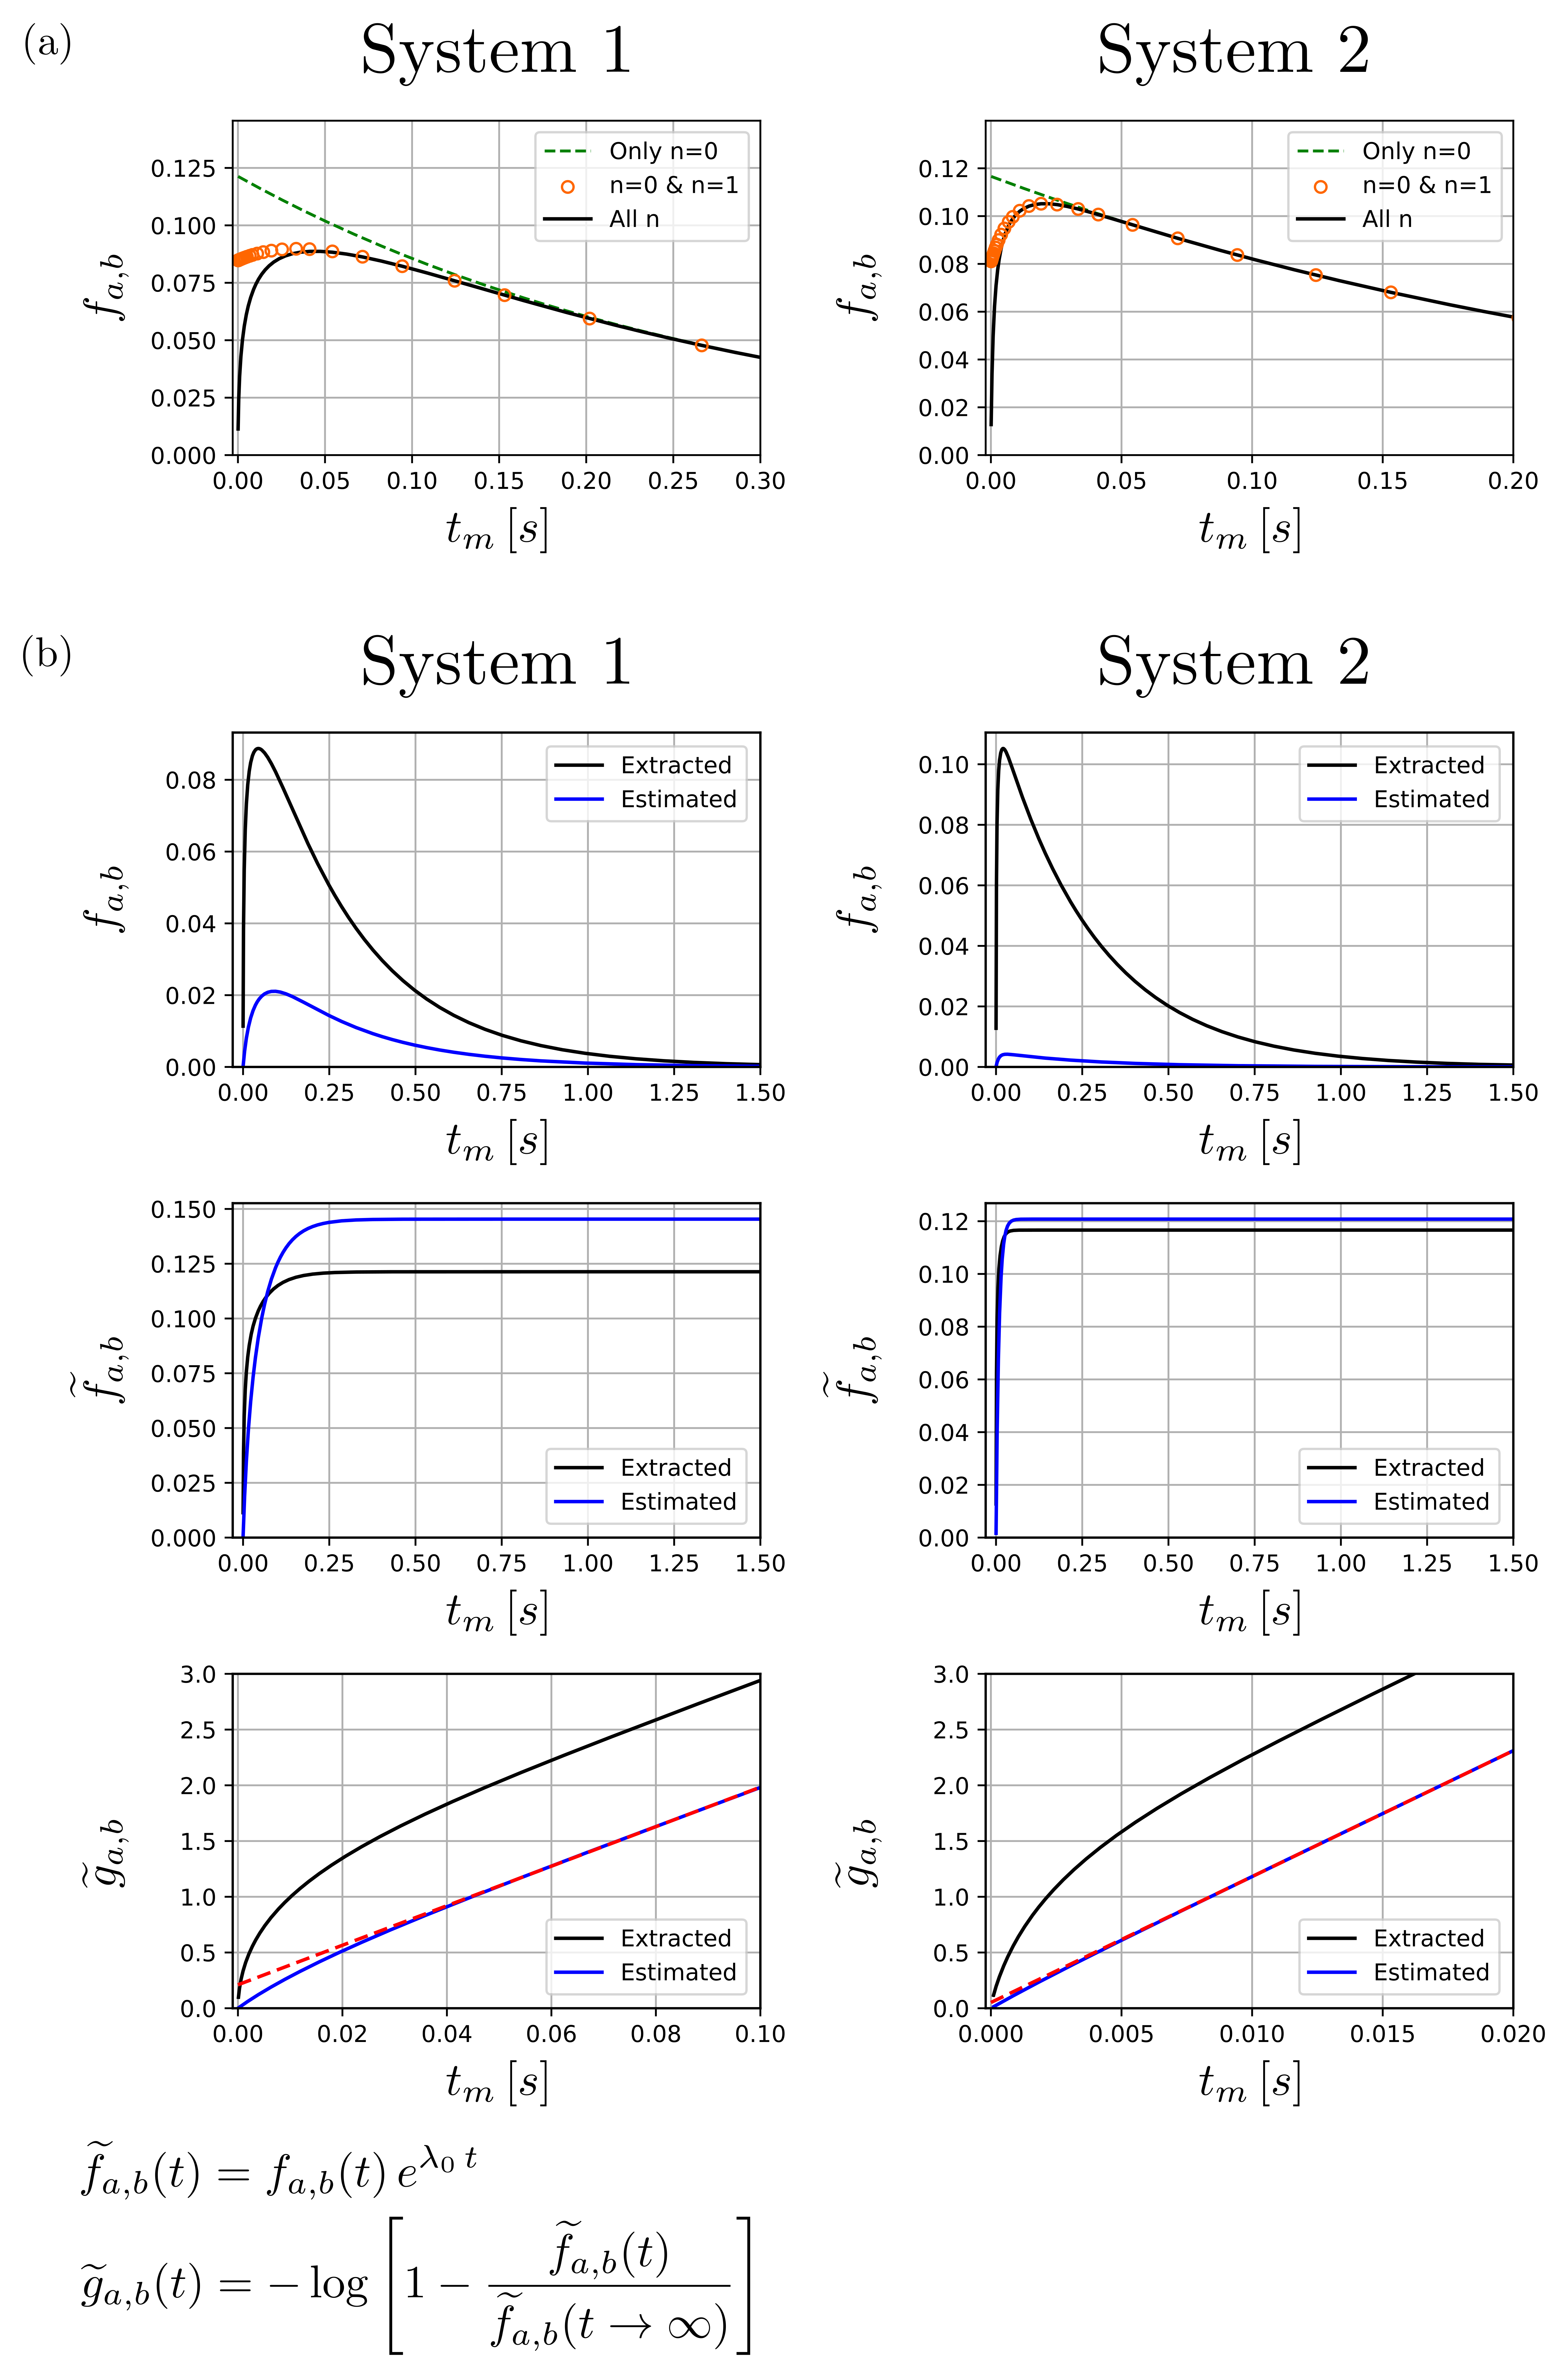
The estimated exchange fraction from the experiments on UW samples is presented in Fig.3, where the exponential decay of $$$f_{a,b}$$$ can be observed across all samples. The extracted fractions are presented in Fig.4a, where the inability to reproduce the full expression with fewer terms shows the multi-exponential feature in $$$f_{a,b}$$$. The extracted and estimated fractions from simulated systems are presented in Fig.4b, which show both features found in our derivations.Discussion & Conclusion
Regarding the method, Eq.4 shows two distinct features: a mono-exponential decay (caused by relaxation effects in the system) in the long-time regime, and a multi-exponential recovery (dependent on the diffusion spectrum of the system) in the short-time regime, neither of which is captured by the 1OKR expression. The first feature can be observed in the results from the UW samples. The second feature has been previously reported in ex-vivo animal experiments8, which was attributed to multiple exchange mechanisms. Our derivations offer another mechanism: the effect of geometry, membrane permeability and diffusion dynamics within the analysed system.Regarding the simulation results, the multi-exponential feature is more apparent in S1, suggesting that a larger difference between diffusion coefficients in compartments enhances this trend. Furthermore, this feature is dampened in the estimated functions, but not completely suppressed. This may be due to the employed framework, which was originally proposed under different assumptions (e.g., Gaussian diffusion)5. Nevertheless, it is remarkable that both features are observed in the estimated exchange fractions.
In conclusion, we derived an exchange fraction expression (Eq.4) different from the widely employed first order kinetics reaction one (Eq.1). The new expression accounts for diffusion dynamics and can thus provide more insight of the analysed system (diffusivity, relaxation, geometry, and membrane permeability).
Acknowledgements
The authors acknowledge support from the Swedish Research Council (Dnr 2022-04715), and the Swedish Foundation for International Cooperation in Research and Higher Education (STINT - Dnr CH2020-8680).References
1. Lee JH, Labadie C, Springer CS, Harbison GS. Two-dimensional inverse laplace transform NMR: altered relaxation times allow detection of exchange correlation. J Am Chem Soc. 1993;115(17):7761-7764
2. Washburn KE, Callaghan PT. Tracking pore to pore exchange using relaxation exchange spectroscopy. Phys Rev Lett. 2006;97(17):175502
3. Ramadan S. Diffusion-exchange weighted imaging. Magn Reson Insights. 2009;3:11-19
4. Åslund I, Nowacka A, Nilsson M, Topgaard D. Filter-exchange PGSE NMR determination of cell membrane permeability. J Magn Reson. 2009;200(2):291-295
5. Cai TX, Benjamini D, Komlosh ME, Basser PJ, Williamson NH. Rapid detection of the presence of diffusion exchange. J Magn Reson. 2018;297:17-22
6. Dortch RD, Horch RA, Does MD. Development, simulation, and validation of NRM relaxation-based exchange measurements. J Chem Phys. 2009;131:164502
7. Bai R, Benjamini D, Cheng J, Basser PJ. Fast, accurate 2D-MR relaxation exchange spectroscopy (REXSY): Beyond compressed sensing. J Chem Phys. 2016;145:154202
8. Cai TX, Williamson N, Ravin R, Basser PJ. Multiexponential analysis of diffusion exchange times reveals a distinct exchange process associated with metabolic activity. Proc Intl Soc Mag Reson Med. 2023;31:5017
Figures