1309
Real-time radiation beam imaging on an MR linear accelerator using quantitative T1 mapping1Physical Sciences Platform, Sunnybrook Research Institute, Toronto, ON, Canada, 2Medical Biophysics, University of Toronto, Toronto, ON, Canada, 3Radiation Oncology, Sunnybrook Health Sciences Centre, Toronto, ON, Canada
Synopsis
Keywords: Novel Contrast Mechanisms, Radiotherapy, MR-Linac, radiation dosimetry
Motivation: Direct imaging of radiation beam effects could enable more accurate dosimetry and in vivo dose verification.
Goal(s): Our goal was to detect immediate changes in T1 relaxation due to water radiolysis induced oxygen depletion.
Approach: We used dynamic T1 mapping on an MR-Linac to simultaneously irradiate and image water phantoms.
Results: We observed real-time changes in T1 with a T1/Dose slope of 0.71 ms/Gy. The current sensitivity limit was estimated to be 3 Gy for a 10 min scan. Three-dimensional spatial patterns in T1 were consistent with the predicted dose profile.
Impact: Real-time visualization of radiation beam effects using quantitative T1 mapping may enable new radiation dosimetry methods. This study may lead to volumetric in vivo dose verification and imaging of transient oxygen depletion in high dose rate (“FLASH”) radiotherapy.
Background
MR-Linac systems enable concurrent irradiation and imaging.1 Direct imaging of radiation beam effects could enable more accurate dosimetry and in vivo dose verification, potentially enabling smaller treatment margins. Previous studies found T1-weighted intensity changes in aqueous dissolved free radical scavenger solutions irradiated on a 0.35T MR-Linac.2 It was hypothesized that dissolved oxygen depletion during water radiolysis was the primary mechanism. In this abstract, we investigate the feasibility of using quantitative T1 mapping and a 1.5T MR-Linac to detect immediate changes in T1 relaxation during water radiolysis.Methods
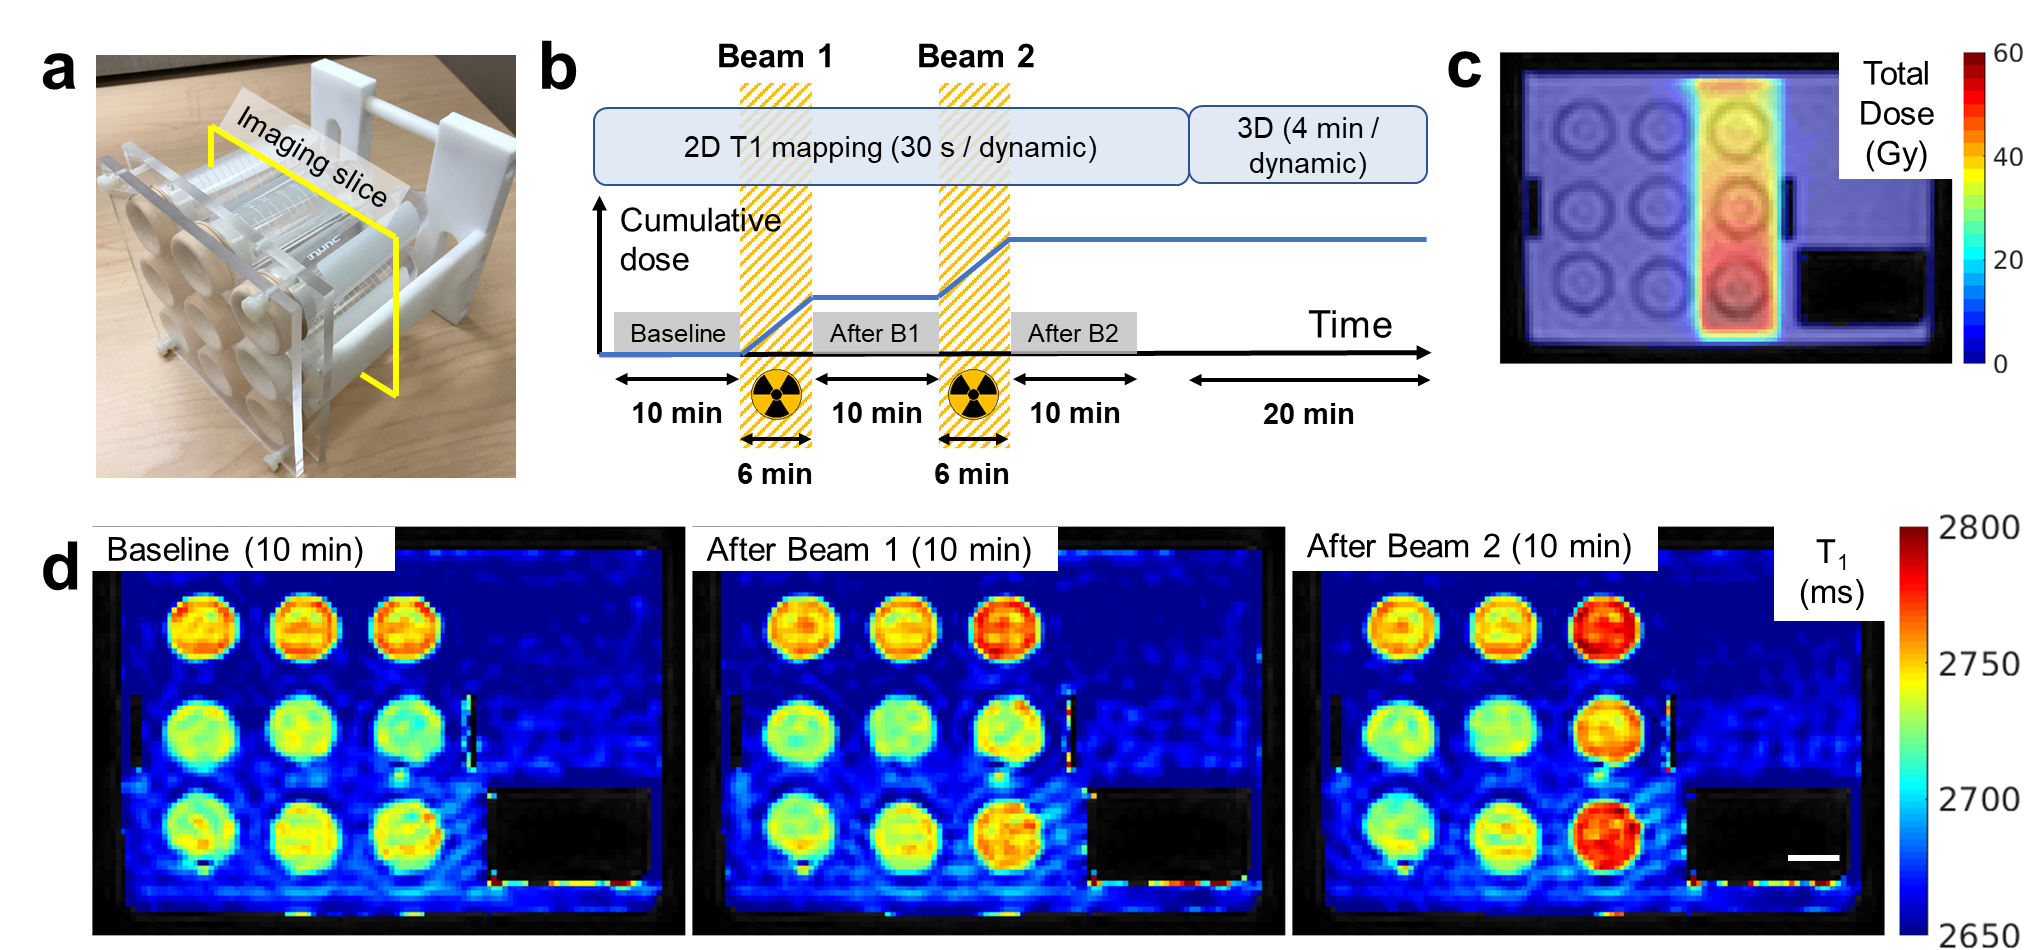
Sample preparation: 50 mL tubes were filled with ultrapure Milli-Q water at atmospheric pressure, sealed using rubber septa to prevent gas exchange (Figure 1A), and placed in a styrofoam box filled with tap water at ambient room temperature (20 °C).MR acquisition: Imaging used a 1.5T Elekta Unity MR-Linac (Elekta AB, Stockholm, Sweden). Dynamic T1/B0 maps were acquired using dual gradient-echo Look-Locker inversion recovery (4x4x8 mm3 resolution, TR/TE1/TE2 = 7.0/1.9/4.8 ms, FA 7°, maximum TI 15846 ms, 40 TIs, inversion spacing 30 s, 8-channel anterior/posterior array). Look-Locker 3-parameter fitting was used to obtain 2D (30 s per dynamic) and 3D (6 slices, 4 min per dynamic) T1 maps.3,4
Beam-on imaging: The experimental scheme and radiation plan are shown in Figure 1B and 1C. A radiation plan from a single gantry angle (180°, from underneath the bed) was designed using the Monaco treatment planning system (Elekta AB, Stockholm, Sweden) to irradiate one column of a 3x3 grid of tubes with a total of 6000 monitor units delivered in two irradiations lasting 6 min each. Dynamic T1/B0 maps were obtained over 70 minutes concurrent with irradiation. Voxelwise univariate t-tests (false discovery rate q=0.05) were used to compare mean T1s before and after irradiation.
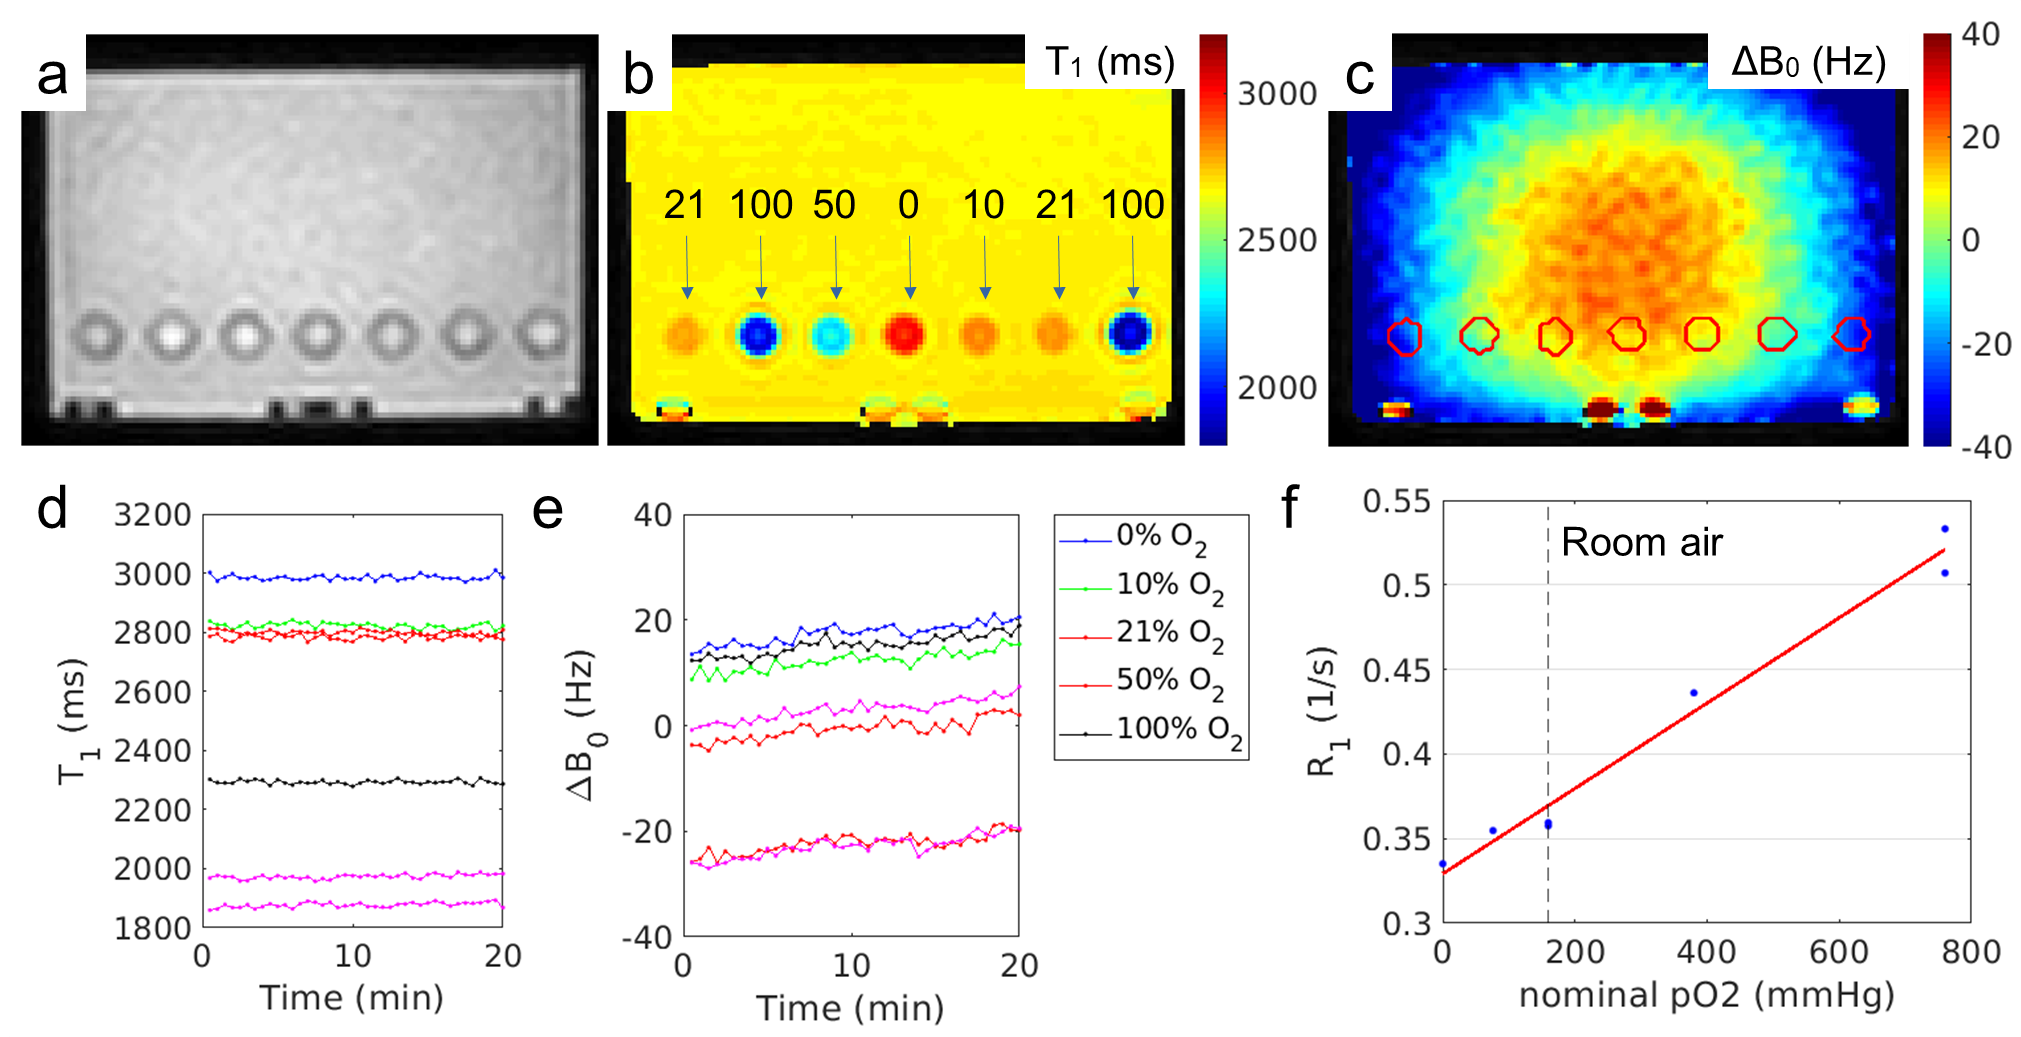
Dissolved oxygen relaxivity measurement: Dissolved O2 concentrations were varied by bubbling a nitrogen/oxygen gas mixture through water for 10 minutes (total flow rate 300 mL/min, pO2/pN2 ratios 0%/100%, 10%/90%, 50%/50%, 100%/0%, 21%/79% [room air]). 2D and 3D T1 maps of 15 mL samples were obtained for 20 minutes each.
Results
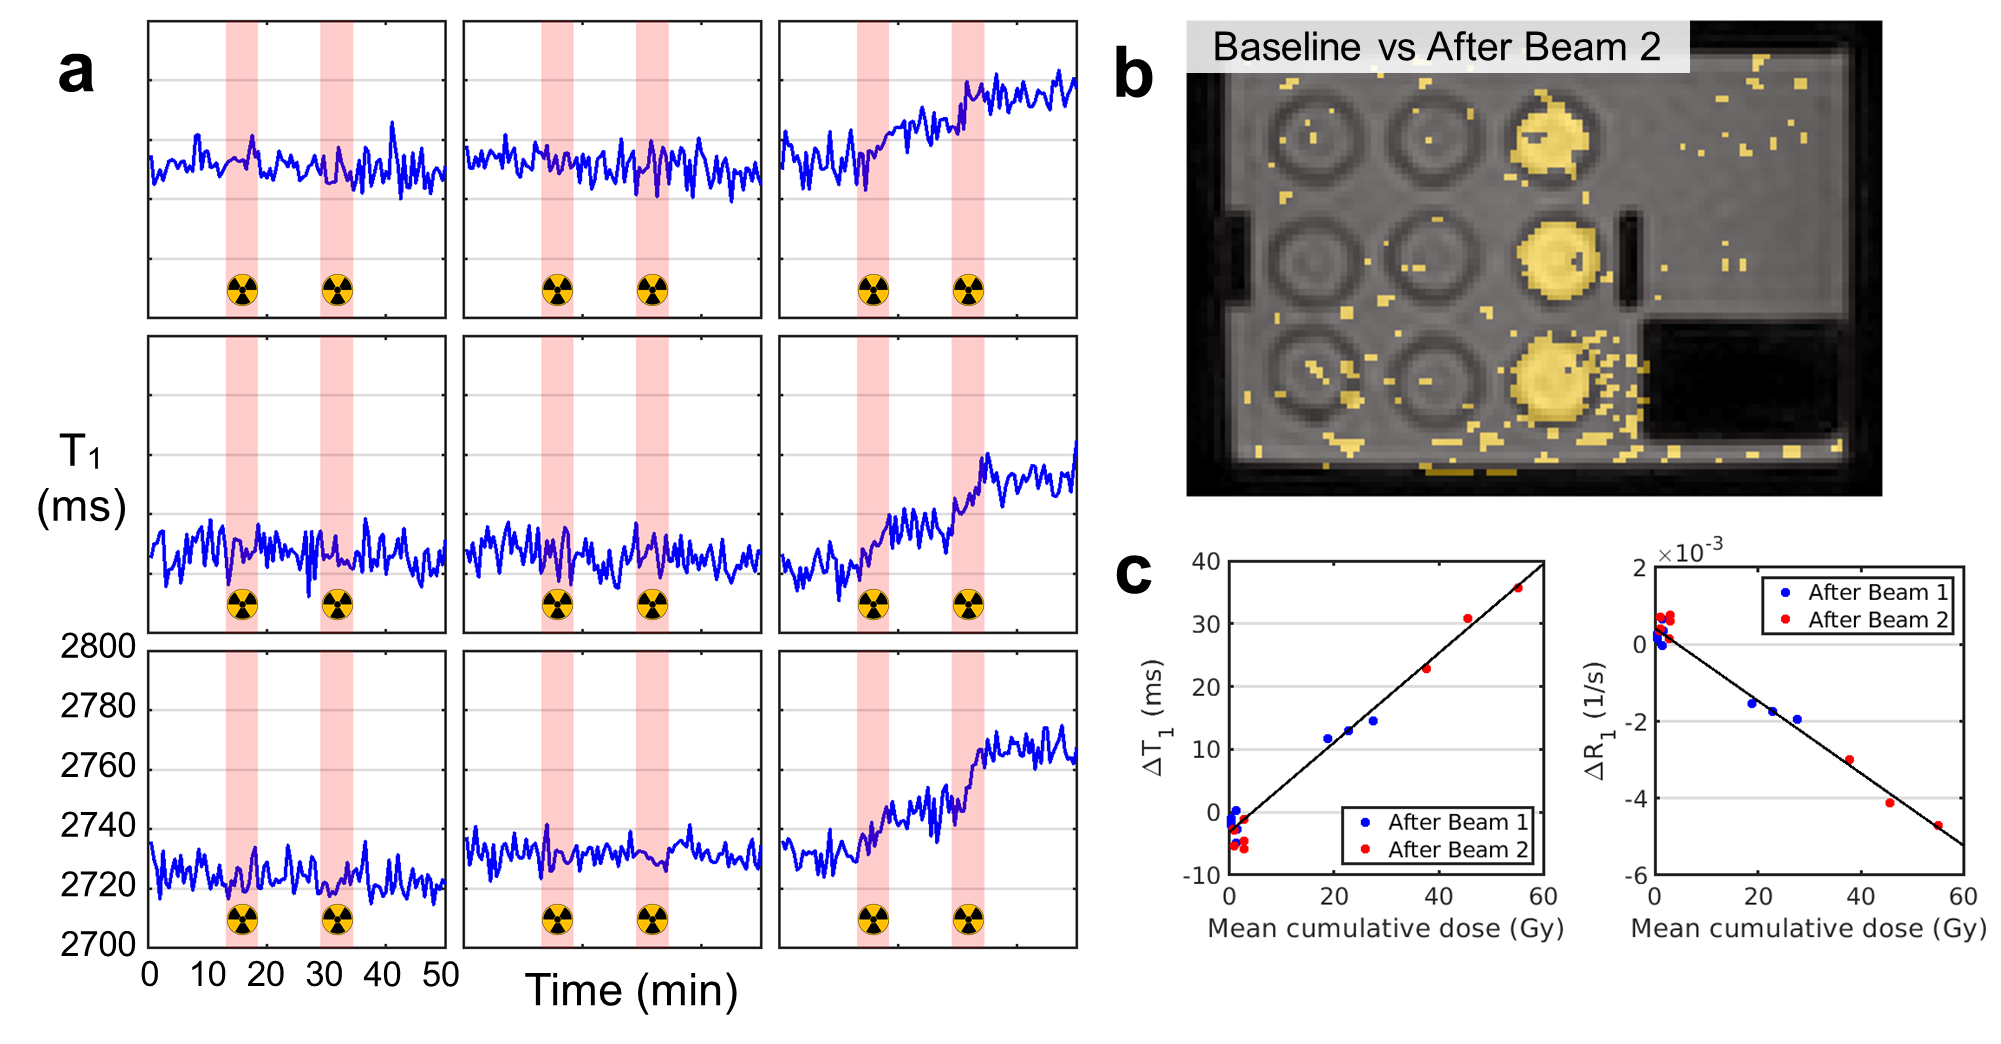
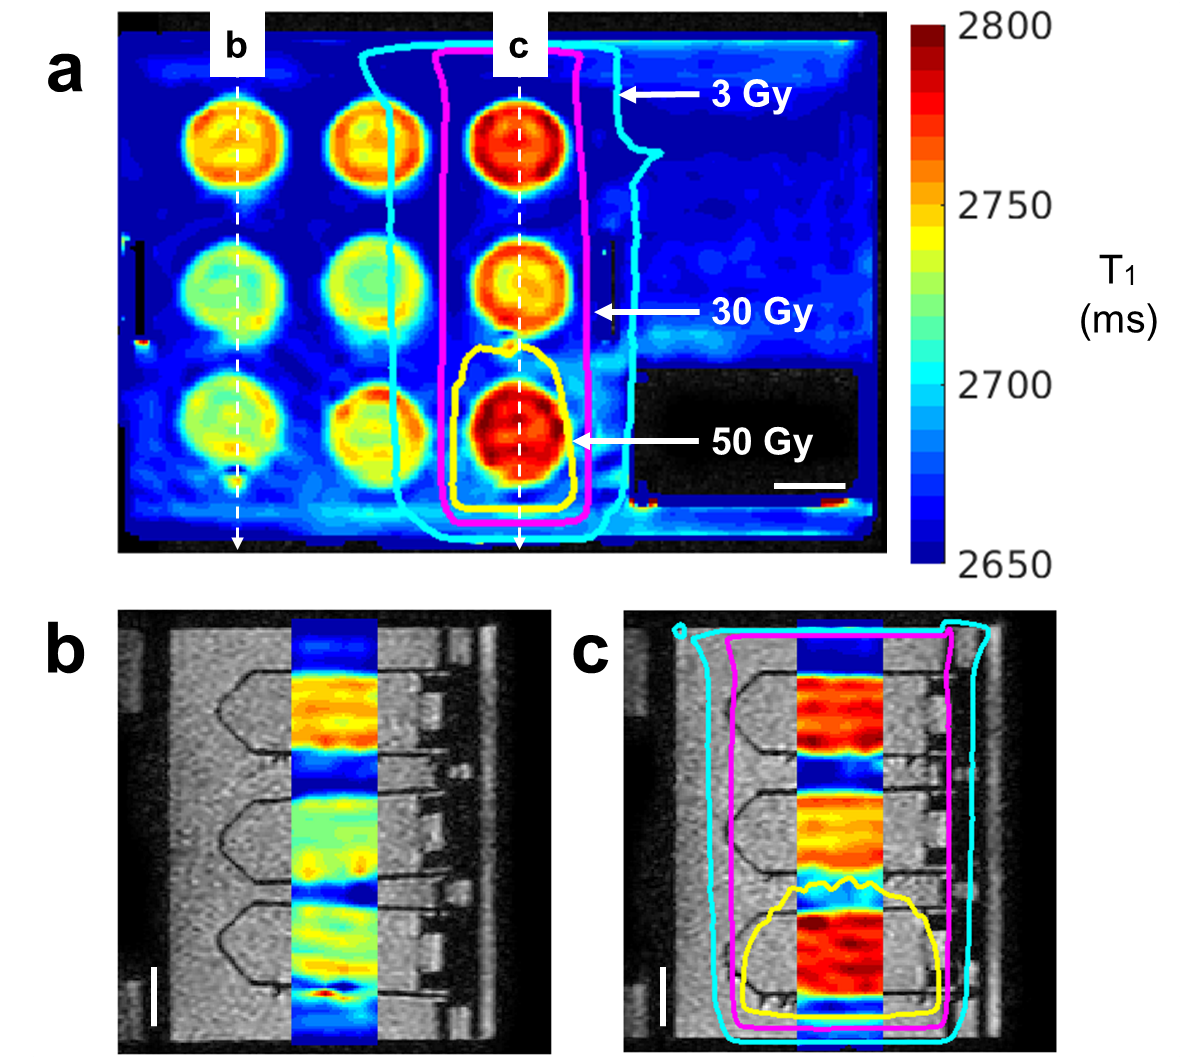
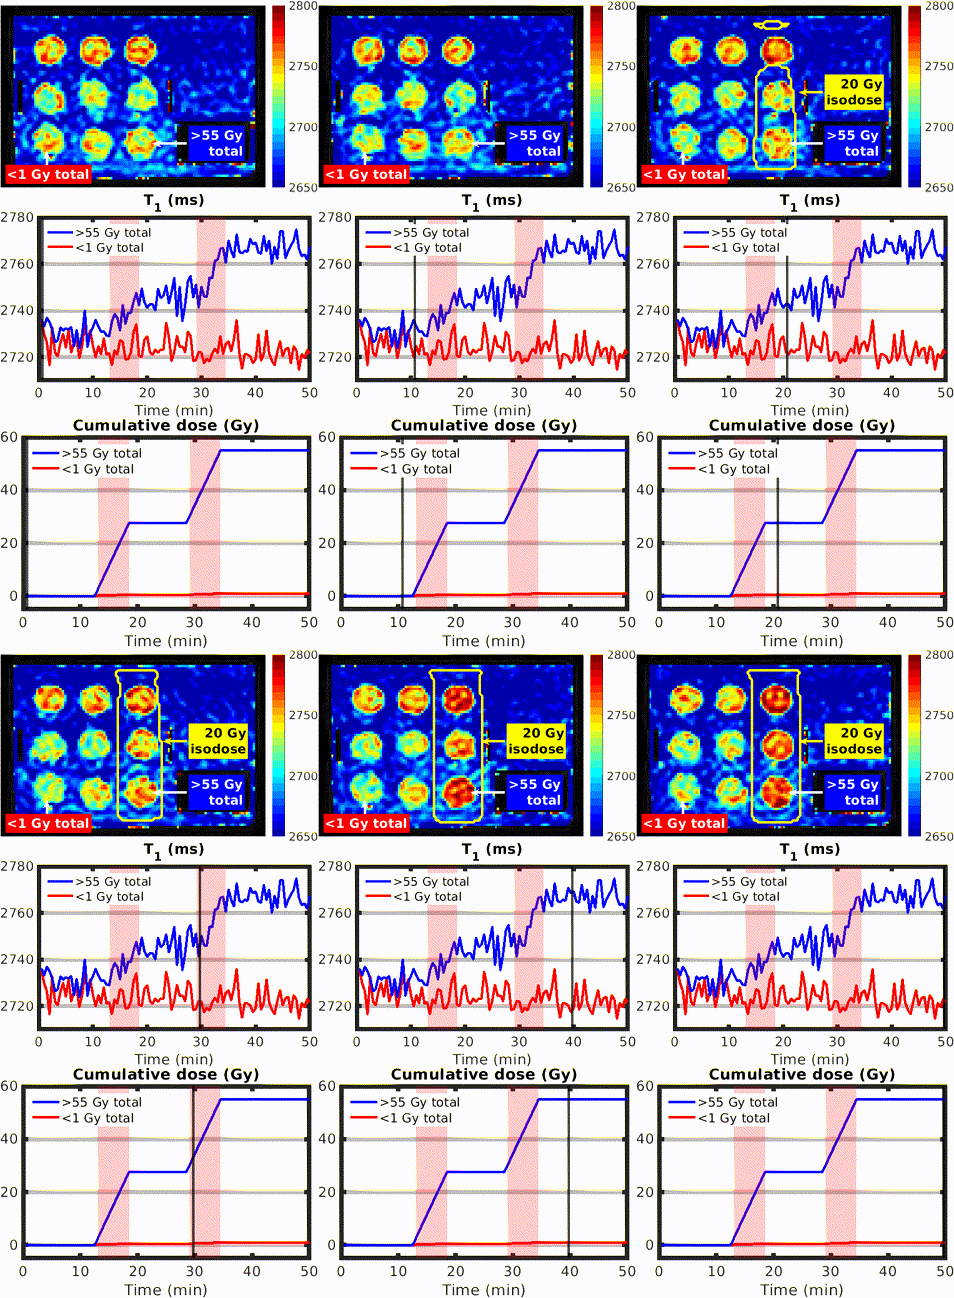
Figure 1D shows T1 increases within irradiated tubes, with minimal qualitative change in tubes receiving low dose and in the surrounding tap water. Figure 2 shows T1 dynamics during irradiation. A linear increase is observed during the beam-on periods. Voxelwise changes within the radiation field were observable. Mean T1 changes between baseline and each post-beam period were used to estimate ΔT1/Dose of 0.71 ms/Gy and ΔR1/Dose of -9.4x10⁻⁵ s-1/Gy. Figure 3 shows corresponding post-irradiation 3D T1 maps, with elevated T1 within the irradiated field compared to low-dose regions. Figure 4 shows that T1 increases are visible in single frames.The dissolved oxygen relaxivity r1,O2 was estimated to be 0.25x10⁻³ s-1/mmHg (Figure 5). The maximum temporal standard deviation in single-echo T1 across all tubes was 13 ms (max SD/mean 0.57%), with no evidence of non-normality (Kolmogorov-Smirnov; p>0.05) or correlation between T1s fitted from either echo. T1 and B0 drifts over a 20 min period were estimated to be at most 20 ms and 6 Hz, respectively. Using the r1,O2 value for calibration, the dissolved pO2/Dose was estimated to be -0.38 mmHg/Gy.
Discussion
Various MRI contrast mechanisms for visualizing ionizing radiation effects exist, including Fricke oxidation of ferrous ions5,6, gel polymerization7,8, beam-induced thermal convection9, and water radiolysis induced oxygen depletion2. In this study, real-time T1 changes (0.71 ms/Gy) were observed in ultrapure water without any added contrast agent, using a 1.5T MR-Linac.T1 measurements were temporally uncorrelated, suggesting that signal averaging could improve the T1 measurement precision. The current T1 and dose precision (SEM) for a 10 min scan are estimated to be 2 ms and 3 Gy, respectively.
Calibration experiments supported the working hypothesis that changes in T1 primarily result from oxygen depletion, although the estimated pO2/Dose (-0.38 mmHg/Gy) was larger than literature estimates based on simulation2 (-0.14 μM/Gy = -0.08 mmHg/Gy, assuming a conversion factor of 0.58 mmHg/μM). Independent dissolved oxygen measurements are needed for validation. The measured r1,O2 agreed with empirical models for oxygen relaxivity.10
T1 changes were observed in ultrapure water but not deionized or tap water. We speculate that trace organic compounds, found in non-ultrapure water, scavenge free radicals produced during radiolysis.
Conclusions
The irradiation of ultrapure water using a 1.5T MR-Linac resulted in measurable real-time T1 changes (0.71 ms/Gy), which could be imaged in both 2D and 3D. The feasibility of in vivo measurement should be assessed in biological-like phantoms.Acknowledgements
We thank the following individuals for their assistance: Khang Vo and Danielle Letterio for MR-Linac operation; Brian Keller, Ryan Oglesby and Lingyue Sun for useful discussions; Michael Pozzobon (machine shop). We gratefully acknowledge the Natural Sciences and Engineering Research Council of Canada (NSERC RGPIN-2017-06596) and the Ontario ERA for funding. Brandon Tran and Liam Lawrence contributed equally to this work as first authors.References
1. Otazo, R. et al. MRI-guided Radiation Therapy: An Emerging Paradigm in Adaptive Radiation Oncology. Radiology 298, 248–260 (2021).2. Wancura, J., Egan, J., Sajo, E. & Sudhyadhom, A. MRI of radiation chemistry: First images and investigation of potential mechanisms. Med. Phys. 50, (2023).
3. Look, D. C. & Locker, D. R. Time saving in measurement of NMR and EPR relaxation times. Rev. Sci. Instrum. 41, 250–251 (1970).
4. Deichmann, R. Fast high-resolution T1 mapping of the human brain. Magn. Reson. Med. 54, (2005).
5. Fricke, H. & Morse, S. XIII.The action of X-rays on ferrous sulphate solutions. Lond. Edinb. Dublin Philos. Mag. J. Sci. 7, 129–141 (1929).
6. Gore, J. C., Kang, Y. S. & Schulz, R. J. Measurement of radiation dose distributions by nuclear magnetic resonance (NMR) imaging. Phys. Med. Biol. 29, 1189–1197 (1984).
7. Maryanski, M. J., Ibbott, G. S., Eastman, P., Schulz, R. J. & Gore, J. C. Radiation therapy dosimetry using magnetic resonance imaging of polymer gels. Med. Phys. 23, 699–705 (1996).
8. De Deene, Y. et al. Towards real-time 4D radiation dosimetry on an MRI-Linac. Phys. Med. Biol. 65, 225031 (2020).
9. Gantz, S. et al. Direct visualization of proton beam irradiation effects in liquids by MRI. Proc. Natl. Acad. Sci. U. S. A. 120, e2301160120 (2023).
10. Bluemke, E., Stride, E. & Bulte, D. P. A simplified empirical model to estimate oxygen relaxivity at different magnetic fields. NMR Biomed. 35, e4625 (2022).
Figures