1308
Evaluating simultaneously derived T2, T2*, vCBV and OEF from GE-SE EPIK in brain tumour patients1Institute of Neuroscience and Medicine - 4, Forschungszentrum Juelich GmbH, Jülich, Germany, 2Cardiovascular Research Institute Maastricht (CARIM), Maastricht University, Maastricht, Netherlands, 3Department of Nuclear Medicine, RWTH Aachen University Hospital, Aachen, Germany, 4Department of Radiology and Nuclear Medicine, Maastricht University Medical Center (MUMC+), Maastricht, Netherlands, 5Institute of Neuroscience and Medicine - 11, Forschungszentrum Juelich GmbH, Jülich, Germany, 6JARA-BRAIN - Translational Medicine, Aachen, Germany, 7Department of Neurology, RWTH Aachen University Hospital, Aachen, Germany
Synopsis
Keywords: Multi-Contrast, Oxygenation, Brain Tumors, Cancer, Oxygen Extraction Fraction, hybrid MR-PET
Motivation: Multi-contrast GE/SE acquisitions provide versatile, simultaneously acquired MR parameters, with fast, non-invasive OEF quantification proving potentially exceptionally valuable in clinical practice.
Goal(s): The tumour characterisation capability of 10-echo GE-SE EPIK-derived MR parameters was evaluated in standardised tumour VOIs compared to healthy brain tissue.
Approach: A full-brain 2-minute protocol was acquired from 18 tumour patients during hybrid 3T MR and FET-PET acquisitions. Quantified MR parameters were analyzed in tumour VOIs defined by FET-PET.
Results: The increased T2/T2* values and decreased vCBV/OEF obtained using 2-minute GE-SE EPIK acquisitions were in agreement with literature values.
Impact: Whole-brain T2, T2*, vCBV, and OEF quantification can be obtained within a 2-minute TA using 10-echo GE-SE EPIK MRI, revealing changes in tumour VOIs in agreement with literature values, potentially providing fast clinical access to MR parameters, especially OEF.
Introduction
Combining gradient-echo (GE) and spin-echo (SE) acquisitions provides a versatile approach for investigating tumour heterogeneity1, including parameters such as relaxation times, blood volume, and oxygenation. One crucial biomarker for assessing disrupted brain metabolism in various medical conditions is the oxygen extraction fraction (OEF)2. Currently, the standard method for OEF quantification is 15O-PET, but logistical challenges associated with its short 2-minute half-life limit its practicality. The growing interest in MR solutions for OEF quantification has led to the development of the 10-echo GE-SE EPIK sequence3, which offers rapid, contrast agent-free quantification of T2, T2*, venous cerebral blood volume (vCBV), and OEF. Previous work has highlighted the advantages of EPIK4 over EPI-based methods, including improved spatial and temporal resolution and greater number of acquired echoes, particularly two pure SEs. The accuracy of this approach in determining T2/T2* values in healthy subjects and its sensitivity to OEF during breath-hold experiments have been demonstrated. Extending a previous preliminary tumour patient investigation5, this work applies the GE-SE EPIK method to a larger patient cohort and investigates changes in T2/T2*/R2’/vCBV/OEF in standardised tumour ROIs based on FET-PET thresholds.Methods
The 10-echo GE-SE EPIK sequence was used to acquire full-brain datasets within 2 minutes at a 3T hybrid MR-PET scanner concurrently with amino acid O-(2-[18F]fluoroethyl)-L-tyrosine (FET) PET6,7. Eighteen patients with brain tumours were scanned (glioblastoma, n=8; astrocytoma WHO grades 2-4, n=4; oligodendroglioma WHO grades 2-3, n=2; brain metastases, n=4). The whole-brain 44-slice acquisition was performed with TR=6.8s, TE=10/20/41/51/66/76/86/107/117/132ms. Figure 1 shows the sequence diagram, including exemplary signal envelopes for healthy and tumour voxels, along with a schematic of the vCBV calculation. Figure 2 summarises further details relating to patient characteristics and primary tumour histology.T2/T2* were quantified from the acquired GE-SE EPIK 10-echo signal evolution using voxel-wise nonlinear least-squares fitting. Next, vCBV was calculated from the ratio of the extrapolated, Sextr, and measured SE signal, S(TESE)8:
$$vCBV=\frac{S_{extr}(TE_{SE})}{S(TE_{SE})}$$
Finally, OEF values were computed by (Hct=0.36, Δ𝜒0=0.246 ppm per unit Hct)9:
$$OEF=\frac{R_2^{'}}{vCBV\cdot3/4\cdot\pi\cdot\gamma\cdot\Delta\chi_0\cdot\text{Hct} \cdot{B_0}}$$
The tumour VOIs were identified by a threshold of 1.6•SUVbackground (standardised uptake value) from FET-PET. Relative means of MR parameters (T2/T2*/R2’/vCBV/OEF) were computed by normalising their mean values from tumour regions to healthy contralateral backgrounds.
Results
Mean values of the quantified MR parameters (T2/T2*/R2’/vCBV/OEF) in the tumour VOI are summarised for all patients in Figure 2. Figure 3 provides a visual comparison between MR-OEF and FET-SUV, presenting a single slice from four representative patients covering the different tumour types in this study. The remaining MR parameter maps are presented in Figure 4, along with the tumour VOI. The quantified relative means for all patients are shown in Figure 5a, including tumour brain ratios (TBR) from PET. Average relative means (Fig.5b) reveal a significant increase in T2/T2*, a significant decrease in vCBV/OEF, and no significant change in R2’ when comparing tumour VOI to healthy background tissue based on p-values from one-sample t-tests.Discussion and Conclusion
The changes in GE-SE EPIK-derived MR parameters in the tumour VOI compared to healthy contralateral tissue agree with literature findings10-12. In particular, a decrease in OEF is expected to reflect hypoxia13, a known characteristic of brain tumours14. A closer inspection of the quantitative MR maps reveals a more global effect that extends beyond the tumour volume, the detailed effect and interpretation of which will be the focus of future work. In general, OEF is a biomarker of high interest, and its quantification based on GE-SE EPIK yielded reasonable background values in healthy tissue areas. While the tumour VOI analyses suggest the expected OEF decrease, the sensitivity of the maps to imaging artefacts hinders clear differentiation between tumour and method-related changes. This is probably caused by relatively poor SNR conditions in the last echo images, resulting from relatively long TEs caused by gradient system limitations. With a view towards the protocol optimisation achieved in our previously conducted healthy volunteer validation study3, the robustness of the MR quantification is expected to be improved in the future. Further, a more detailed analysis of a larger patient cohort will be conducted to investigate a possible correlation between OEF and FET-PET SUV as well as the potential to differentiate tumour progression from treatment-related changes using a combination of the two parameters.Overall, the multi-parametric output of the 2-minute GE-SE EPIK acquisition underlines its potential. The observed changes in tumour VOIs agree with literature findings and appear to reveal extended global effects. Nevertheless, the results require careful interpretation as additional artefact-related features in the parameter maps limit clear disease identification. Future investigations and optimisations are required to improve the identification and accuracy performance.
Acknowledgements
The authors thank the MTAs and organizational staff involved in the patient measurements. Further, the authors thank Claire Rick for her contribution.References
[1] K. M. Schmainda et al., “Characterization of a First-Pass Gradient-Echo Spin-Echo Method to Predict Brain Tumor Grade and Angiogenesis,” AJNR Am. J. Neuroradiol., vol. 25, no. 9, pp. 1524–1532, Oct. 2004.
[2] D. Jiang and H. Lu, “Cerebral oxygen extraction fraction MRI: Techniques and applications,” Magn. Reson. Med., p. mrm.29272, May 2022, doi: 10.1002/mrm.29272.
[3] F. Küppers, S. D. Yun, and N. J. Shah, “Development of a novel 10-echo multi-contrast sequence based on EPIK to deliver simultaneous quantification of T2 and T2* with application to oxygen extraction fraction,” Magn. Reson. Med., vol. 88, no. 4, pp. 1608–1623, Oct. 2022, doi: 10.1002/mrm.29305.
[4] M. Zaitsev, K. Zilles, and N. J. Shah, “Shared k-space echo planar imaging with keyhole,” Magn. Reson. Med., vol. 45, no. 1, pp. 109–117, 2001, doi: 10.1002/1522-2594(200101)45:1<109::AID-MRM1015>3.0.CO;2-X.
[5] F. Küppers and et al., “Simultaneous T2/T2* quantification for oxygen extraction fraction estimation using GE-SE EPIK: A preliminary study in brain tumor patients,” presented at the Proc. Intl. Soc. Mag. Reson. Med. 31, 2023, p. 0764.
[6] D. Pauleit, “O-(2-[18F]fluoroethyl)-L-tyrosine PET combined with MRI improves the diagnostic assessment of cerebral gliomas,” Brain, vol. 128, no. 3, pp. 678–687, Jan. 2005, doi: 10.1093/brain/awh399.
[7] L. Caldeira et al., “The Jülich Experience With Simultaneous 3T MR-BrainPET: Methods and Technology,” IEEE Trans. Radiat. Plasma Med. Sci., vol. 3, no. 3, pp. 352–362, May 2019, doi: 10.1109/TRPMS.2018.2863953.
[8] D. A. Yablonskiy, “Quantitation of intrinsic magnetic susceptibility-related effects in a tissue matrix. Phantom study,” Magn. Reson. Med., vol. 39, no. 3, pp. 417–428, Mar. 1998, doi: 10.1002/mrm.1910390312.
[9] X. He and D. A. Yablonskiy, “Quantitative BOLD: Mapping of human cerebral deoxygenated blood volume and oxygen extraction fraction: Default state,” Magn. Reson. Med., vol. 57, no. 1, pp. 115–126, 2007, doi: 10.1002/mrm.21108.
[10] K. Mineura, T. Yasuda, M. Kowada, F. Shishido, T. Ogawa, and K. Uemura, “Positron emission tomographic evaluation of histological malignancy in gliomas using oxygen-15 and fluorine-18-fluorodeoxyglucose,” Neurol. Res., Sep. 1986
[11] C. Preibisch et al., “Characterizing hypoxia in human glioma: A simultaneous multimodal MRI and PET study,” NMR Biomed., vol. 30, no. 11, p. e3775, Nov. 2017, doi: 10.1002/nbm.3775.
[12] P. Vaupel, F. Kallinowski, and P. Okunieff, “Blood flow, oxygen and nutrient supply, and metabolic microenvironment of human tumors: a review,” Cancer Res., vol. 49, no. 23, pp. 6449–6465, Dec. 1989.
[13] K. L. Leenders, “PET: Blood flow and oxygen consumption in brain tumors,” J. Neurooncol., vol. 22, no. 3, pp. 269–273, Oct. 1994, doi: 10.1007/BF01052932.
[14] V. Tóth et al., “MR-based hypoxia measures in human glioma,” J. Neurooncol., vol. 115, no. 2, pp. 197–207, Nov. 2013, doi: 10.1007/s11060-013-1210-7.
Figures
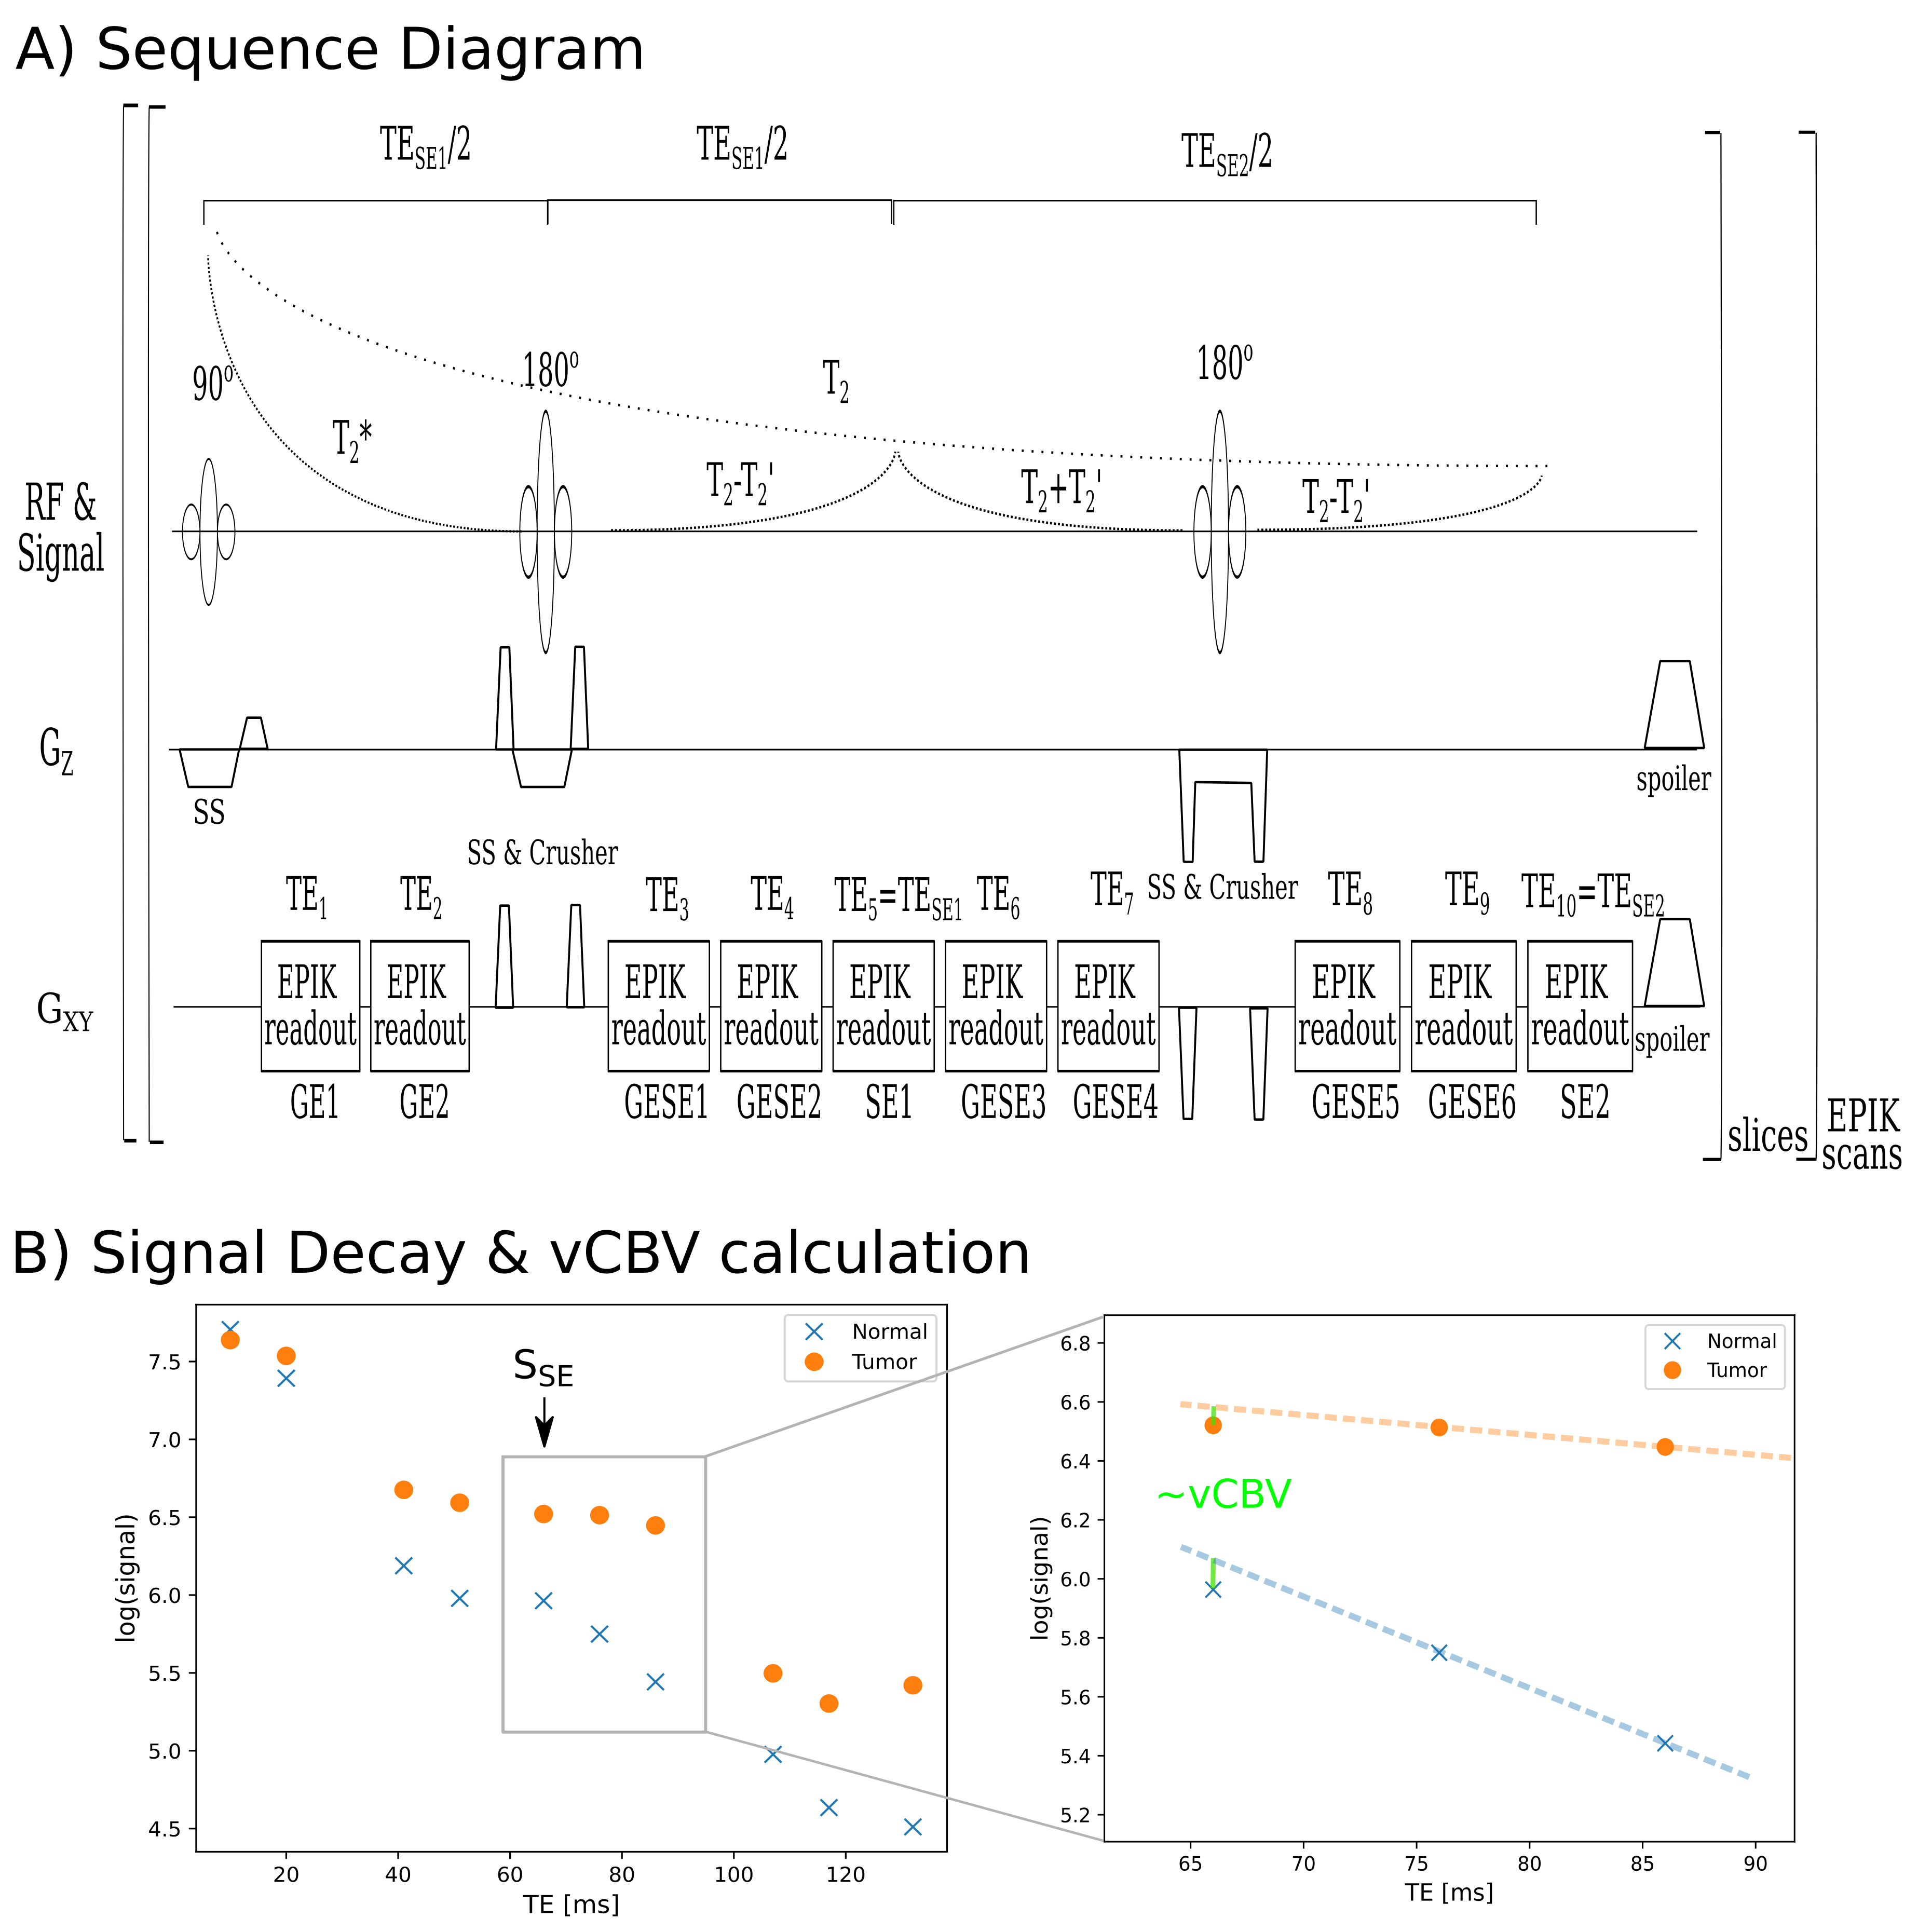
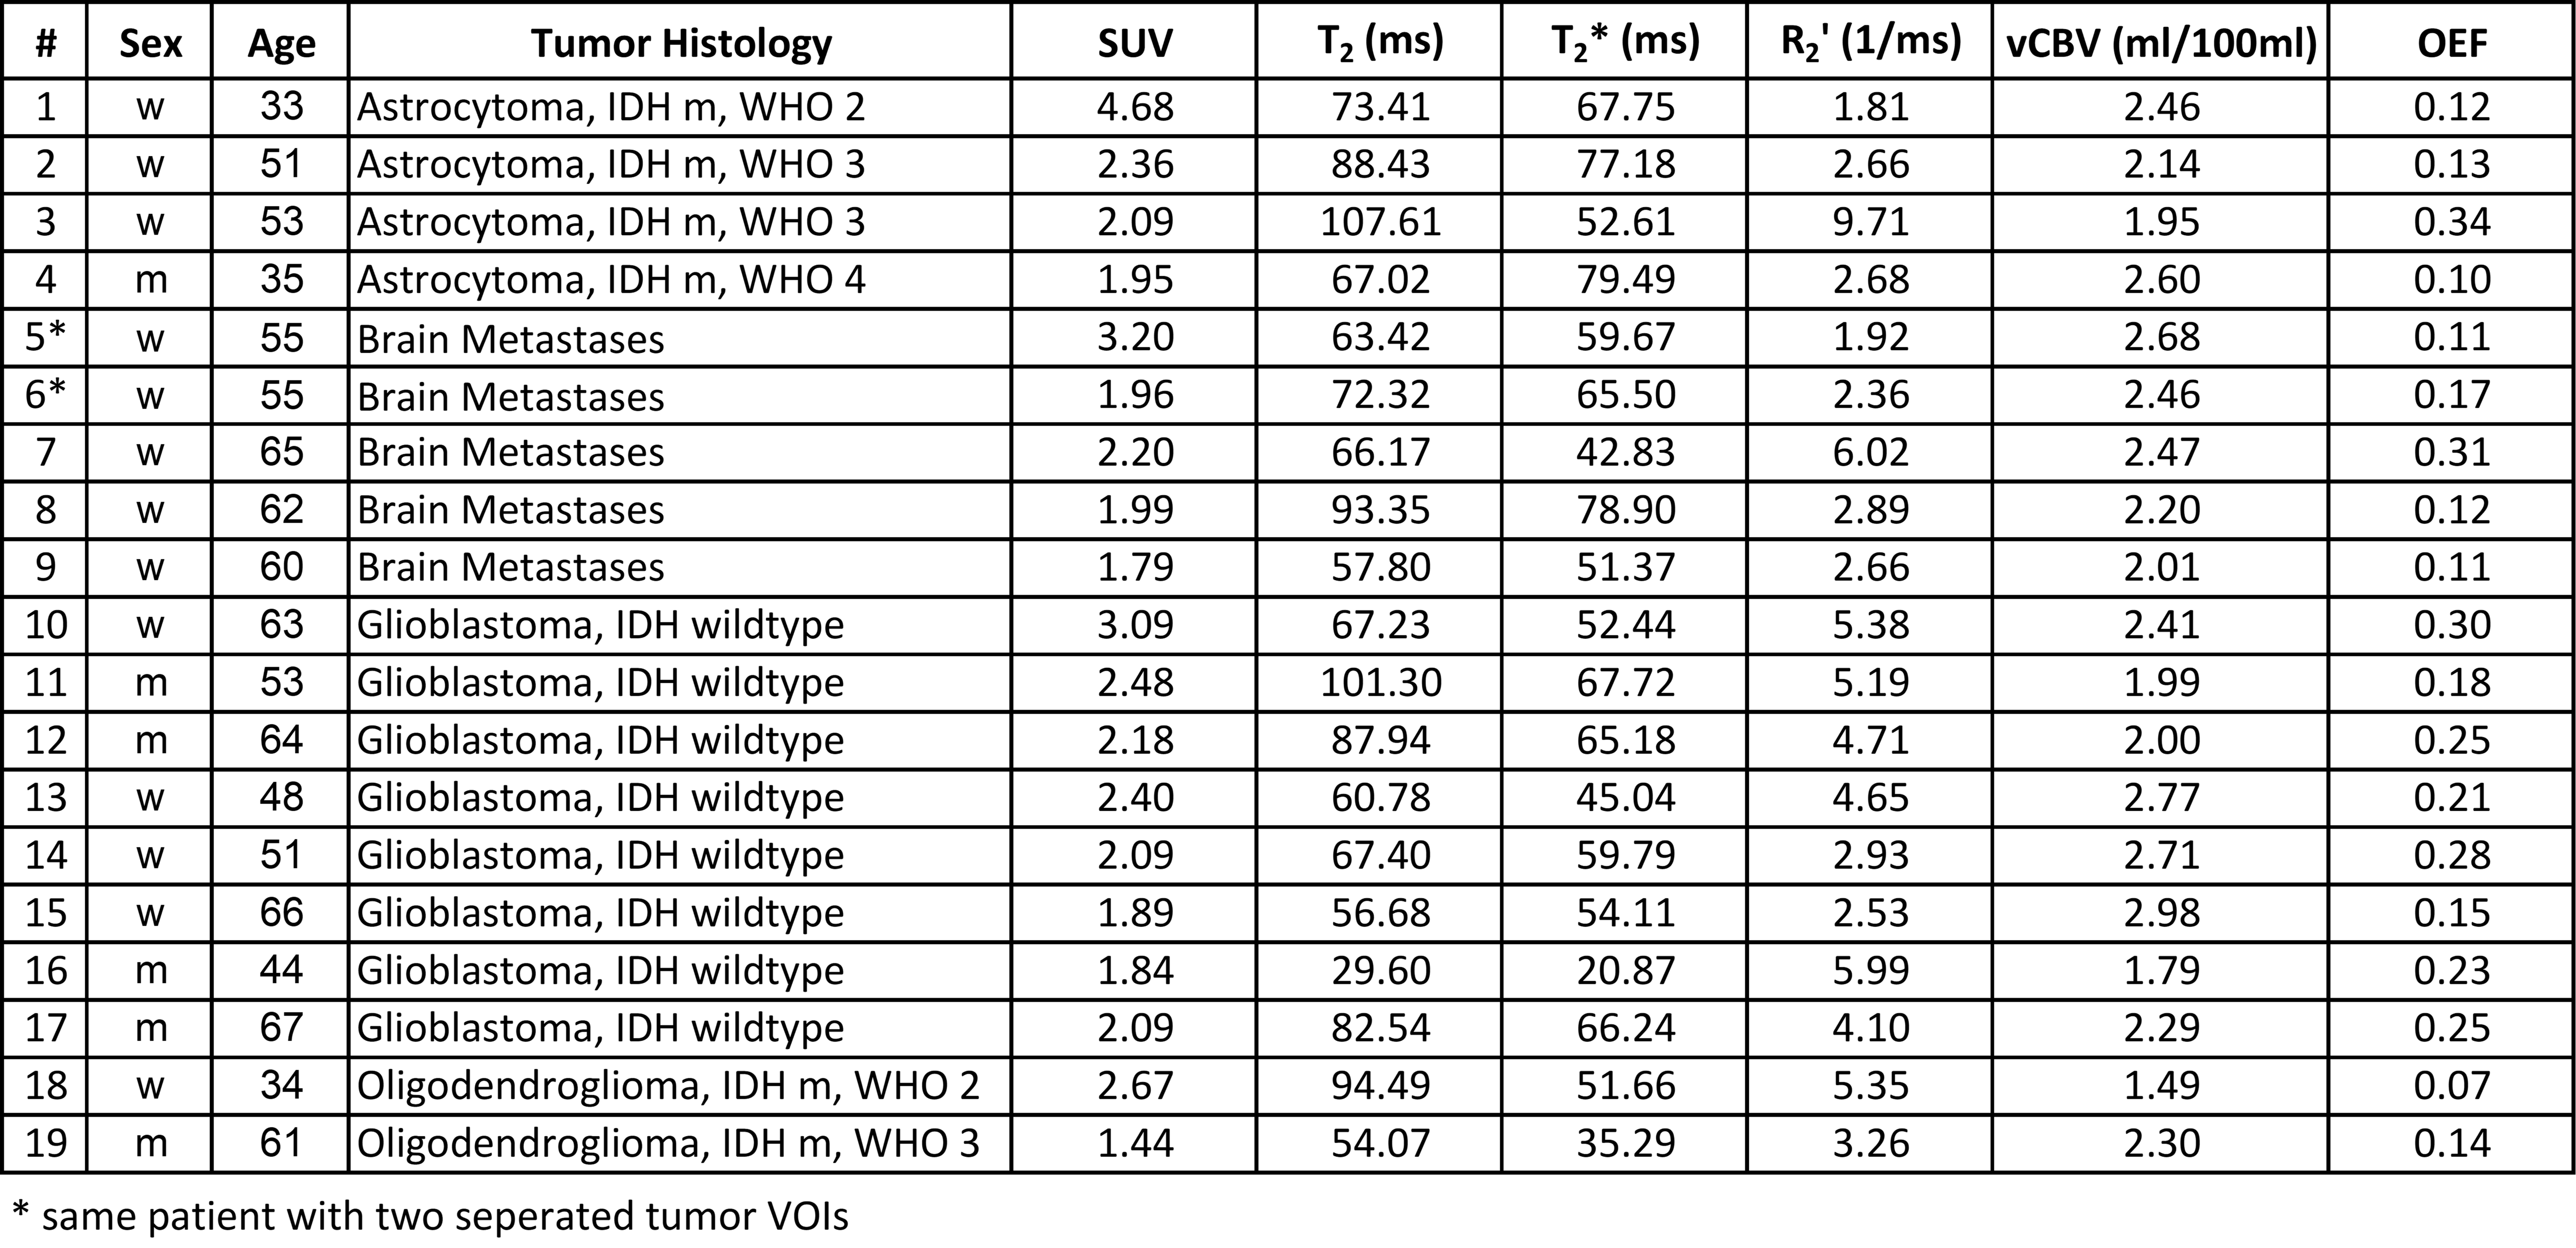
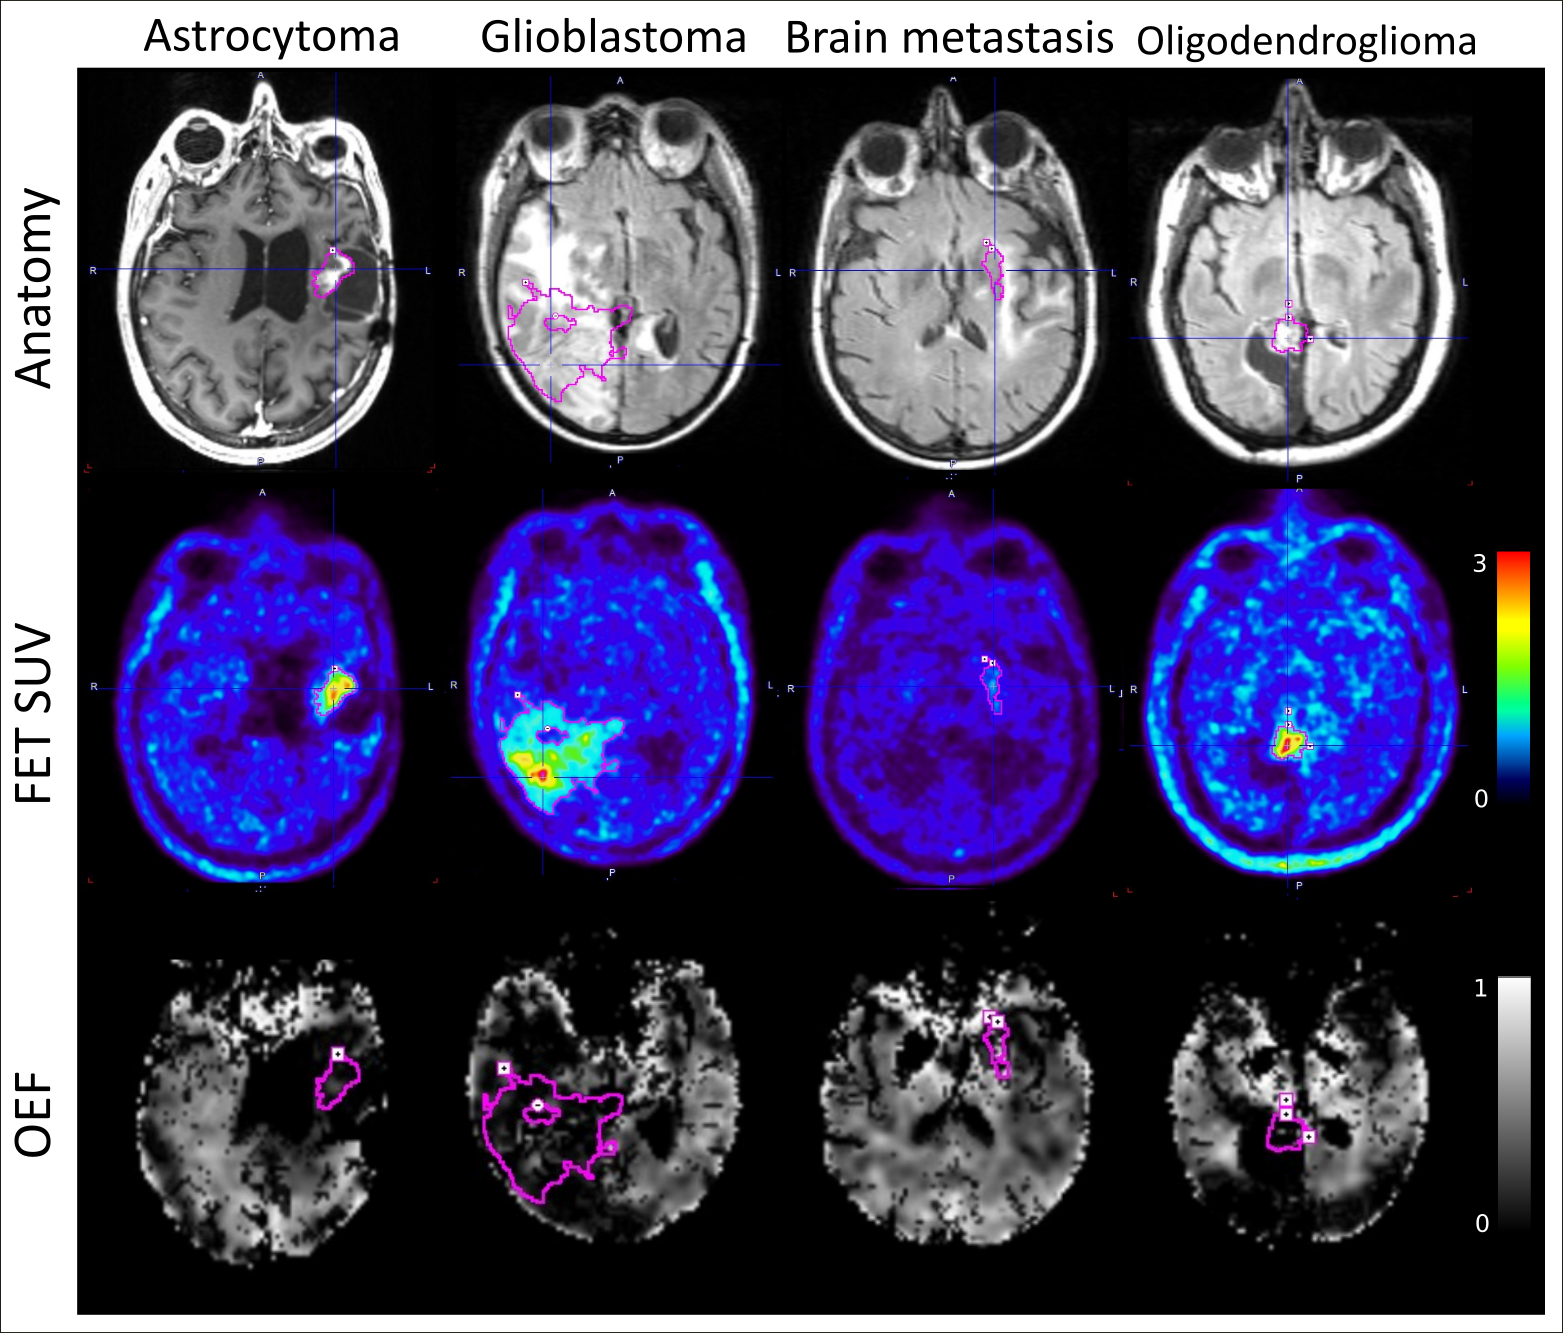
Figure 3: Visual comparison of four tumour patients representing each of the four tumour types in this study. Anatomic images along with FET SUV from PET and OEF derived from GE-SE EPIK are shown. The selected tumour VOIs defined by the threshold in FET PET uptake values are overlayed.
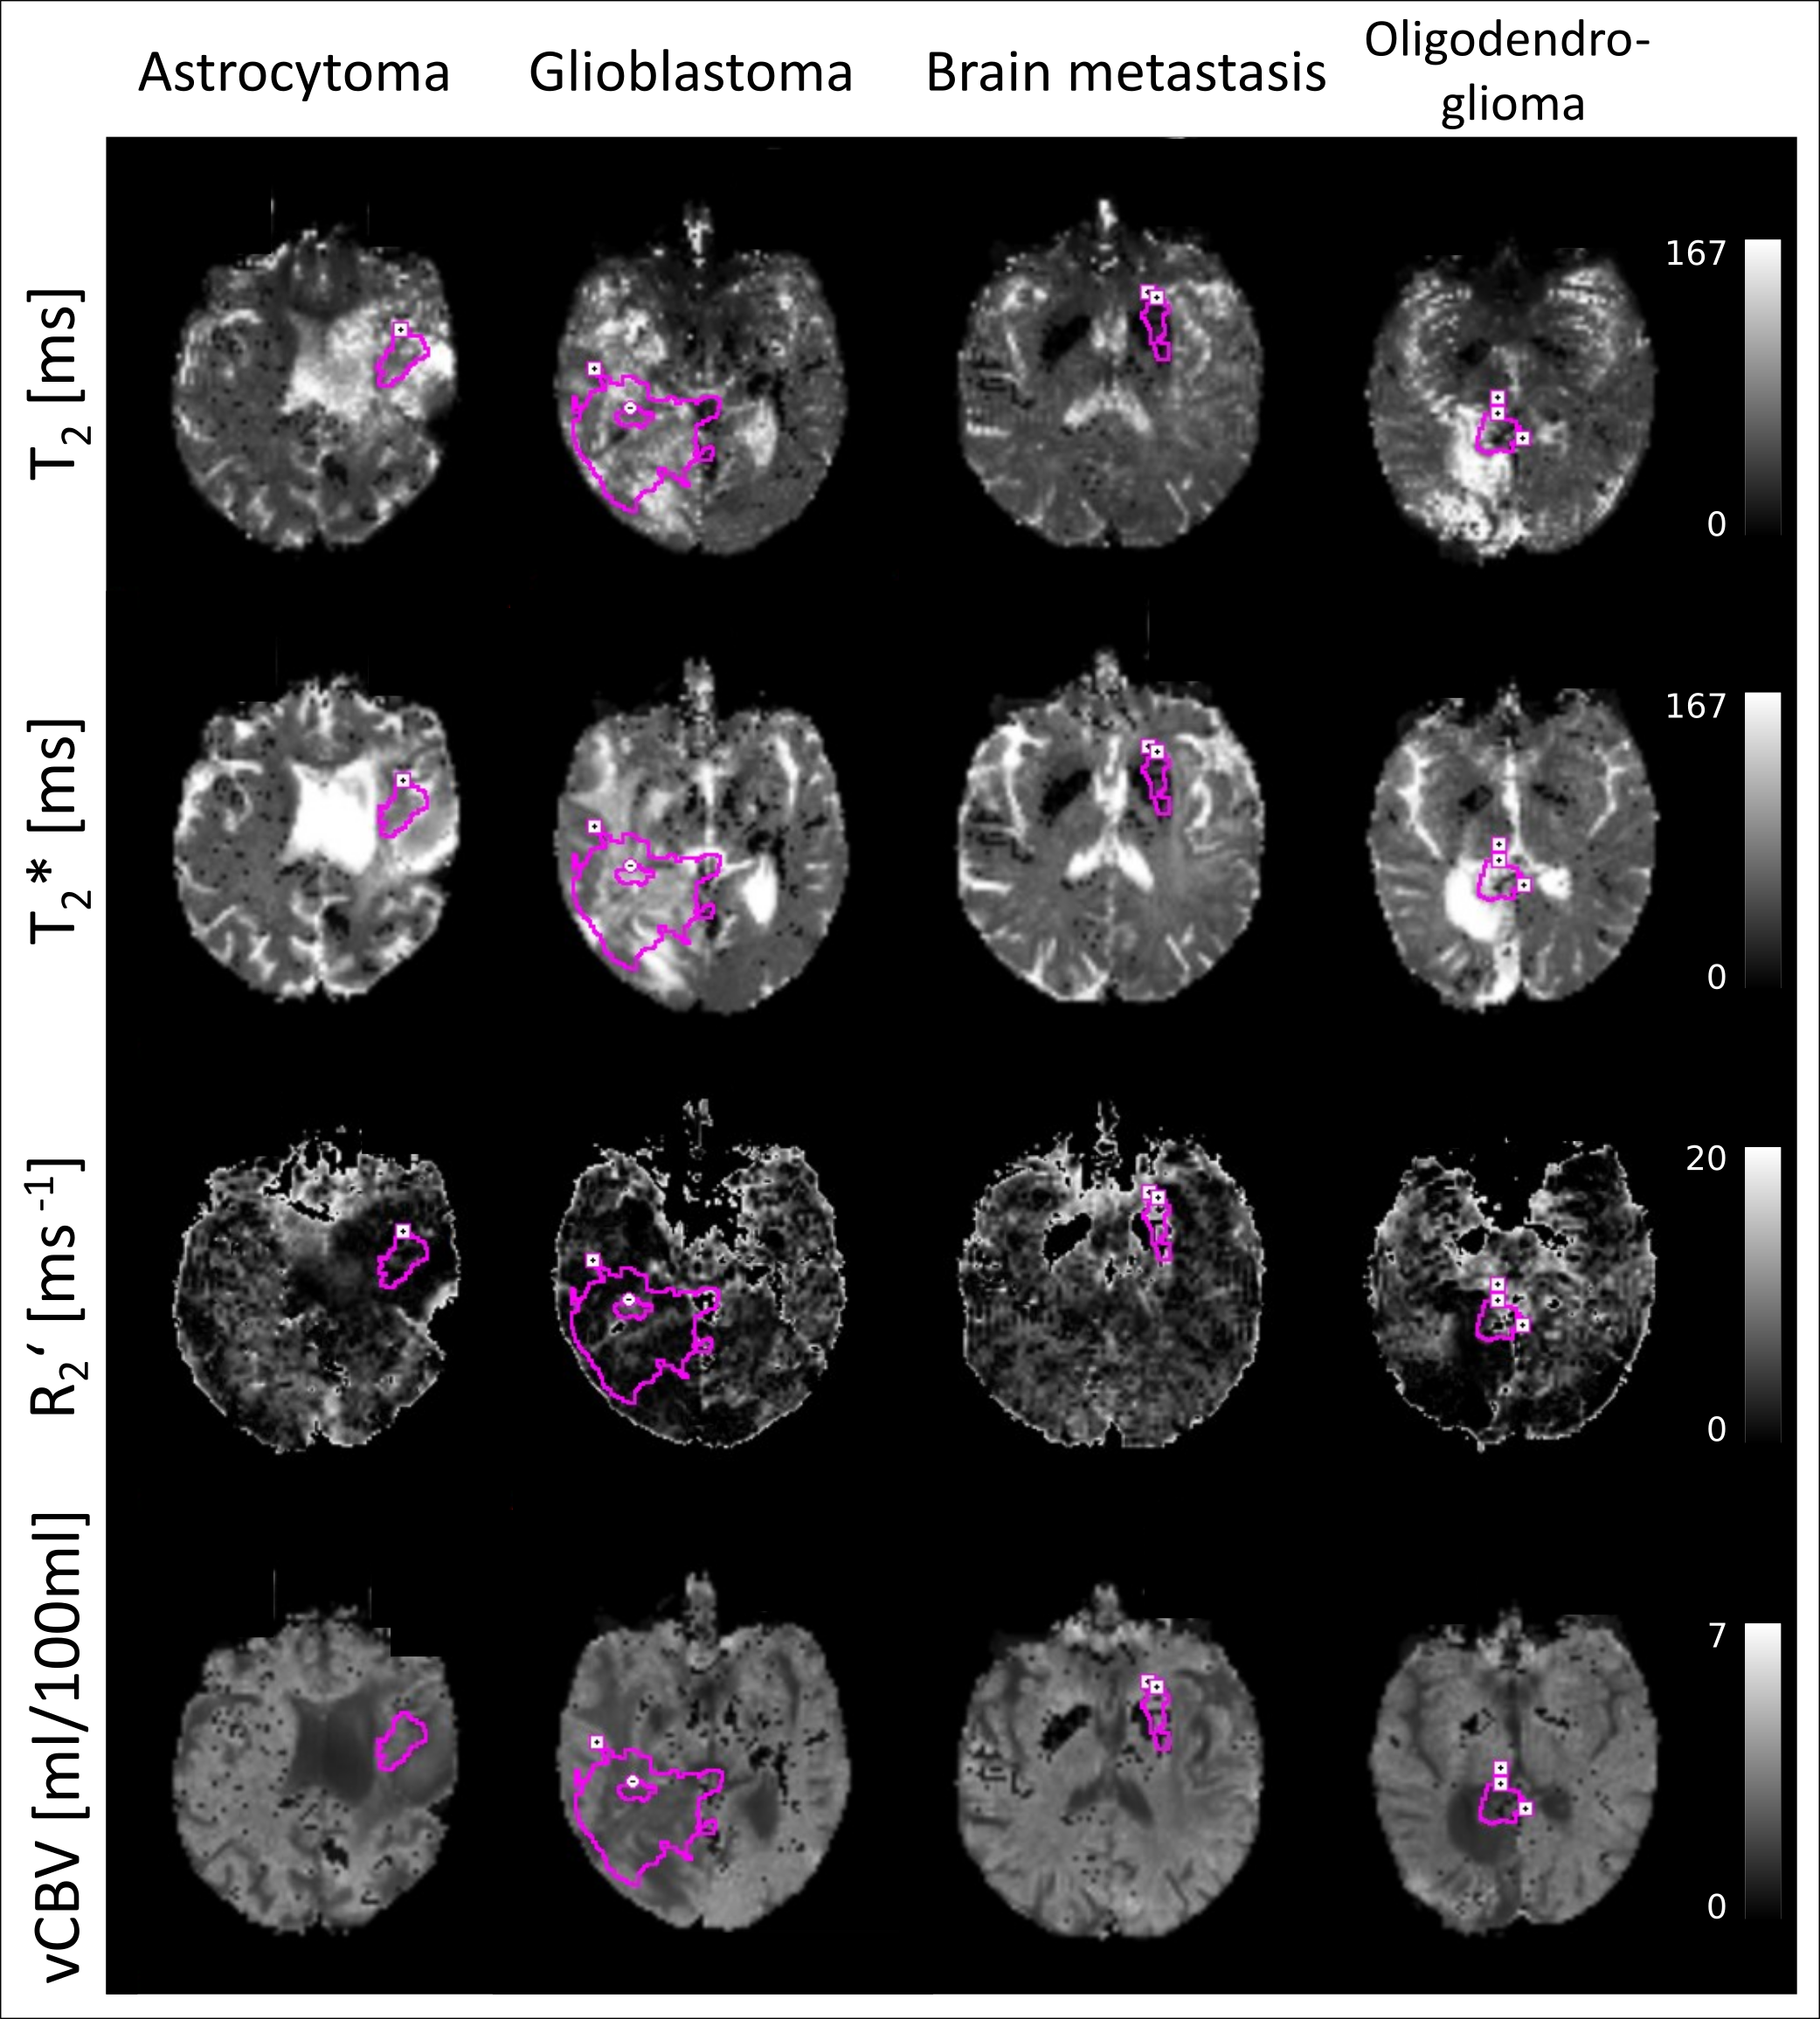
Figure 4: Visual comparison of four tumour patients representing each of the four tumour types included in this study. MR parameters derived from GE-SE EPIK are shown from top to bottom: T2, T2*, R2’, and vCBV. All images include the selected tumour VOI defined by the threshold in FET PET uptake values.
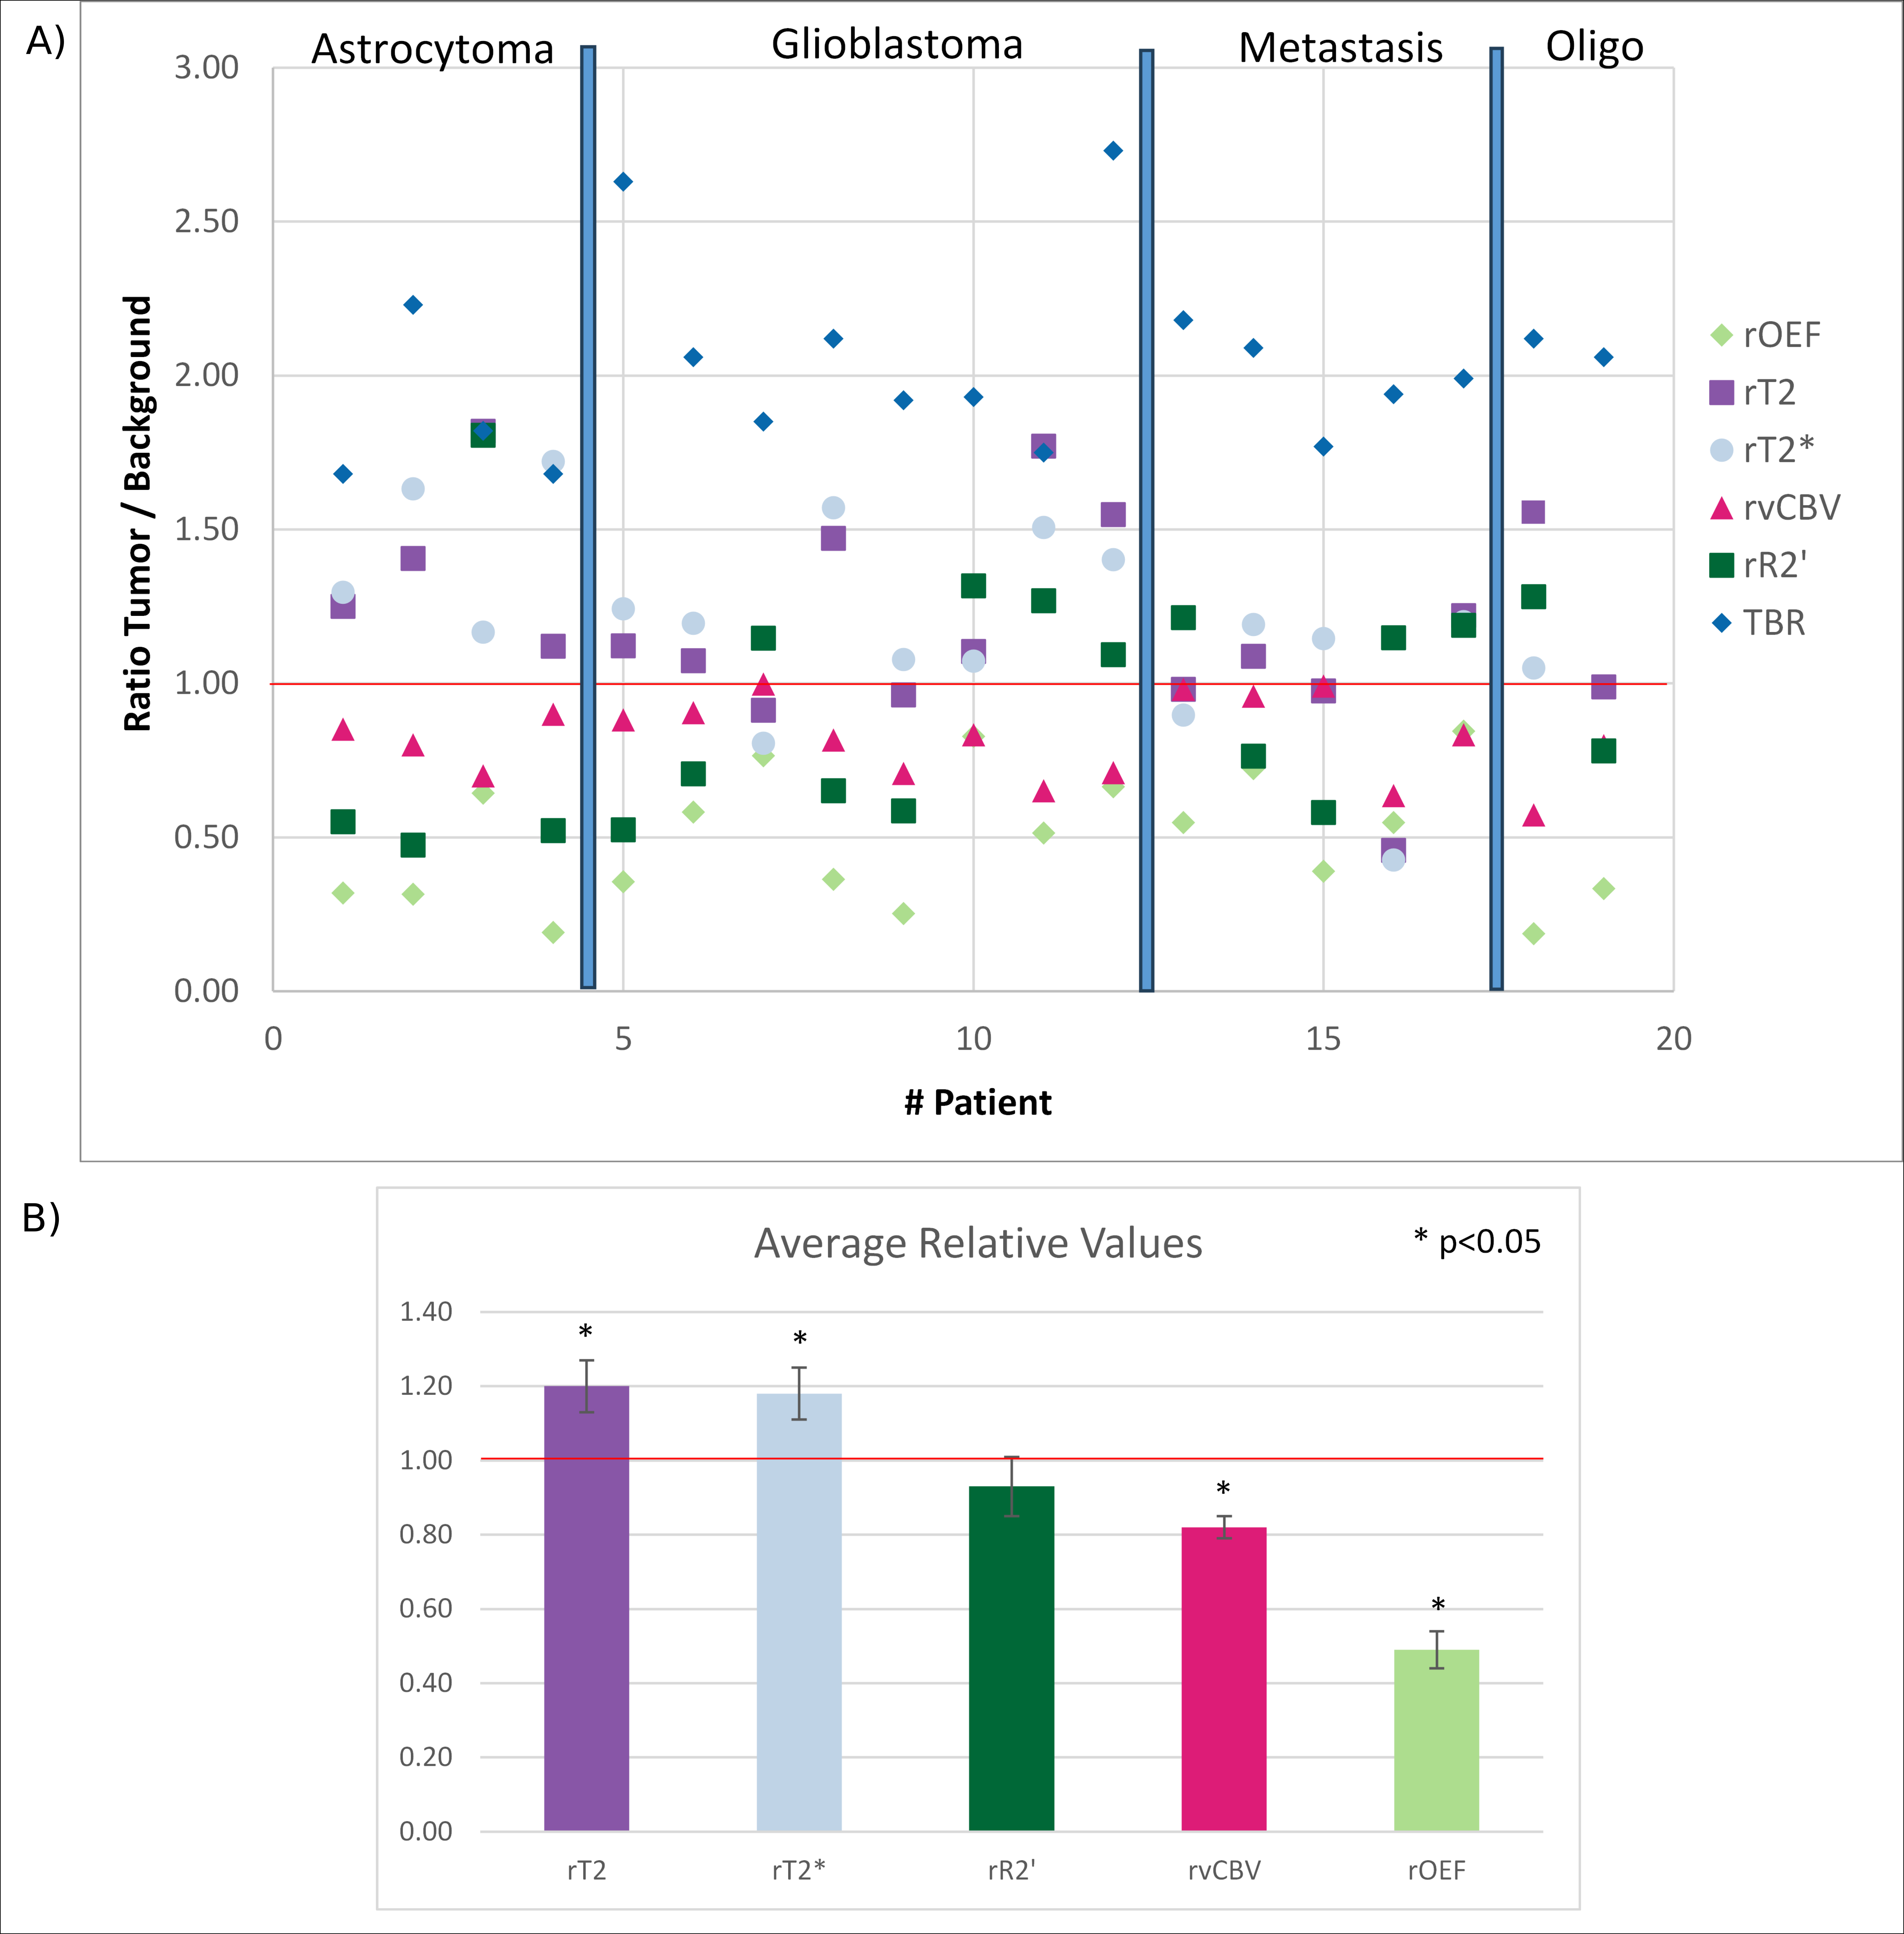
Figure 5: A) Summary of relative OEF, vCBV, R2’, T2 and T2* of all patients together with the TBR from FET PET in the tumour VOIs. Patients are ordered by their tumour type. The horizontal red line labels the healthy background reference. B) Average relative means and their standard error of mean (SEM) for each MR parameter analysed. Asterisk labels show significant differences between the mean relative values and the relative ratio of 1 based on the p-values from one-sample t-tests.