1307
Comparison of multiple sclerosis and neuromyelitis optica spectrum disorder: A physiological and quantitative MRI study1Center for Biomedical Imaging Research, Department of Biomedical Engineering, School of Medicine, Tsinghua University, Beijing, China, 2Department of Biomedical Engineering, College of Biomedical Engineering and Instrument Science, Zhejiang University, Hangzhou, China, 3Department of Neurology, Yuquan Hospital, School of Clinical Medicine, Tsinghua University, Beijing, China
Synopsis
Keywords: Novel Contrast Mechanisms, Brain, blood brain barrier permeability to water, oxygen extraction fraction, neuromyelitis optica spectrum disorder, multiple sclerosis
Motivation: Accurate differentiation of multiple sclerosis (MS) and neuromyelitis optica spectrum disorder (NMOSD) is essential for treatment decisions and thus affects prognosis.
Goal(s): This study aimed to determine the differences of MS and NMOSD using physiological and quantitative MRI.
Approach: blood brain barrier permeability to water (PS) and oxygen extraction fraction (OEF) of all subjects were measured by physiological and quantitative MRI.
Results: The results showed that compared with healthy subjects, water PS was significantly higher in NMOSD patients, while OEF was significantly lower in MS patients. In addition, OEF was also significantly different between NMOSD patients and MS patients.
Impact: Our study demonstrated that BBB permeability to water and whole-brain oxygen extraction fraction (OEF) might be potential imaging indicators for NMOSD and MS, respectively. In addition, OEF is the key to distinguish MS from NMOSD.
Introduction
Multiple sclerosis (MS) and neuromyelitis optica spectrum disorder (NMOSD) are severe demyelinating diseases in central nervous system (CNS) with similar clinical and imaging findings. Accurate differentiation of these diseases is essential for treatment decisions and thus affects prognosis1. Currently, differentiating MS and NMOSD relies on antibody testing in clinical settings. It is warranted to explore imaging biomarkers for differentiation of MS and NMOSD. This study aimed to determine the differences of MS and NMOSD using physiological and quantitative MRI.Methods
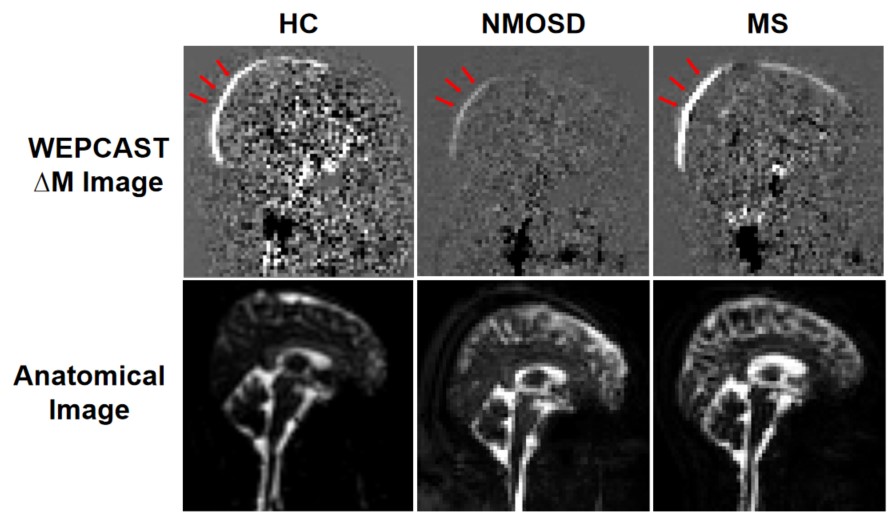
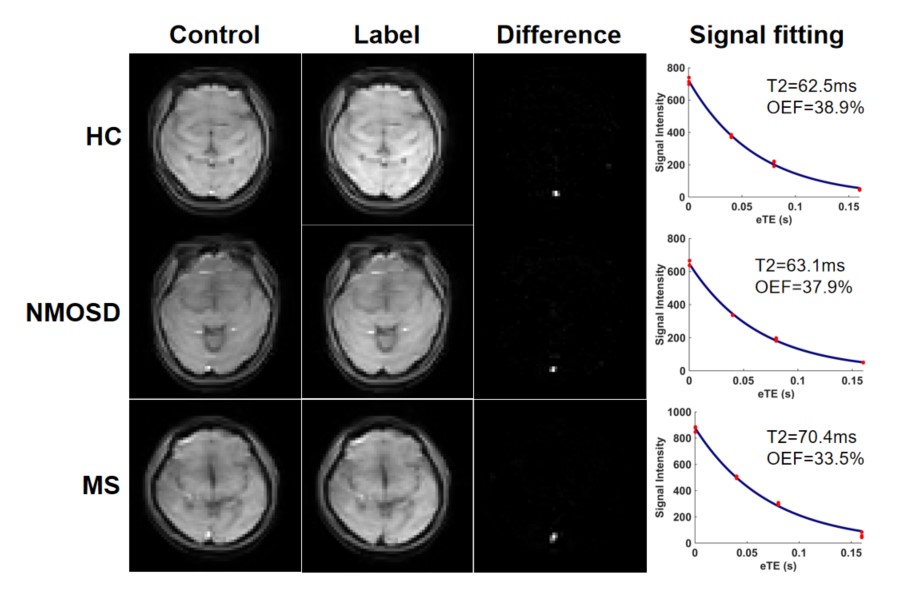
Study sample: Patients with aquaporin-4 positive NMOSD or MS and age- and sex-matched healthy controls (HC) were recruited from January 2022 to September 2023. All participants underwent brain physiological and quantitative MR imaging. The study protocol was approved by institutional review board and written consent form was obtained from all patients and healthy volunteers. MR imaging protocol: The MR imaging was performed on a 3.0T MR scanner (Ingenia, Philips Healthcare, Best, The Netherlands) with 32-channel head coil. The imaging protocol included phase-contrast (PC), T1-weighted magnetization prepared rapid acquisition of gradient echo (MPRAGE), water extraction with phase contrast arterial spin tagging (WEPCAST)2 and T2-Relaxation-Under-Spin-Tagging (TRUST)3 imaging sequences. MR image analysis: The brain structures in T1-weighted MPRAGE images were automatically segmented using MRICloud platform4 and the brain volume (BV) was measured. Global cerebral blood flow (CBF) was measured on PC images at 4 main feeding arteries (left/right internal carotid arteries and left/right vertebral arteries)5 and T1-weighted MPRAGE images. As shown in Figure 1, WEPCAST MR images were used to selectively measure the amount of labeled water in the superior sagittal sinus, which could give an estimation of the global extraction fraction (E) of water. Together with global CBF, blood brain barrier (BBB) permeability to water was assessed as permeability-surface area product (PS)6: $$PS=-\ln(1-E)\cdot CBF$$According to the relationship between blood T2 and oxygenation, the TRUST MR images were processed to obtain whole-brain venous oxygenation (Yv) according to established procedures3. Then, the whole-brain oxygen extraction fraction (OEF) was calculated as: $$OEF=\frac{Ya-Yv}{Ya}\cdot 100\%$$where Ya was the arterial oxygenation level, measured by a pulse oximetry during the TRUST MRI scans. An example of TRUST MRI for the assessment of OEF is shown in Figure 2. All image analyses were conducted using MATLAB R2022a software. Statistical analysis: The one-way analysis of variance (ANOVA) test was conducted to compare MRI quantitative measurements among different groups. Then the univariate and multivariate logistic regression were explored to analyze the association between MRI quantitative measurements and different groups. P value <0.05 was considered as statistically significant. All statistical analyses were performed on SPSS Statistics 26.0.Results
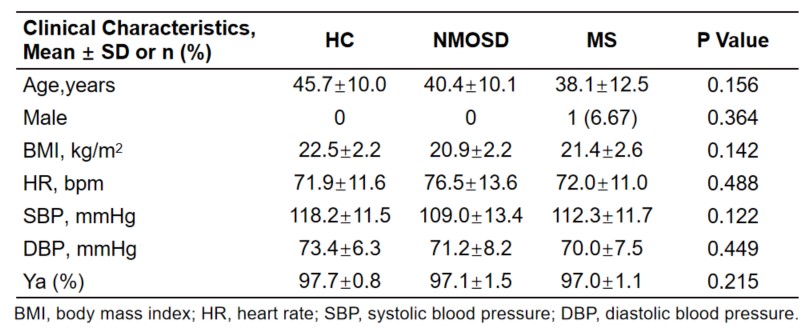
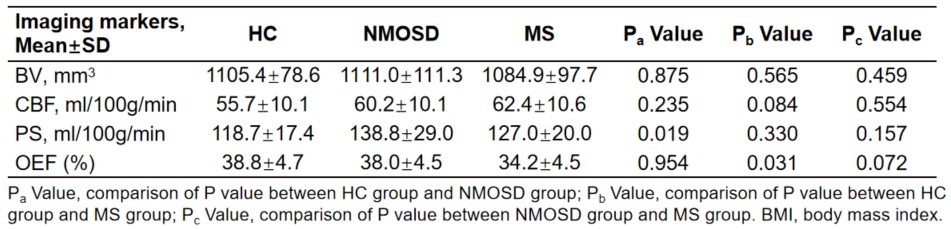
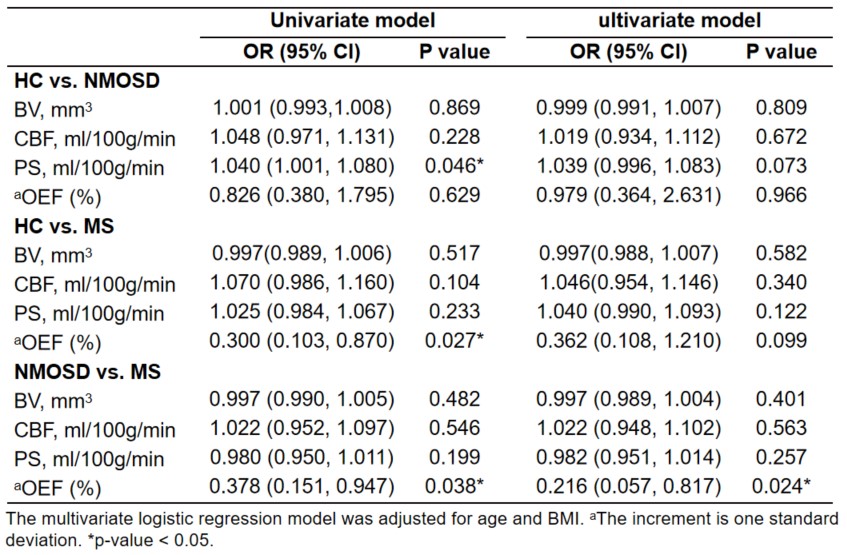
A total of 46 participants were enrolled, including 16 NMOSD patients (40.4±10.1 years old, 16 females), 15 MS patients (38.1±12.5 years old, 14 females), and 15 healthy controls (HC) (45.7±10.0 years old, 15 females). Clinical characteristics of study population were listed in Table 1. The results of one-way ANOVA test (Table 2) showed that the water PS of NMOSD patients was significantly higher than that of HC (138.8±29.0 ml/100g/min vs. 118.7±17.4 ml/100g/min, P=0.019), while no significant difference was found between HC and MS patients and between NMOSD patients and MS patients (all P>0.05). The OEF of MS patients was significantly lower than that of HC (34.2±4.5% vs. 38.8±4.7%, P=0.031), while no significant difference was found between HC and NMOSD patients and between NMOSD patients and MS patients (all P>0.05). Multivariate logistic regression analysis showed that, after adjusting for clinical confounding factors of age and BMI, OEF remained significantly different between NMOSD patients and MS patients (OR=0.216, 95%CI: 0.057-0.817, P=0.024), but such differences in OEF and PS were no longer statistically significant between HC and NMOSD patients (P=0.073) and between HC and MS patients (P=0.099), respectively (Table 3).Discussion
Our study provides evidence that both NMOSD and MS patients have cerebral physiological impairments. The potential mechanism of NMOSD is the breakdown of the tight connections between epithelial cells caused by Inflammatory infiltration, and therefore leading to the disruption of the blood-brain barrier. However, due to impaired mitochondrial function, MS uniquely leads to the decline of brain tissue oxygen metabolism, which is also the key to distinguish it from NMOSD. Future studies with larger sample size are warranted.Conclusion
Our study demonstrated that water PS and whole-brain OEF might be potential indicators for NMOSD and MS, respectively. In addition, OEF is the key to distinguish MS from NMOSD.Acknowledgements
No acknowledgement found.References
- Zrzavy T, Leutmezer F, Rommer P, et al. Imaging features to distinguish AQP4-positive NMOSD and MS at disease onset: A retrospective analysis in a single-center cohort. Eur J Radiol. 2022; 146: 110063.
- Lin Z, Li Y, Su P, et al. Non-contrast MR imaging of blood-brain barrier permeability to water. Magn Reson Med. 2018; 80(4):1507-1520.
- Lu H, Ge Y. Quantitative evaluation of oxygenation in venous vessels using T2-Relaxation-Under-Spin-Tagging MRI. Magn Reson Med. 2008; 60(2): 357-363.
- Mori S, Wu D, Ceritoglu C, et al. MRICloud: Delivering High-Throughput MRI Neuroinformatics as Cloud-Based Software as a Service. Computing in Science & Engineering. 2016; 18(5): 21-35.
- Peng SL, Su P, Wang FN, et al. Optimization of phase-contrast MRI for the quantification of whole-brain cerebral blood flow. J Magn Reson Imaging. 2015; 42(4): 1126-1133.
- Lin Z, Sur S, Liu P, et al. Blood-Brain Barrier Breakdown in Relationship to Alzheimer and Vascular Disease. Ann Neurol. 2021; 90(2): 227-238.
Figures