1299
Histopathological Validation of Microstructure-Informed Susceptibility Source Separation (MI-SSS) for Brain Iron and Myelin Quantification1Electrical and Computer Engineering, Cornell University, Ithaca, NY, United States, 2Department of Radiology, Weill Cornell Medicine, New York, NY, United States, 3Department of Neurology, Yale Medicine, New Haven, CT, United States, 4Department of Neurology, Weill Cornell Medicine, New York, NY, United States, 5Biomedical Engineering, Cornell University, Ithaca, NY, United States
Synopsis
Keywords: Novel Contrast Mechanisms, Microstructure, Multiple Sclerosis
Motivation: Myelin and iron carry significant roles in several neurodegenerative disease processes. The development of noninvasive imaging modalities for myelin and iron quantification and validation of these modalities are important steps in clinical MRI research.
Goal(s): MI-SSS is developed for the improved estimation of brain myelin and iron and here it is aimed to validate MI-SSS maps with histopathological quantification techniques.
Approach: An ex vivo whole brain is scanned; myelin and iron biomarkers maps are reconstructed and the results are correlated against histopathological findings.
Results: Both susceptibility maps showed significant correlation with histopathological myelin and iron quantifications presenting accurate performance of MI-SSS.
Impact: Myelin and iron quantification carry significant clinical importance for diagnosis and monitoring of neurodegenerative diseases. MI-SSS is developed to provide an improved and practical framework for this purpose. Here, the MI-SSS is validated against gold standard histopathological findings.
Introduction
Several quantitative methods for noninvasive measurement of brain iron and myelin have been developed over the years such as quantitative susceptibility mapping (QSM)1 using multi gradient-echo (mGRE), and myelin water fraction (MWF)2 using multi-echo spin-echo (MESE) imaging. However, QSM cannot distinguish between paramagnetic iron and diamagnetic myelin when present in the same voxel. On the other hand, MWF suffers from a lack of clinical feasibility due to longer scan times. Susceptibility source separation (SSS) has been developed to estimate diamagnetic susceptibility maps ($$$\chi^-$$$, interpreted as myelin) and paramagnetic susceptibility maps ($$$\chi^+$$$, interpreted as iron) from mGRE magnitude and phase data3-5. Microstructure-informed SSS (MI-SSS) is an alternative method developed based on biophysical modeling of brain tissues composed of multi-water pools, hollow cylindrical diamagnetic myelin, and isotropic and paramagnetic iron distribution. Estimation of $$$\chi^+$$$ and $$$\chi^-$$$ is done via stochastic matching pursuit using a pre-computed dictionary6.Histopathological quantification of tissue myelin and iron is considered to be the gold standard in the field and was previously used for the validation of QSM7, SSS8, and MWF9. Here, we employ it to validate MI-SSS and show its potential for iron and myelin quantification.
Methods
To evaluate the performance of MI-SSS a fixed ex vivo whole brain sample with multiple sclerosis (MS) pathology is scanned at a GE Discovery MR750W scanner using an 8-channel head coil. FAST-T210 images were acquired with 1x1x2 mm3 resolution at 7 nominal echo times of 0, 7.5, 17.5, 27.5, 67.5, 147.5 and 307.5 ms, spiral TE/TR = 0.5/5.5 ms, number of spiral leaves = 48, flip angle = 10 degrees, number of signal averages (NEX) = 9. mGRE data were acquired with TR=52.2 ms, 8 TE=5.8:5.9:47.3 ms, flip angle=12, voxel size 0.5x0.5x0.5 mm3.QSM is reconstructed from the mGRE phase using Morphology Enable Dipole Inversion (MEDI)11,12, $$$\chi^+$$$ and $$$\chi^-$$$ maps are estimated using MI-SSS from mGRE magnitude and QSM distributions, and MWF is obtained from FAST-T2 data using T2-relaxometry10.
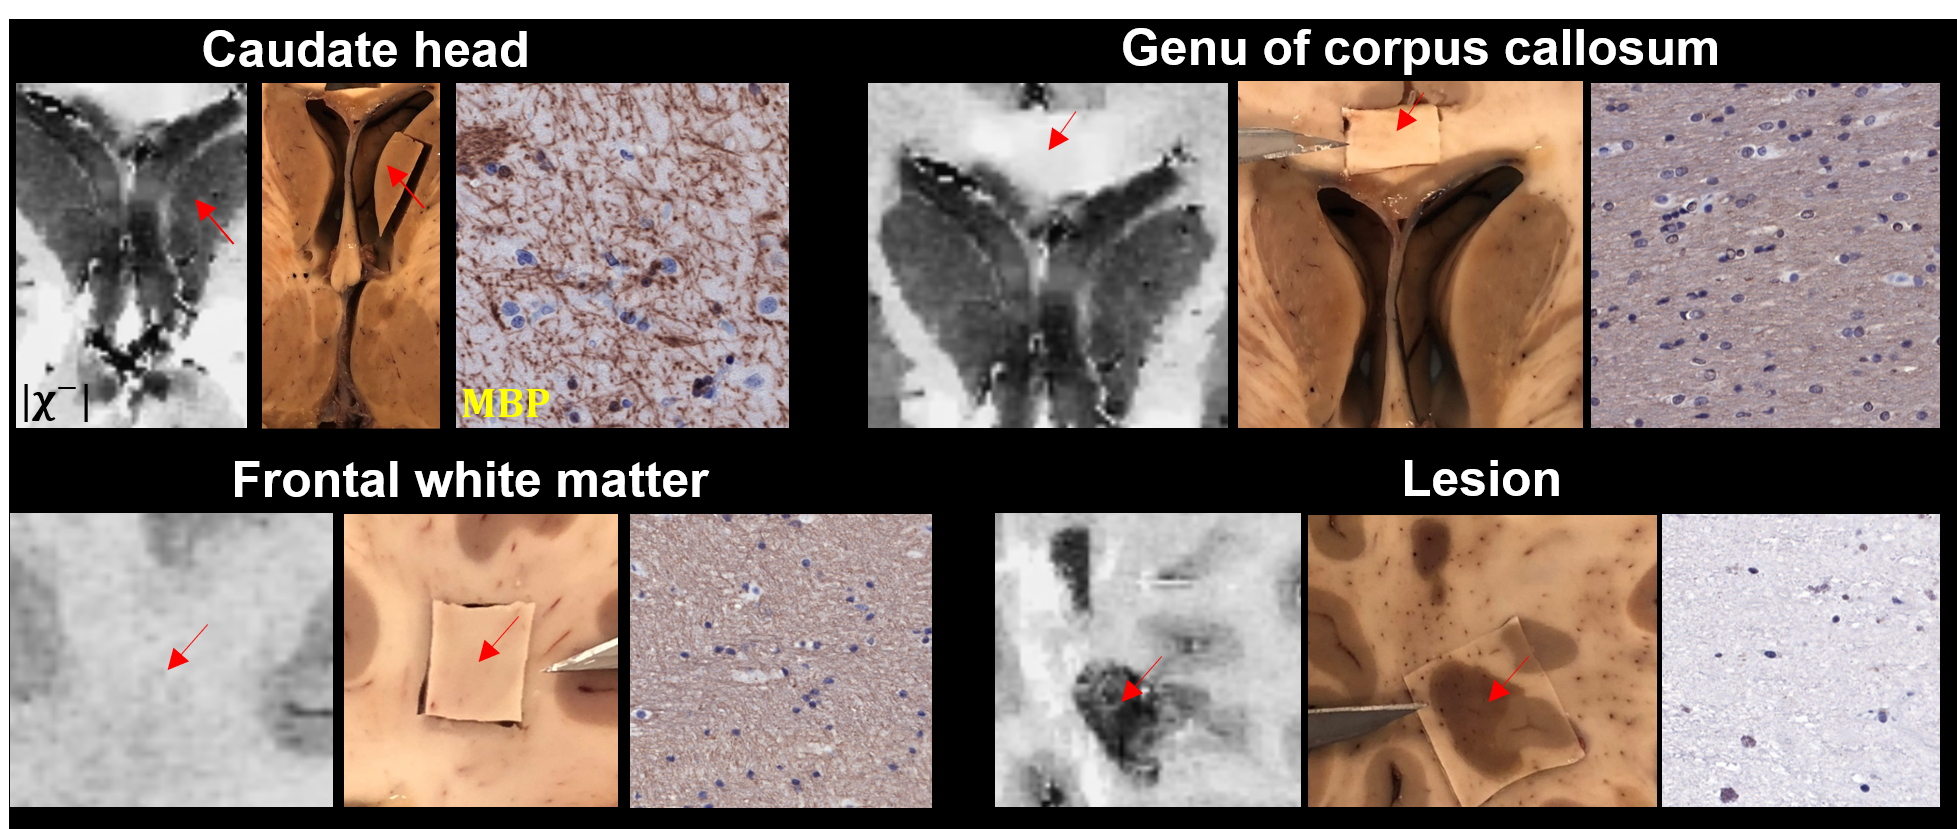
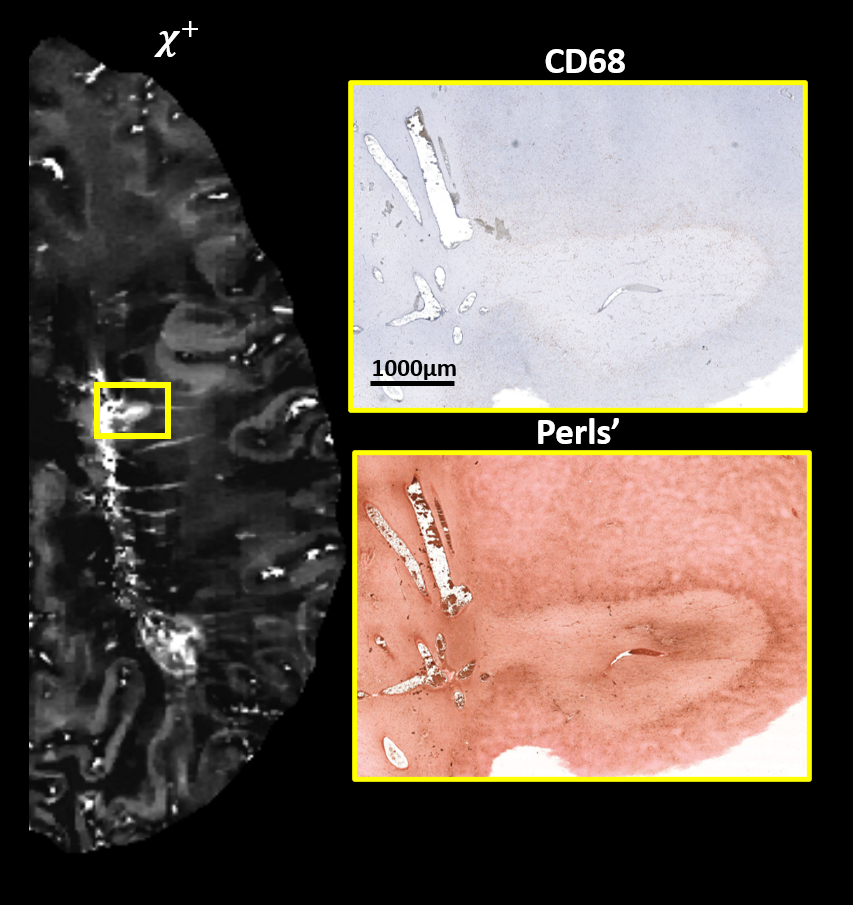
For histopathological examination, areas of interest were excised for analysis, embedded in paraffin, and sectioned into 5 μm slices. These sections underwent deparaffinization in xylene, rehydration, and antigen retrieval using a 10 mM sodium citrate buffer (pH 6) for 20 minutes. Following quenching and blocking, the sections were incubated overnight with primary antibodies against myelin basic protein (MBP, Dako A0623, 1:500) and CD68 (microglia/macrophages; CellSignaling #76437, 1:500). Subsequently, biotinylated secondary antibodies and an avidin/biotin staining kit with diaminobenzidine (DAB) as the chromogen (Vector Laboratories ABC Elite Kit and DAB Kit) were applied. Negative controls involved isotype-controls and tissues lacking MBP or CD68 expression. Ferric iron was detected using DAB-enhanced Perls’ Prussian blue, with slides immersed in 4% ferrocyanide/4% hydrochloric acid for 30 minutes, followed by enhancement with DAB for an additional 30 minutes at room temperature. Post-staining, sections were rinsed, dehydrated, cover-slipped, and digitally scanned using a Mirax digital slide scanner.
Myelin biomarkers are evaluated against MBP optical density in both healthy (head of the caudate nucleus, putamen, globus pallidus, genu and splenium of the corpus callosum, frontal and parietal white matter) and 4 lesion regions of interest (ROIs). Iron biomarkers are evaluated against microglia and macrophage cell counts on Perls’ staining in 4 lesion ROIs (rim, core, and nearby normal-appearing white matter for each).
Results and Discussion
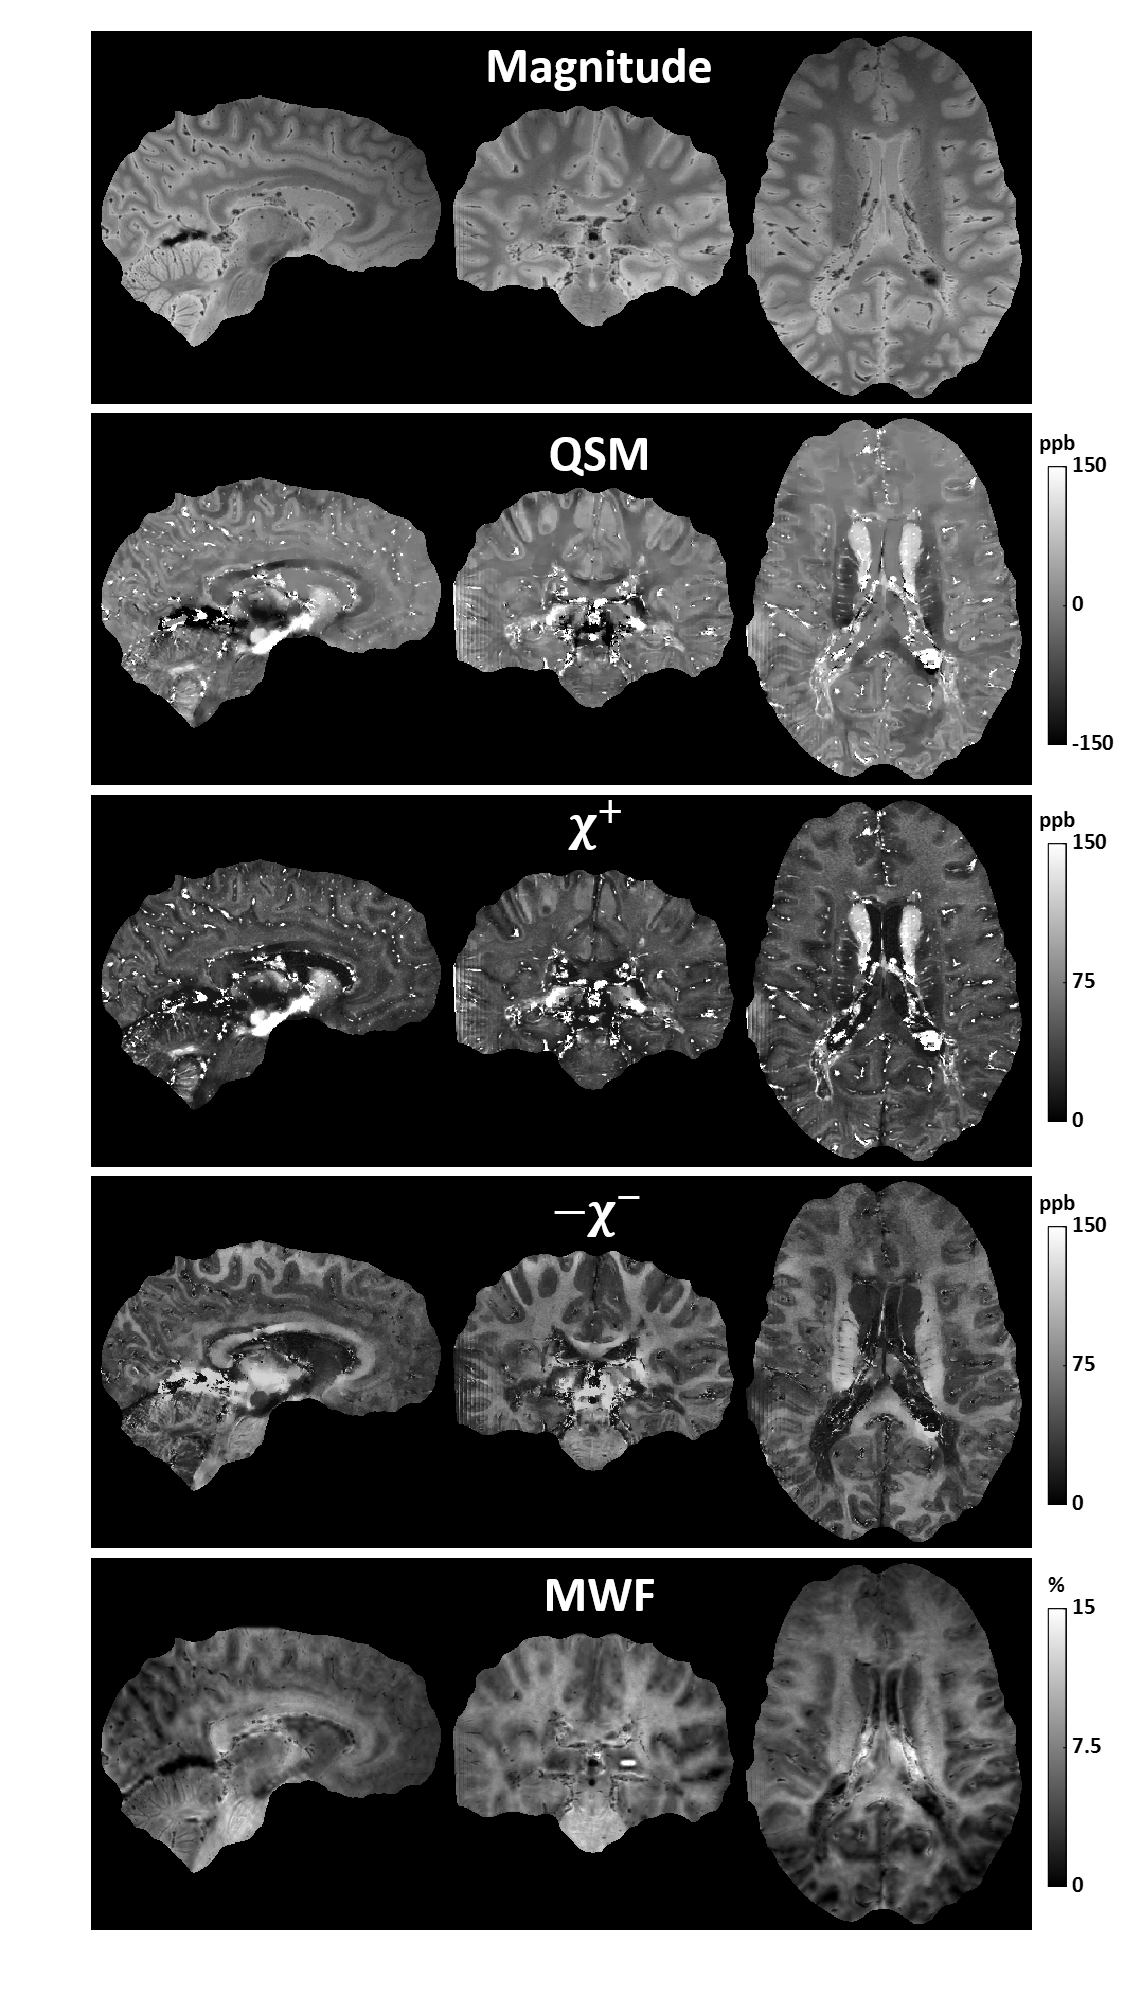
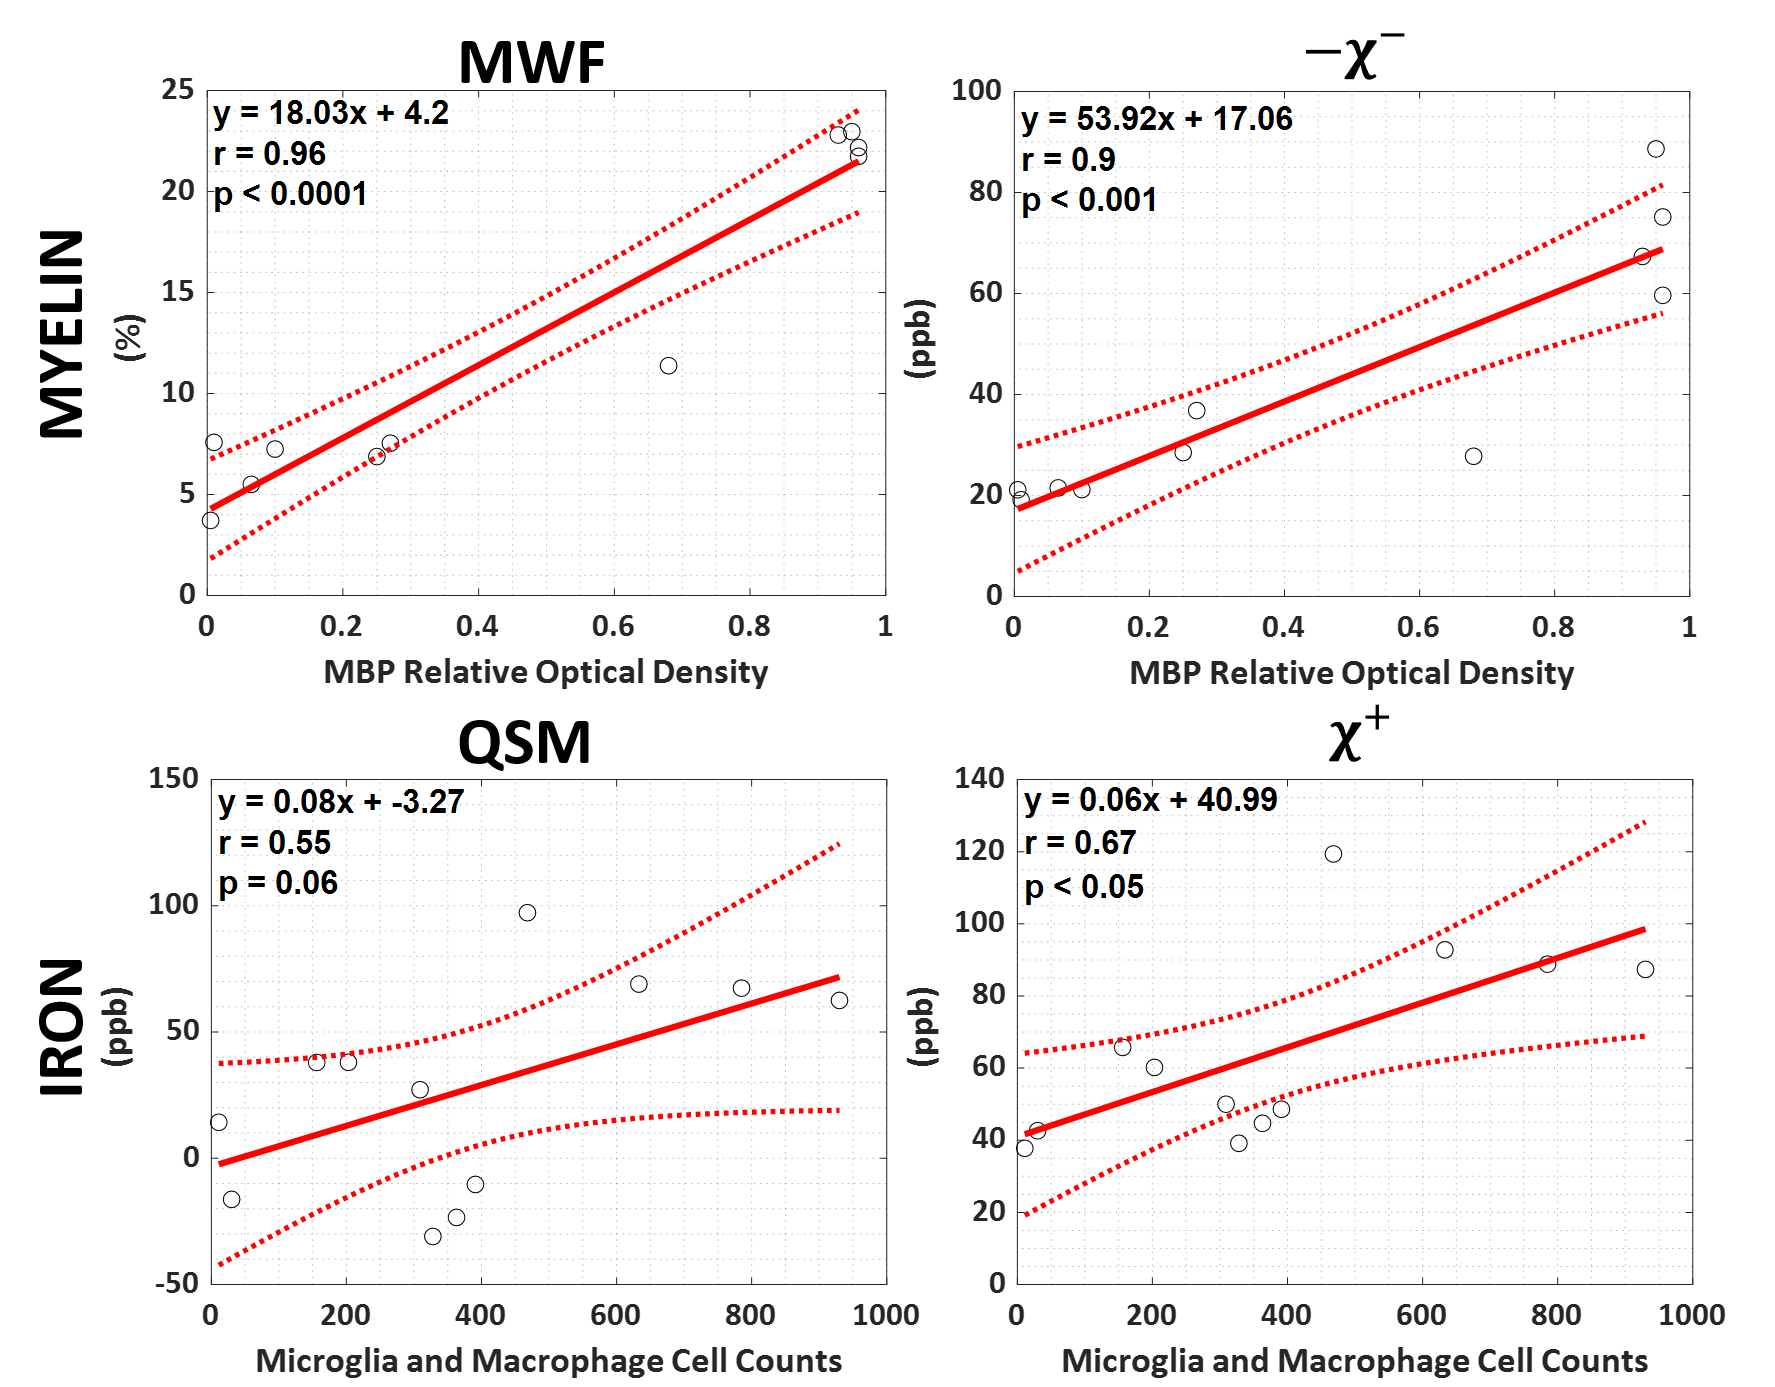
Figure 1 shows the mGRE magnitude images, QSM, $$$\chi^+$$$, $$$-\chi^-$$$, and MWF maps in the sagittal, coronal, and axial planes.The linear analysis results are provided in Figure 2. All the quantitative biomarkers except for QSM showed a significant correlation with histopathology measures. Both myelin biomarkers present a very high correlation with MBP optical density, whereas MWF has a slightly higher correlation. This slight loss of accuracy can be acceptable given the practical advantages of mGRE acquisition compared with the T2-relaxometry based acquisitions such as high resolution with short acquisition time with low specific absorption rate13. Moreover, MWF acquisition usually requires special sequences that may not be available but standard mGRE is widely available. Gradient-echo based approaches suffer from microstructural effects such as fiber orientation-dependent magnitude decay rates14 which might be a reason for the relatively lower accuracy of $$$-\chi^-$$$. These effects can confound the myelin quantification accuracy unless addressed carefully6.
$$$\chi^+$$$ map on the other hand, provide a higher correlation with iron-containing cell counts than QSM which shows that $$$\chi^+$$$ is a more specific biomarker for iron content which is crucial in application such as PRL detection and monitoring.
Conclusion
MI-SSS shows a significant correlation with histopathological measures and provides better performance for iron quantification than QSM.Acknowledgements
This work was supported in part by research grants from the NIH: R01NS105144, R01NS090464, R01NS095562, S10OD021782, R01HL151686, and National MS Society: RG-1602-07671.References
1. Wang Y, Liu T. Quantitative susceptibility mapping (QSM): Decoding MRI data for a tissue magnetic biomarker. Magn Reson Med 2015;73(1):82-101.
2. MacKay A, Whittall K, Adler J, Li D, Paty D, Graeb D. In vivo visualization of myelin water in brain by magnetic resonance. Magn Reson Med 1994;31(6):673-677.
3. Dimov AV, Nguyen TD, Gillen KM, Marcille M, Spincemaille P, Pitt D, Gauthier SA, Wang Y. Susceptibility source separation from gradient echo data using magnitude decay modeling. J Neuroimaging 2022;32(5):852-859.
4. Shin HG, Lee J, Yun YH, Yoo SH, Jang J, Oh SH, Nam Y, Jung S, Kim S, Fukunaga M, Kim W, Choi HJ. χ-separation: Magnetic susceptibility source separation toward iron and myelin mapping in the brain. Neuroimage 2021;240:118371.
5. Chen J, Gong NJ, Chaim KT, Otaduy MCG, Liu C. Decompose quantitative susceptibility mapping (QSM) to sub-voxel diamagnetic and paramagnetic components based on gradient-echo MRI data. Neuroimage 2021;242:118477.
6. Sisman M, Nguyen TD, Roberts AG, Romano DJ, Dimov AV, Kovanlikaya I, Spincemaille P, Wang Y. Microstructure-Informed Myelin Mapping (MIMM) from Gradient Echo MRI using Stochastic Matching Pursuit. medRxiv 2023.
7. Gillen KM, Mubarak M, Park C, Ponath G, Zhang S, Dimov A, Levine-Ritterman M, Toro S, Huang W, Amici S, Kaunzner UW, Gauthier SA, Guerau-de-Arellano M, Wang Y, Nguyen TD, Pitt D. QSM is an imaging biomarker for chronic glial activation in multiple sclerosis lesions. Ann Clin Transl Neurol 2021;8(4):877-886.
8. Dimov AV, Gillen KM, Nguyen TD, Kang J, Sharma R, Pitt D, Gauthier SA, Wang Y. Magnetic Susceptibility Source Separation Solely from Gradient Echo Data: Histological Validation. Tomography 2022;8(3):1544-1551.
9. Laule C, Kozlowski P, Leung E, Li DK, Mackay AL, Moore GR. Myelin water imaging of multiple sclerosis at 7 T: correlations with histopathology. Neuroimage 2008;40(4):1575-1580.
10. Nguyen TD, Deh K, Monohan E, Pandya S, Spincemaille P, Raj A, Wang Y, Gauthier SA. Feasibility and reproducibility of whole brain myelin water mapping in 4 minutes using fast acquisition with spiral trajectory and adiabatic T2prep (FAST‐T2) at 3T. Magnetic resonance in medicine 2016;76(2):456-465.
11. Liu J, Liu T, de Rochefort L, Ledoux J, Khalidov I, Chen W, Tsiouris AJ, Wisnieff C, Spincemaille P, Prince MR, Wang Y. Morphology enabled dipole inversion for quantitative susceptibility mapping using structural consistency between the magnitude image and the susceptibility map. Neuroimage 2012;59(3):2560-2568.
12. Liu Z, Spincemaille P, Yao Y, Zhang Y, Wang Y. MEDI+0: Morphology enabled dipole inversion with automatic uniform cerebrospinal fluid zero reference for quantitative susceptibility mapping. Magn Reson Med 2018;79(5):2795-2803.
13. Haacke EM, Xu Y, Cheng YC, Reichenbach JR. Susceptibility weighted imaging (SWI). Magn Reson Med 2004;52(3):612-618.
14. Wharton S, Bowtell R. Fiber orientation-dependent white matter contrast in gradient echo MRI. Proc Natl Acad Sci U S A 2012;109(45):18559-18564.
Figures