1298
Monitoring brain glucose metabolism using magnetic resonance fingerprinting at 9.4 T1Innovation Academy for Precision Measurement Science and Technology, Chinese Academy of Sciences, WuHan, China, 2Huazhong University of Science and Technology, WuHan, China
Synopsis
Keywords: Relaxometry, Metabolism, High-Field MRI;Magnetic Resonance Fingerprinting
Motivation: The monitoring of brain glucose metabolism plays an important role in the diagnosis of neurological diseases.
Goal(s): The glucose uptake and clearance in the mouse brain were monitored following intravenous administration of glucose using magnetic resonance fingerprinting.
Approach: A magnetic resonance fingerprinting imaging sequence was developed to simultaneously measure the T1, T2 and T1ρ of tissue.
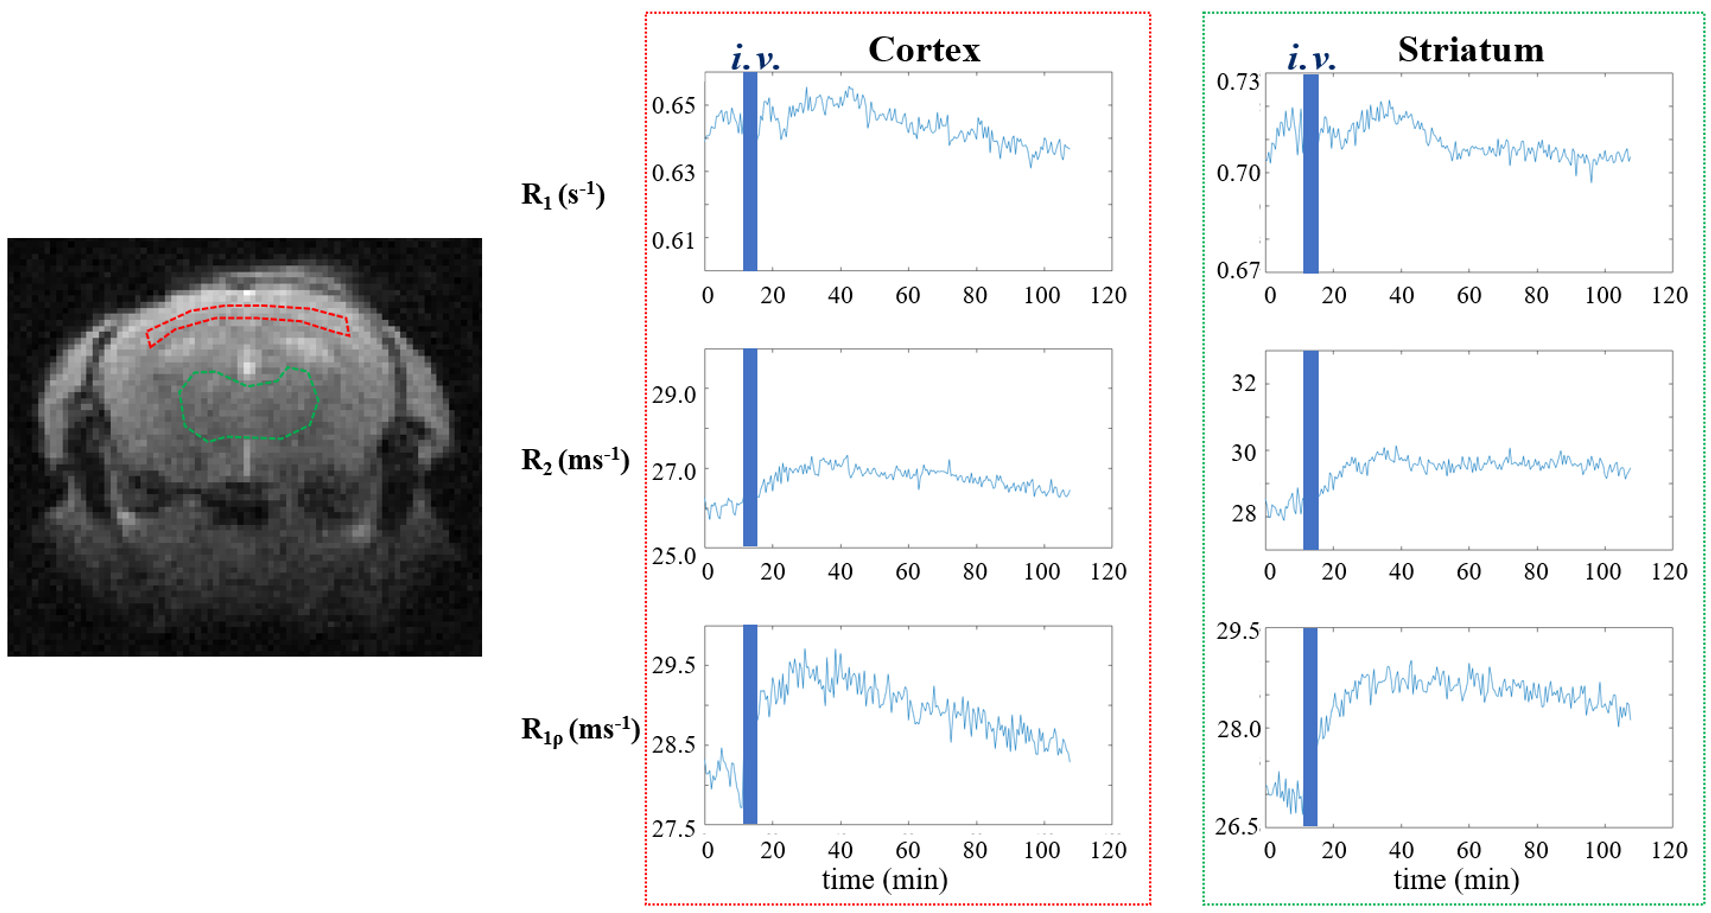
Results: With the intravenous administration of glucose, there was a rapid increase followed by a gradual decrease in R1, R2 and R1ρ values in the brain.
Impact: The application of magnetic resonance fingerprinting in the study of brain glucose metabolism facilitates rapid and simultaneous measurement of multiple parameters, thereby yielding valuable information for the diagnosis of brain-related diseases.
INTRODUCTION
Precisely, glucose executes a vital function in brain metabolism by furnishing energy to the brain, underpinning the functionality of brain cells, and sustaining the normal operation of the nervous system. The limitations of conventional measurement approaches preclude rapid multi-parameter assessments. Concurrent measurement of T1, T2 and T1ρ in the mouse brain following glucose injection can offer more informative insights into glucose uptake and clearance in the brain1.METHODS
The development of a magnetic resonance fingerprinting (MRF) pulse sequence for ultra-high field is presented in Figure 1. This was achieved by incorporating various adiabatic pulse preparation modules into MRF and incorporating T1, T2 and T1ρ weights in the signal evolution process, enabling simultaneous measurement of T1, T2 and T1ρ in ultra-high field. A high undersampling factor was employed to collect data, and a sliding-window reconstruction method was utilized to mitigate the artifacts induced by undersampling, resulting in a time resolution of 30 s/slice. Utilizing this MRF protocol, glucose uptake and clearance in mouse brains were investigated by monitoring the brain relaxation time following tail vein injection of glucose (150 μL 50% w/w D-glucose) at 9.4 T.RESULTS
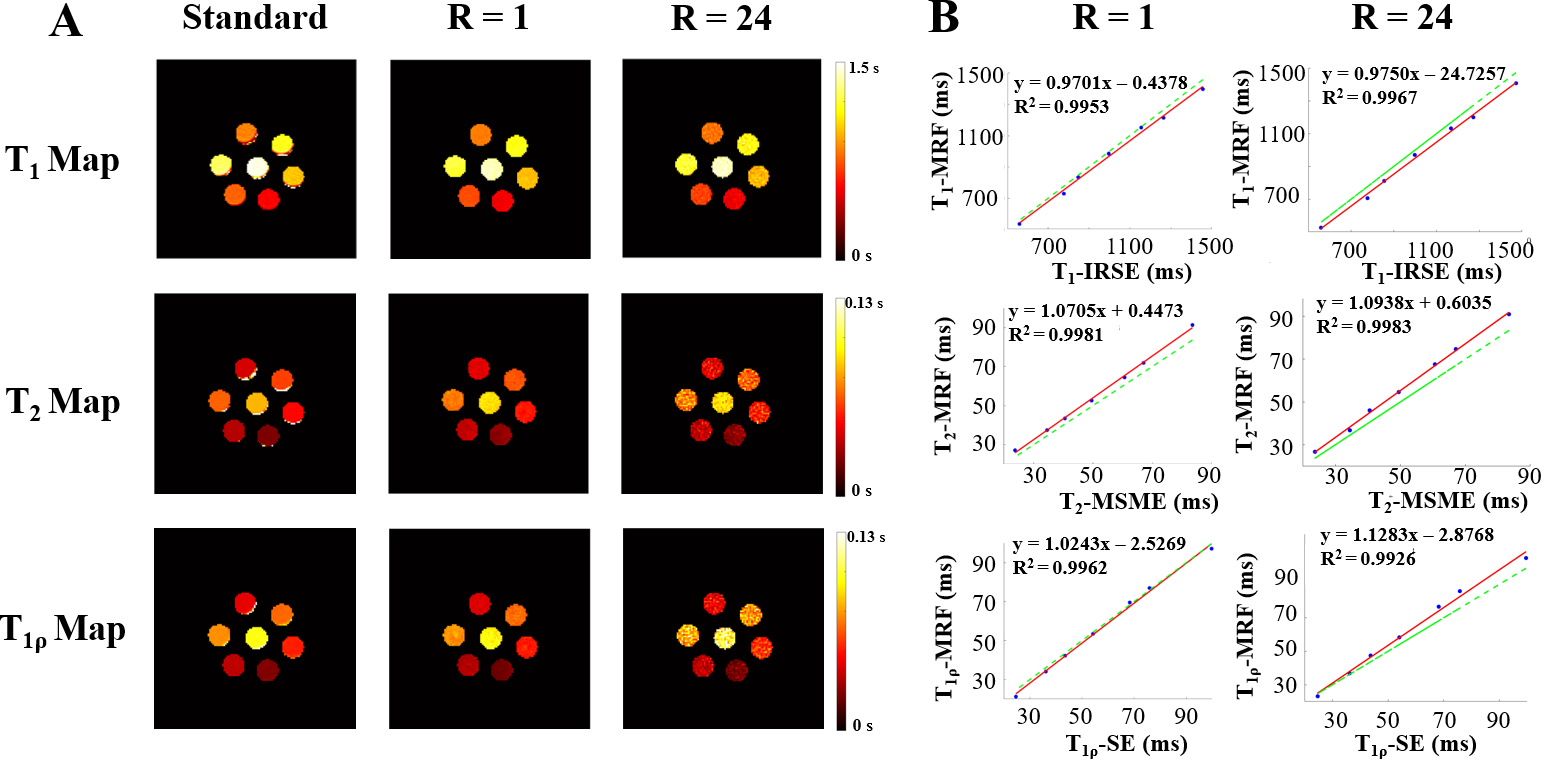
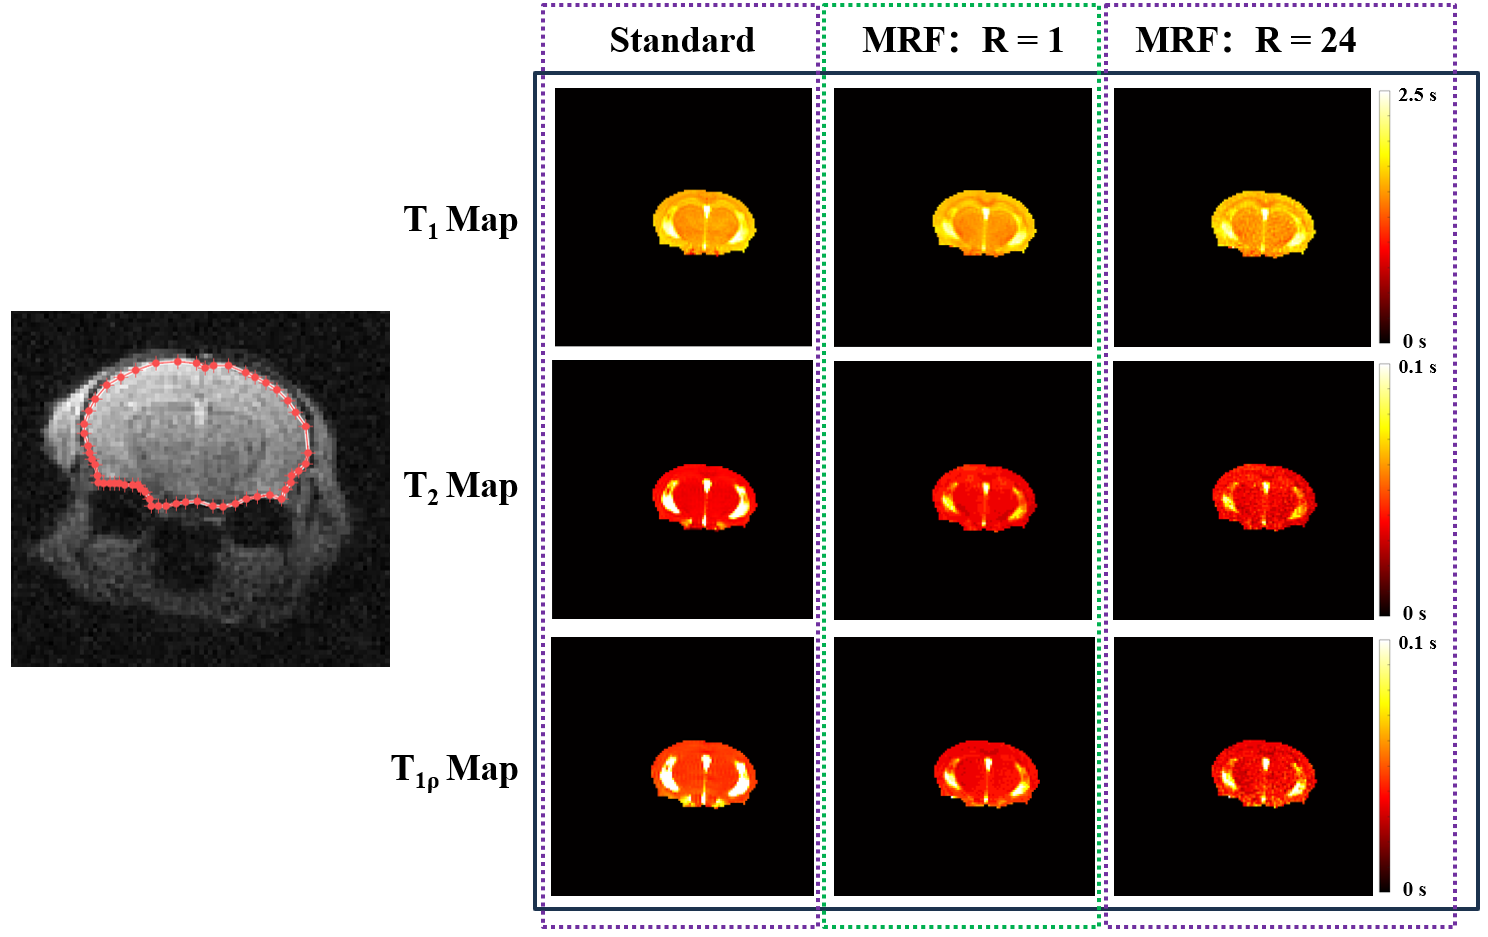
The efficacy of MRF was ascertained by employing conventional MRI. As illustrated in Figure 2, the T1, T2 and T1ρ values obtained from both MRF and conventional approaches exhibit significant linear relationships. Furthermore, our results remain consistent even when the undersampling factor reaches 24. Figure 3 displays representative T1, T2 and T1ρ maps of a mouse brain. No significant disparities were detected between the T1, T2 and T1ρ values of brain tissue and the control group. However, T2 and T1ρ values in cerebrospinal fluid were found to be lower than those in the control group. Subsequently, we conducted a glucose uptake experiment in mouse brain. As demonstrated in Figure 4, following the injection of glucose, R1, R2 and R1ρ in mouse brain tissue underwent a rapid increase, followed by a gradual decrease.DISCUSSION
The T1, T2 and T1ρ mapping assessed by MRF in the phantom and brain demonstrated a good concurrence with the control group. The convergence of T2 and T1ρ measured by MRF in CSF in vivo exhibits a lower value compared to that measured by traditional methods, potentially due to the diffusion effect induced by CSF flow. The intravenous injection of glucose resulted in observed alterations in R1, R2 and R1ρ values in mouse brain tissue. The changes of R1 in brain tissue was predominantly attributed to the influence of blood osmotic pressure, given that the glucose solution used for tail vein injection was a highly osmotic solution2. Additionally, we noted that R1ρ initially increased and then decreased post-glucose injection, reflecting the process of glucose uptake and clearance in mouse brain tissue. Among them, R2 demonstrated an initial upward trend, followed by a steady state, without a significant decrease at the conclusion of the experiment. This could be attributed to the fact that R2 represents the rapid exchange process between water molecules and exchangeable protons in the brain tissue, which might also be influenced by metabolites after glucose3. Compared with R1ρ, R2 is affected by more factors.CONCLUSION
This study presents a novel MRF approach for simultaneous, quantitative measurement of T1, T2 and T1ρ relaxation times in ultra-high field settings, demonstrating excellent accuracy and high temporal resolution. Employing this method, we successfully tracked glucose uptake and clearance in the brain tissue of mice. This technique holds promise for monitoring brain glucose metabolism in clinical settings and offering more informative diagnostic tools for the detection of neurological disorders.Acknowledgements
This work is supported by National Key R&D Program of China (2018YFA0704000), and National Natural Science Foundation of China (81625011, 91859206, 81730048, 81971705).References
1. Dickie BR, Jin T, Wang P, et al. Quantitative kinetic modelling and mapping of cerebral glucose transport and metabolism using glucoCESL MRI. J Cereb Blood Flow Metab. 2022;42(11):2066-2079.
2. Xu X, Chan KW, Knutsson L, et al. Dynamic glucose enhanced (DGE) MRI for combined imaging of blood–brain barrier break down and increased blood volume in brain cancer. Magn Reson Med. 2015;74(6):1556-1563.
3. Huang J, Lai JHC, Han X, et al. Sensitivity schemes for dynamic glucose-enhanced magnetic resonance imaging to detect glucose uptake and clearance in mouse brain at 3 T.NMR Biomed. 2022;35(3):e4640.
Figures