1296
Functional MRI of the nose1Center for Magnetic Resonance Research, University of Minnesota, Minneapolis, MN, United States, 2A. I. Virtanen Institute for Molecular Sciences, University of Eastern Finland, Kuopio, Finland, 3Neurology, First Faculty of Medicine and General University Hospital, Charles University, Prague, Czech Republic, 4Department of Radiology and Biomedical Imaging, Magnetic Resonance Research Center (MRRC), Yale University, New Haven, CT, United States
Synopsis
Keywords: Head & Neck/ENT, fMRI (resting state)
Motivation: Standard fMRI techniques are unable to image the nasal cavity due to strong susceptibility artefacts.
Goal(s): Our goal is to exploit ultrashort or zero echo time imaging to study functional connectivity of the nose.
Approach: Resting-state fMRI was performed on 5 humans at 7T and 1 mouse at 9.4T. Independent component analysis (ICA) was performed, and ICA signals were analyzed within the context of other physiological signals.
Results: Highly reproducible nose networks were observed in humans. The signal of one network strongly correlated with the autonomic nervous system activity. A pronounced nose network was also observed in the mouse.
Impact: Ultrashort and zero echo time fMRI enables unprecedented performance for detecting functional nose networks providing the means to study nose activity and system-wide connections between central and peripheral nervous systems not currently possible with standard fMRI for the first time.
Introduction
The nose is the major organ responsible for olfaction and air intake (1). Due to its rich innervation by the autonomic nervous system (2,3), it can play a pivotal role in helping us to understand the complex interactions between the peripheral and central nervous systems. Yet, the characterization of system-wide functional connections of the nose is not possible with standard fMRI techniques because of signal loss resulting from susceptibility effects originating from the air-tissue interfaces. To overcome these challenges, we exploit the resilience of ultrashort and zero echo time MRI techniques to susceptibility effects for conducting fMRI studies. Previously we demonstrated that these methods are capable of providing fMRI contrast primarily mediated by blood flow (4).Method
Brain images of 5 subjects (age, mean ± SD = 51.4 ± 19.9 years, 2 males) were acquired on a 7T Siemens Magnetom scanner with a 32-channel receive NOVA head coil. Resting-state fMRI was performed with a slab-selective UTE sequence with 1070 radial view, FOV=(192 mm)3, isotropic 2 mm voxels, TR/TE=1.4/0.12 ms, flip angle=2°, 244 volumes, time for single 3D-image 1.5 s (∼6 min acquisition time). For anatomical reference, an MP2RAGE sequence was acquired with 240 slices, TR/TE=5000/2.27 ms, FOV=240×225 mm, voxel size 0.75x0.75x0.8 mm3. Also for anatomical reference, a high-resolution UTE was acquired with 4096 radial views, 24 radial interleaves, FOV=(192 mm)3, isotropic voxels of (0.75 mm)3, TR/TE=3/0.11 ms, flip angle=3.5° (∼5 min acquisition time). Throughout functional scanning, the respiratory belt and pulse plethysmograph were used to record the physiological status of the subjects. One resting state study on an awake mouse was performed at 9.4T with Multi-Band Sweep Imaging with Fourier Transformation (MB-SWIFT)(4). Transceiver surface RF-coil covering nose and brain was used. Acquisition parameters were as follows: 2047 radial views, FOV (30 mm)3, isotropic voxels (0.47 mm)3, TR=0.81 ms, flip angle 2.0°, time for single 3D-image 1.7 s. Resting-state data was collected for 5 minutes. Human fMRI data were processed using Brain Voyager QX including motion correction and coregistration to the anatomical reference. Single-subject independent components analysis (ICA) was performed with fastICA (5) and 30 independent components. For analysis of physiological signals, we used PhysioNet Cardiovascular Signal Toolbox (6) along with custom MATLAB scripts. After synchronization with MRI, pulse signals were smoothed with a Savitzky-Golay FIR filter (order 3, frame size 67 samples), and time between successive pulse wave onsets (PP) was calculated in order to obtain the heart rate variability (HRV) as the time series of the root mean square of successive differences in PP intervals (7). This signal was resampled at the fMRI temporal resolution and convolved with the human hemodynamic response function (from SPM). Pearson’s coefficient was calculated to evaluate the correlation between ICA component time courses and HRV. Respiration signals were resampled to fMRI temporal resolution, and a frequency analysis was performed. Resting-state mouse data were corrected for motion, and ICA components were estimated using FSL-MELODIC.Results
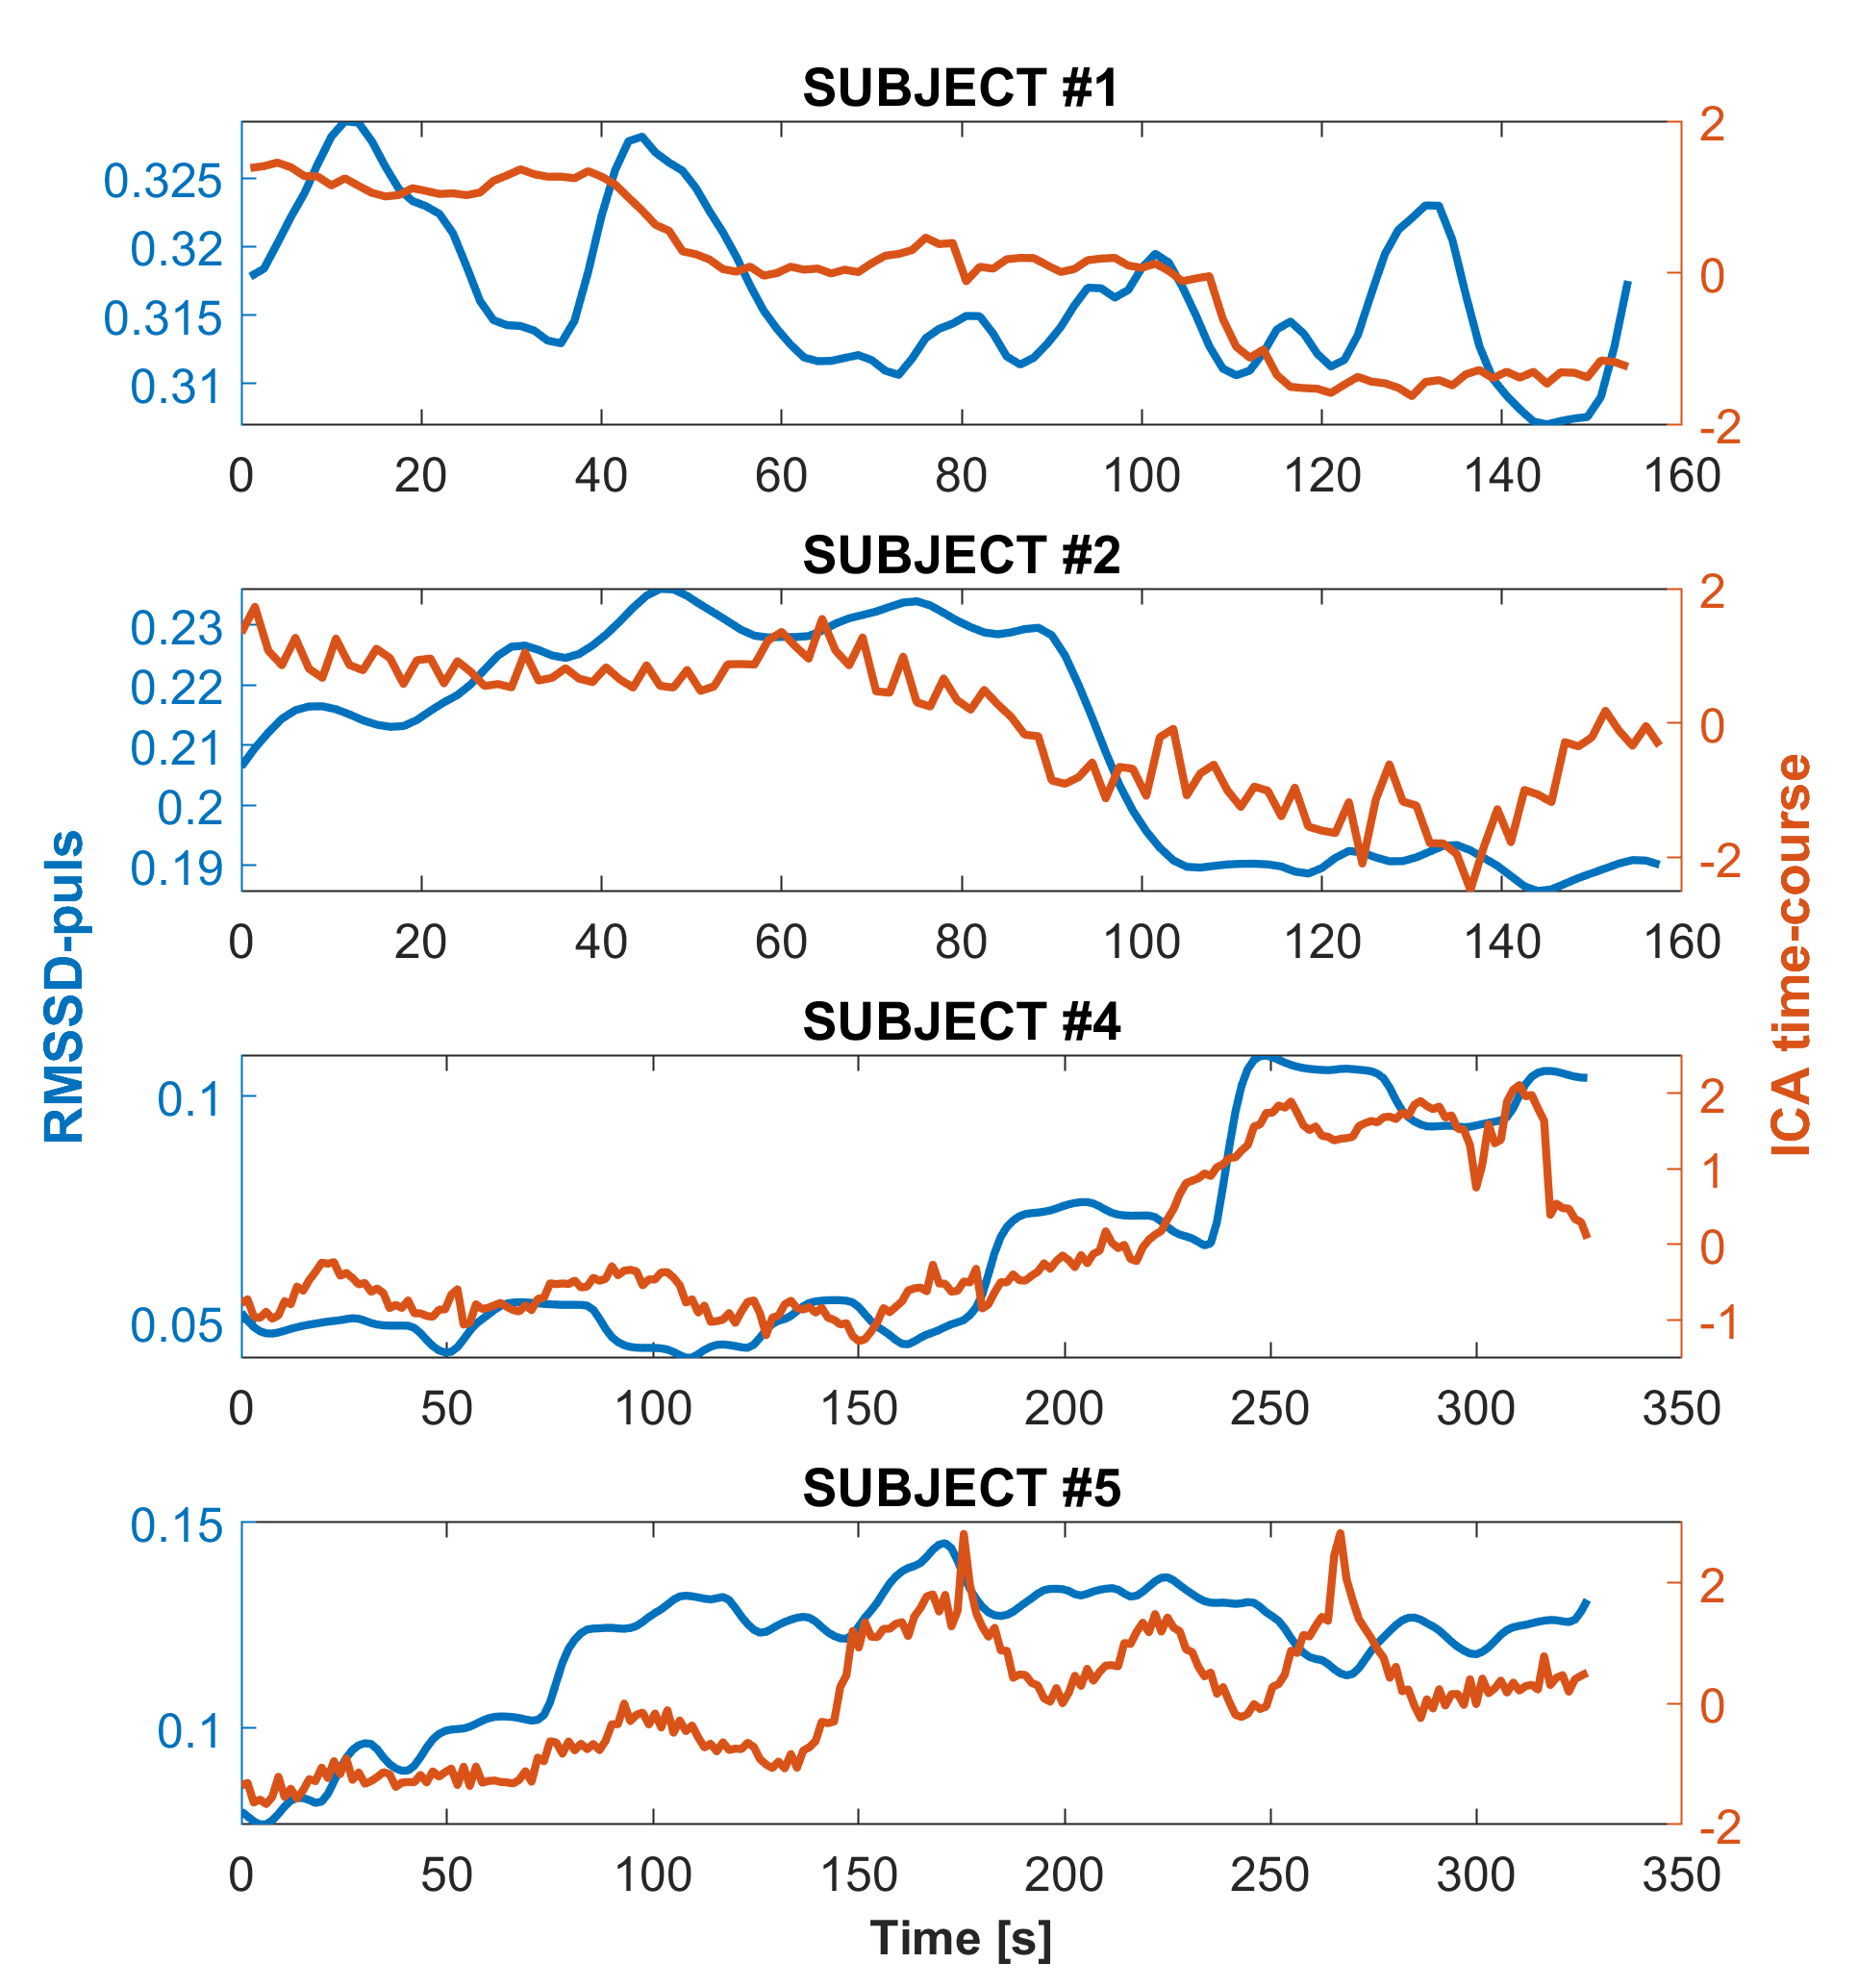
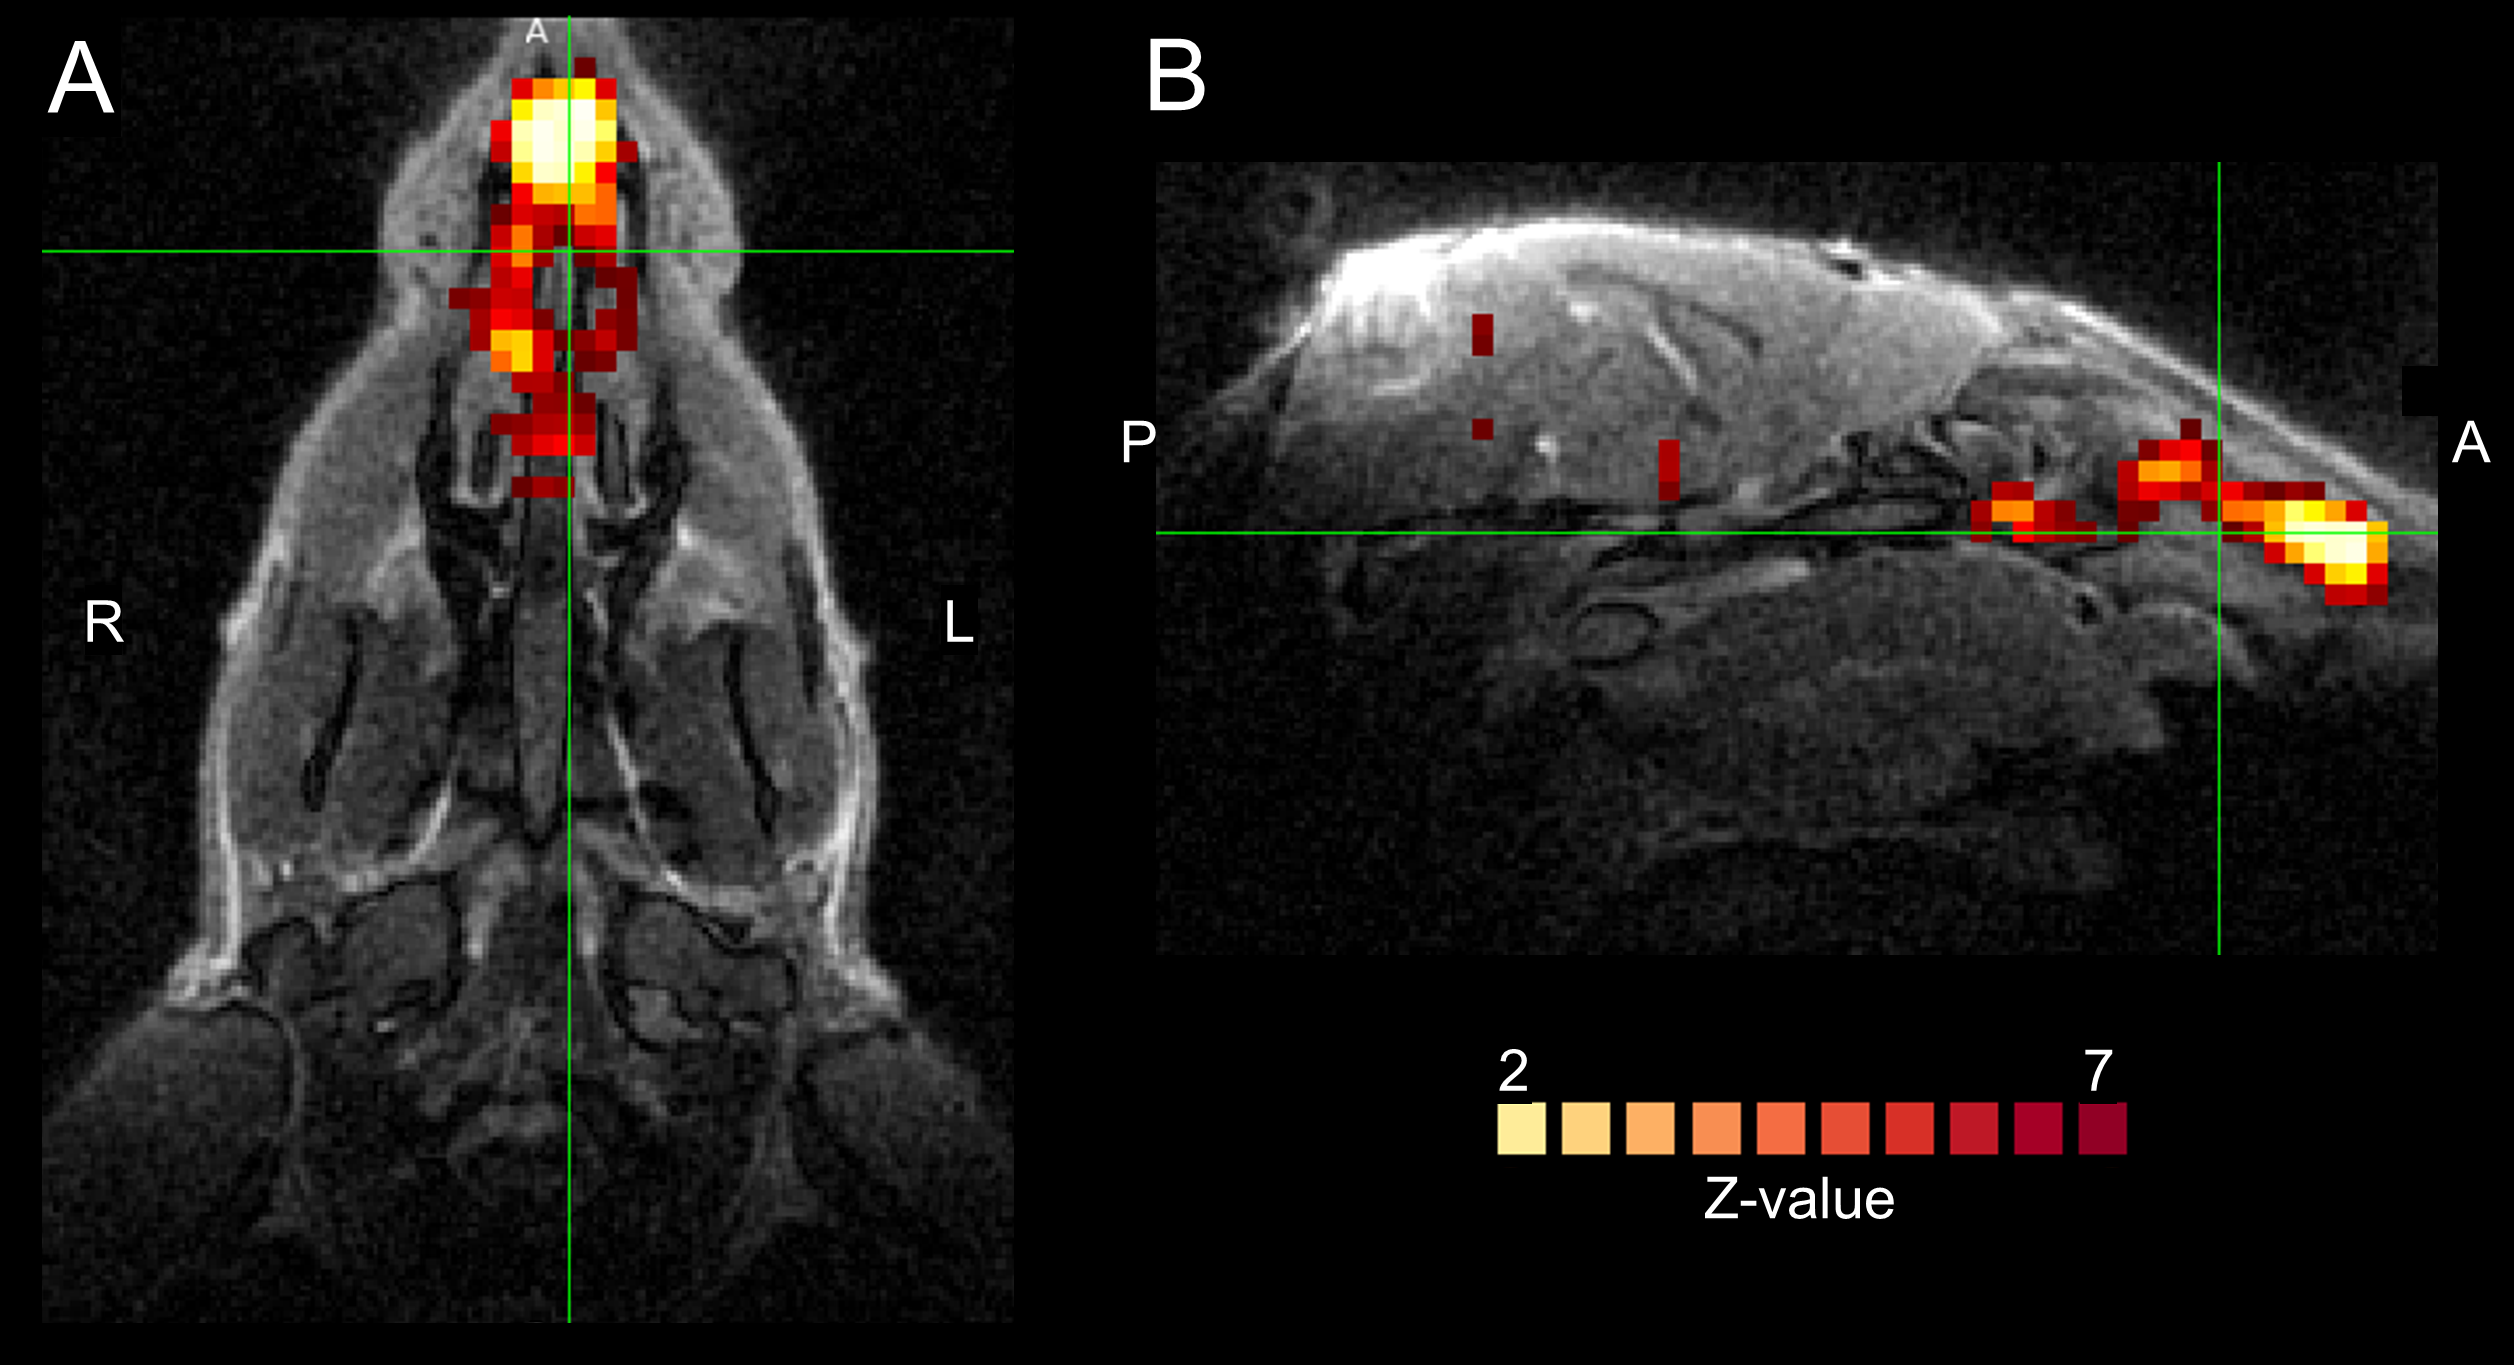
Figure 1A shows single subjects ICA z-maps of a network encompassing the nasal cavity, which was lateralized and highly reproducible. The same component is shown for one subject overlaid on the anatomical UTE with high anatomical details (Figure 1B). Figure 1C shows another network extending from the nose to CSF around the brainstem and major vessels, also highly reproducible. Figure 2 illustrates the temporal signals of those networks; the nose-only component presents only slow fluctuations, while the other component presents also higher frequency fluctuations. The signal of the nose-only component was highly correlated with the HRV (Figure 3) in all available subjects (subject #1: r=0.48; subject #2: r=0.73; subject #4: r=0.90; subject #5 r=0.68; p<0.001). No overlapping was found between the main frequency component of the respiration (between 0.2 and 0.3 Hz) and the frequency components of the ICA. At least one prominent component, resembling nose network in humans was observed also in the mouse (Figure 4).Discussion
In the current study, we demonstrate that it is possible to evaluate nose functional activity with ultrashort and zero echo time fMRI. We observed in humans robust and reproducible nose networks, one of which was lateralized on the nostril with open airways, thus reflecting the nasal cycle (8), and was strongly correlated with a proxy of HRV reflecting autonomic activity (9). Results in the mouse were consistent with the observations in humans.Conclusion
We conclude that ultrashort and zero echo time fMRI provide the opportunity to monitor nose functional networks that have been inaccessible so far with traditional BOLD techniques, opening a new investigational window into the nervous system and its related pathological changes.Acknowledgements
This work was supported by NIH grant P41 EB027061.
We thank Dr. Naoharu Kobayashi for technical support.
References
1. Dikecligil GN, Gottfried JA. What Does the Human Olfactory System Do, and How Does It Do It? Annu Rev Psychol 2023.
2. Shannahoff-Khalsa DS, Kennedy B. The effects of unilateral forced nostril breathing on the heart. Int J Neurosci 1993;73(1-2):47-60.
3. Yao A, Wilson JA, Ball SL. Autonomic nervous system dysfunction and sinonasal symptoms. Allergy Rhinol (Providence) 2018;9:2152656718764233.
4. Lehto LJ, Idiyatullin D, Zhang J, et al. MB-SWIFT functional MRI during deep brain stimulation in rats. NeuroImage 2017;159:443-448.
5. Hyvarinen A, Hoyer PO, Inki M. Topographic independent component analysis. Neural Comput 2001;13(7):1527-1558.
6. Vest AN, Da Poian G, Li Q, et al. An open source benchmarked toolbox for cardiovascular waveform and interval analysis. Physiol Meas 2018;39(10):105004.
7. Kassinopoulos M, Harper RM, Guye M, Lemieux L, Diehl B. Altered Relationship Between Heart Rate Variability and fMRI-Based Functional Connectivity in People With Epilepsy. Front Neurol 2021;12:671890.
8. Price A, Eccles R. Nasal airflow and brain activity: is there a link? J Laryngol Otol 2016;130(9):794-799.
9. Shaffer F, Ginsberg JP. An Overview of Heart Rate Variability Metrics and Norms. Front Public Health 2017;5:258.
Figures
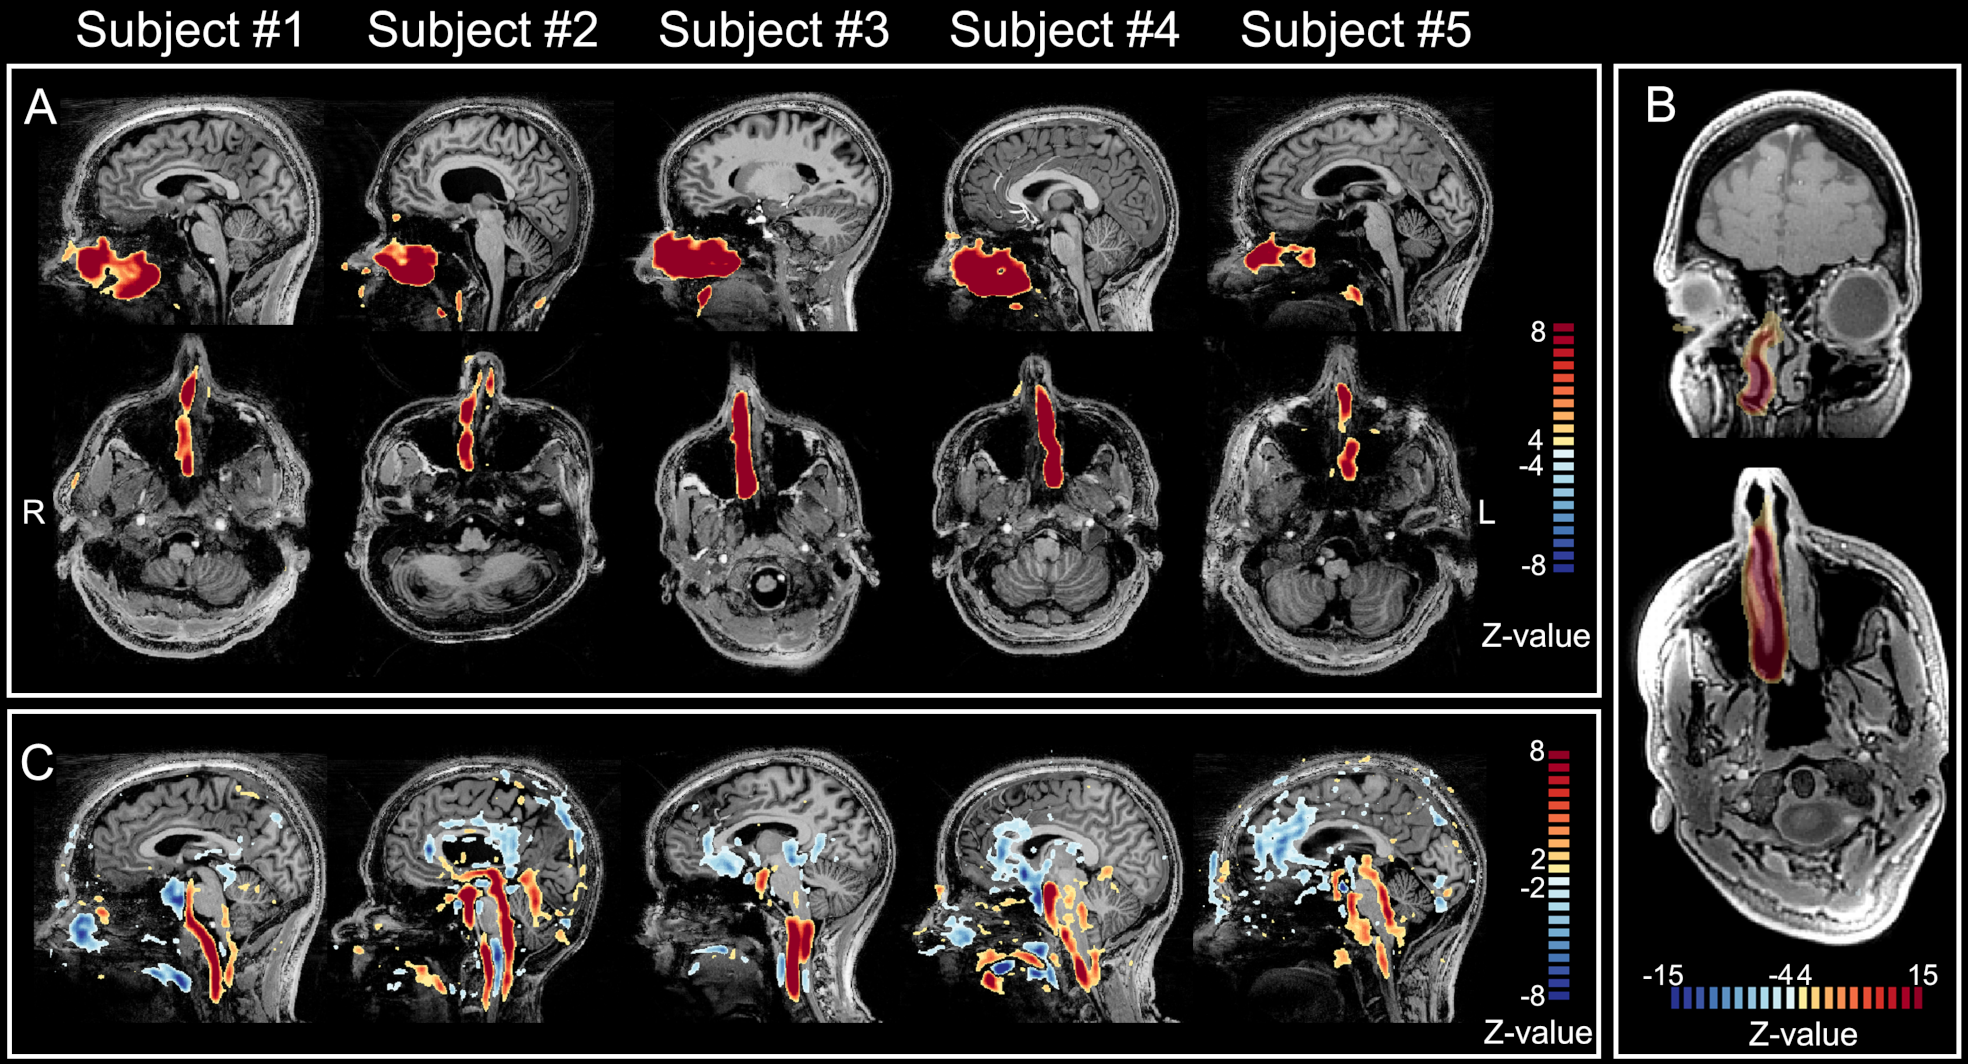
Figure1. Z-maps of two ICA components involving the nose. A) nose-only functional network in sagittal (first row) and axial (second row) view. ICA Z-maps are overlaid on MP2RAGE images (same as in C). B) the same component in subject #3, overlaid on high-resolution anatomical UTE images to better highlight the details in the nose. The nose network appears clearly lateralized on the side with a more open airway. The alternation of open nostril represents the nasal cycle. C) network encompassing nasal cavities, and CSF around the brainstem and major vessels.
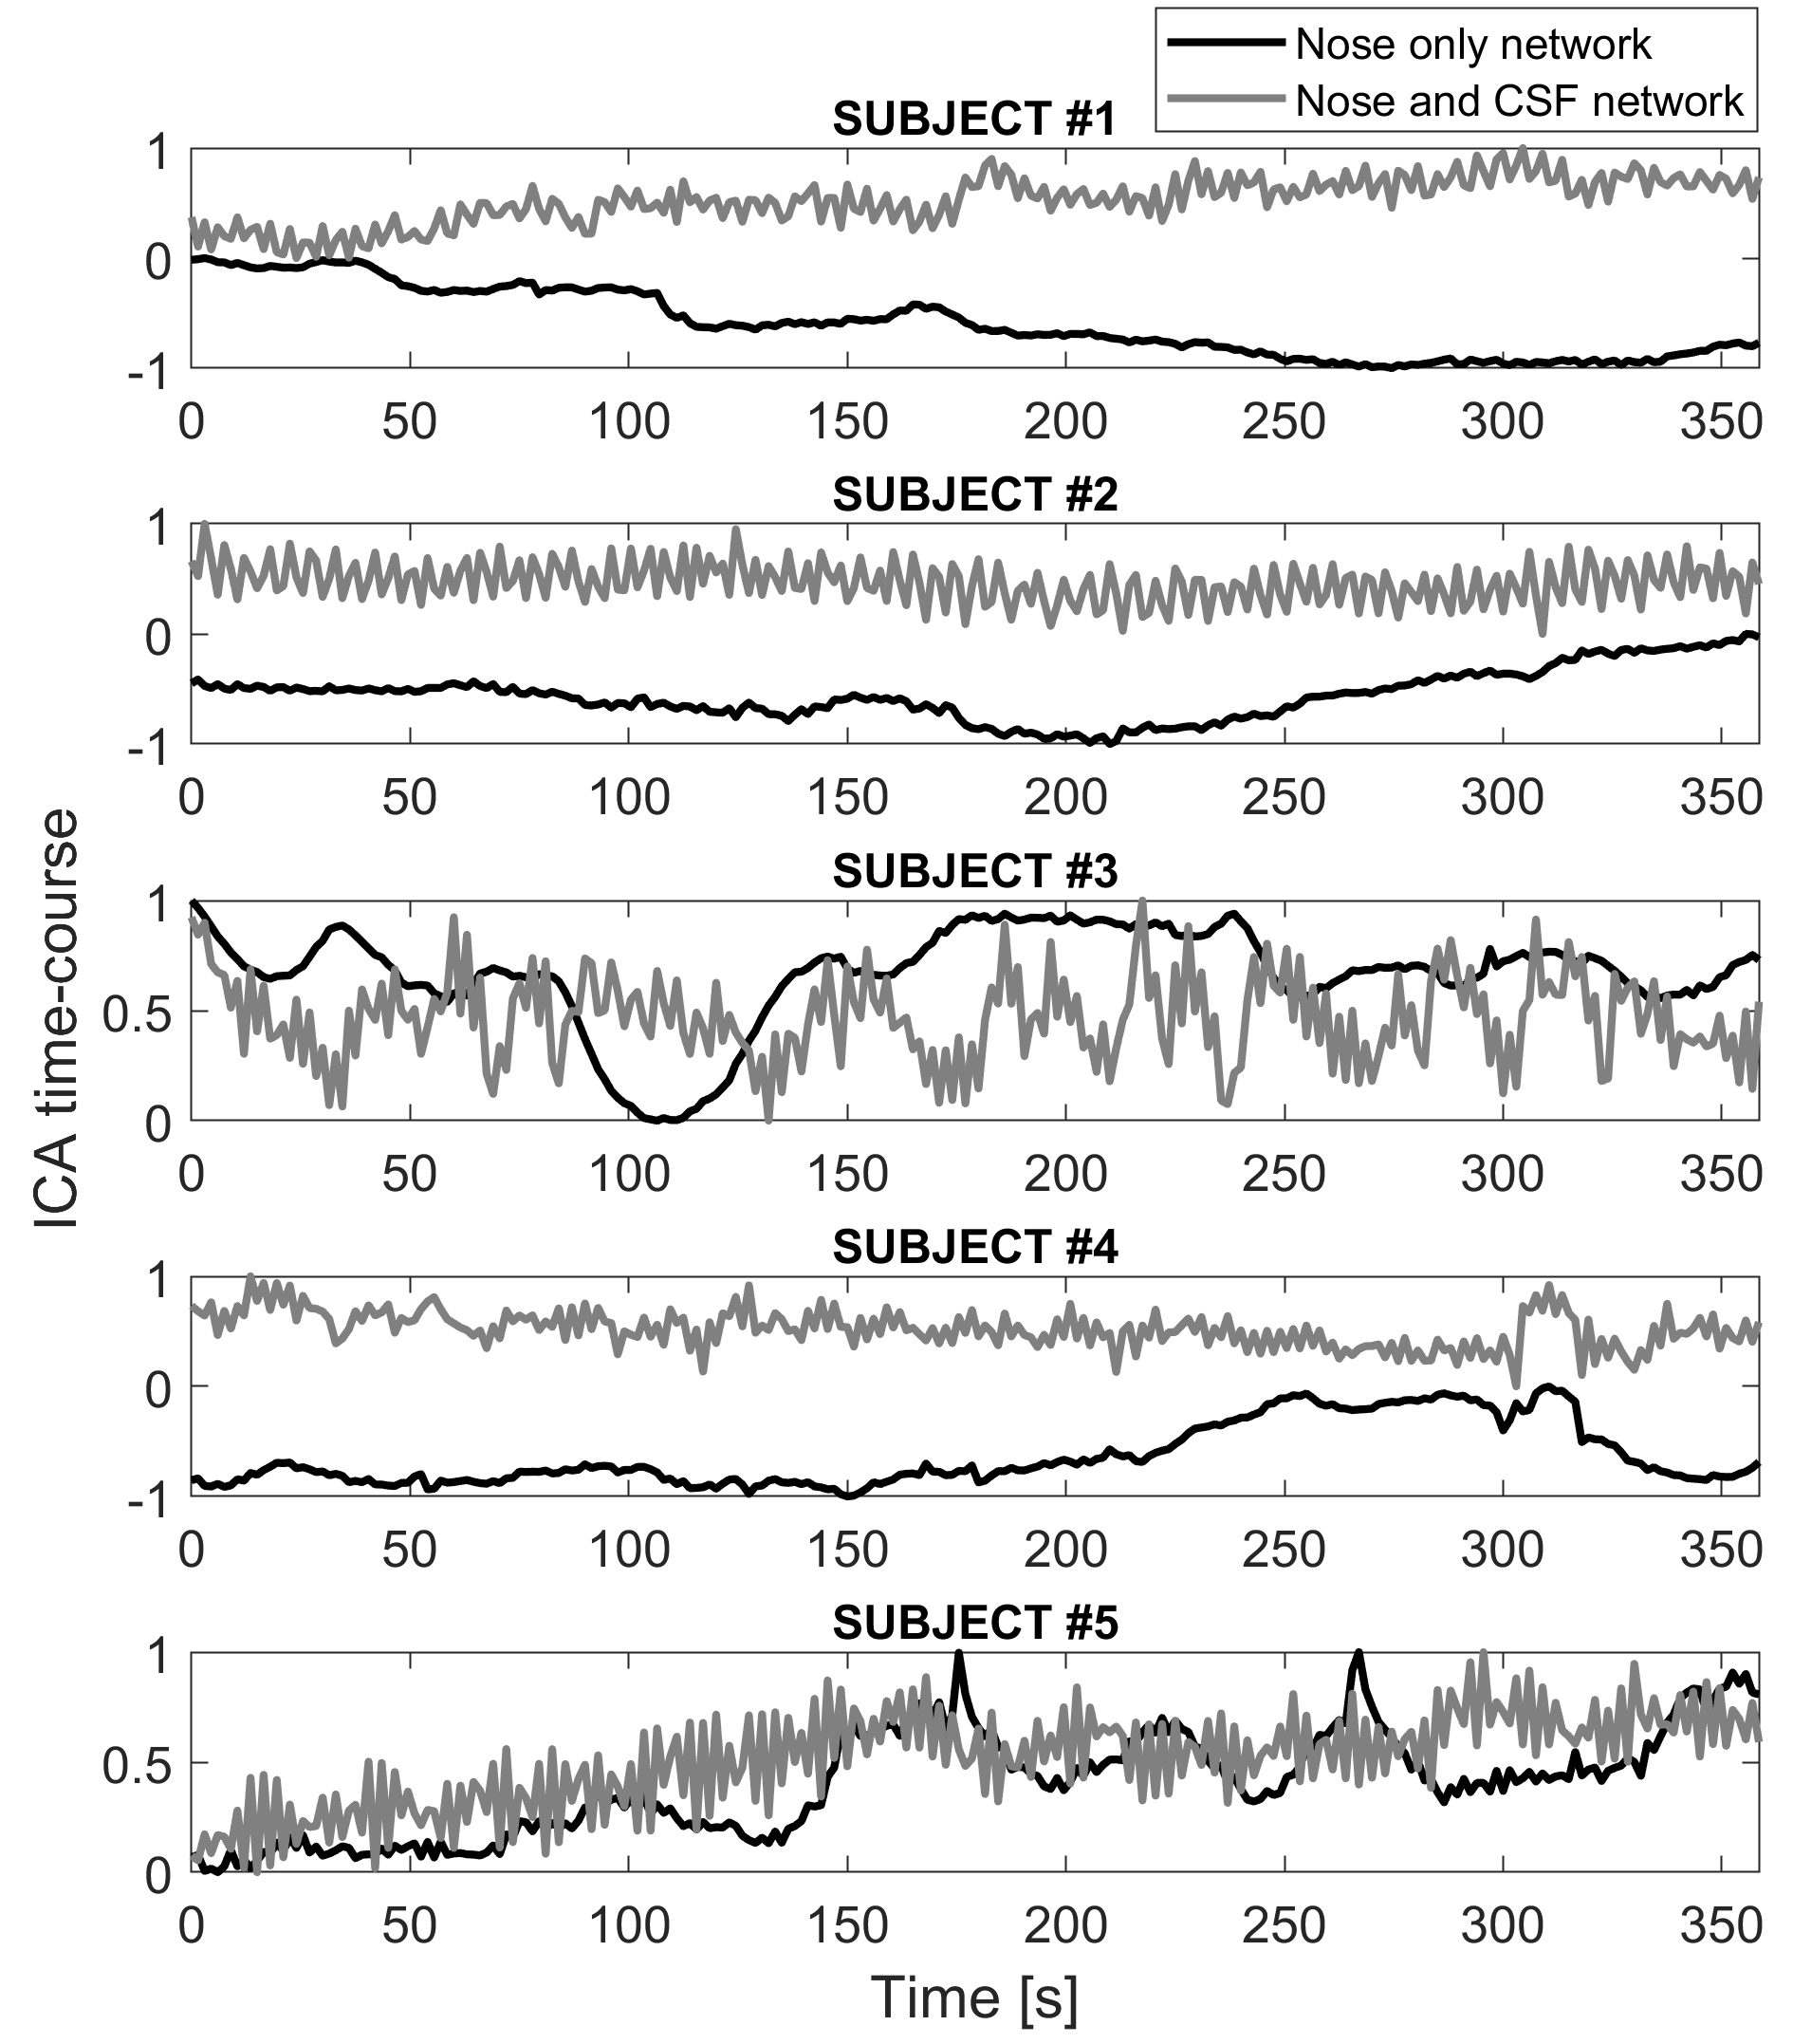
Figure 2. Temporal characteristics of the selected ICA components (z-score) for each subject. The black signal is the time course of the nose-only component characterized by very slow fluctuation. The gray signal is the time course of the network encompassing nose, CSF around the brainstem, and major vessels characterized by slow and faster fluctuations.